The following 65 page report was Submitted September 19, 2025 by physicians Dr. D. Weston Allen, Dr. Jan Breslow, and Dr. Daniel Nebert CO2 Coalition Comment on Reconsideration of 2009 Endangerment Finding and Greenhouse Gas Vehicle Standards Excerpts in italics with my bolds and added images.
Table of Contents
Climate Change and Health …………………………………………………………………………………… 3
Introduction……………………………………………………………………………………………………. 3
Warmth, Wealth and Health……………………………………………………………………………….. 3
Temperature, Morbidity and Mortality ………………………………………………………………….. 6
Future Warming ……………………………………………………………………………………………. 10
Temperature Extremes…………………………………………………………………………………….. 12
Temperature and Disease Vectors………………………………………………………………………. 15
Extreme Weather Events………………………………………………………………………………….. 24
Food, Famine, Climate and CO2 ………………………………………………………………………….. 33
Mental Health……………………………………………………………………………………………….. 37
Energy Sources and Health……………………………………………………………………………….. 39
Conclusion……………………………………………………………………………………………………. 44
References……………………………………………………………………………………………………. 45
Some examples of Climate Medical Mischief
Introduction
Human health, morbidity, mortality and longevity are significantly impacted by climate. This review examines the evidence for past, present and possible future human health impacts of climate change and its ramifications. It will also examine the health impacts of different energy sources and climate actions. It will not examine every link in the literature to a range of conditions where attribution is implausible or tenuous, or where association assumes causation.
Warmth, Wealth and Health
Davis et al (2003)23 found a 74.4% decline in heat-related mortality in 28 of the largest U.S. cities from 1964 to 1998 and estimated that another 1⁰C increase would further reduce the net mortality rate.24 Analyzing over 74 million deaths in 384 locations across 13 countries, Gasparrini et al (2015)25 found that cold weather was over 17 times more lethal than hot weather: 7.3% of all deaths due to cold and 0.42% from heat. Masselot et al (2023) found cold weather to be ten times more lethal than hot weather across Europe and forty times more so in northern Europe.26 Their visual display of this difference (Fig. 1) was camouflaged by making the X-axis for heat-related deaths 5.6 times greater than the X-axis for cold-related deaths!
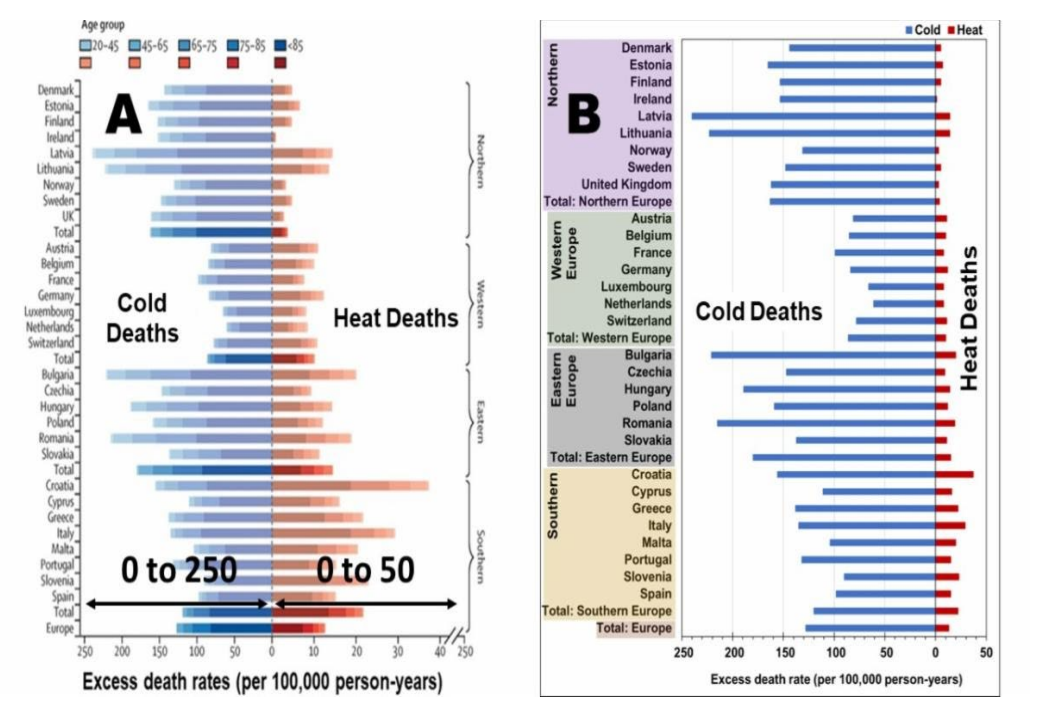
Figure 1: Temperature-related mortality in European cities from Masselot et al. 2023 (A) As depicted in the Lancet (B) Identical X-axis for heat and cold, corrected by the CO2 Coalition
Temperature and Diseases
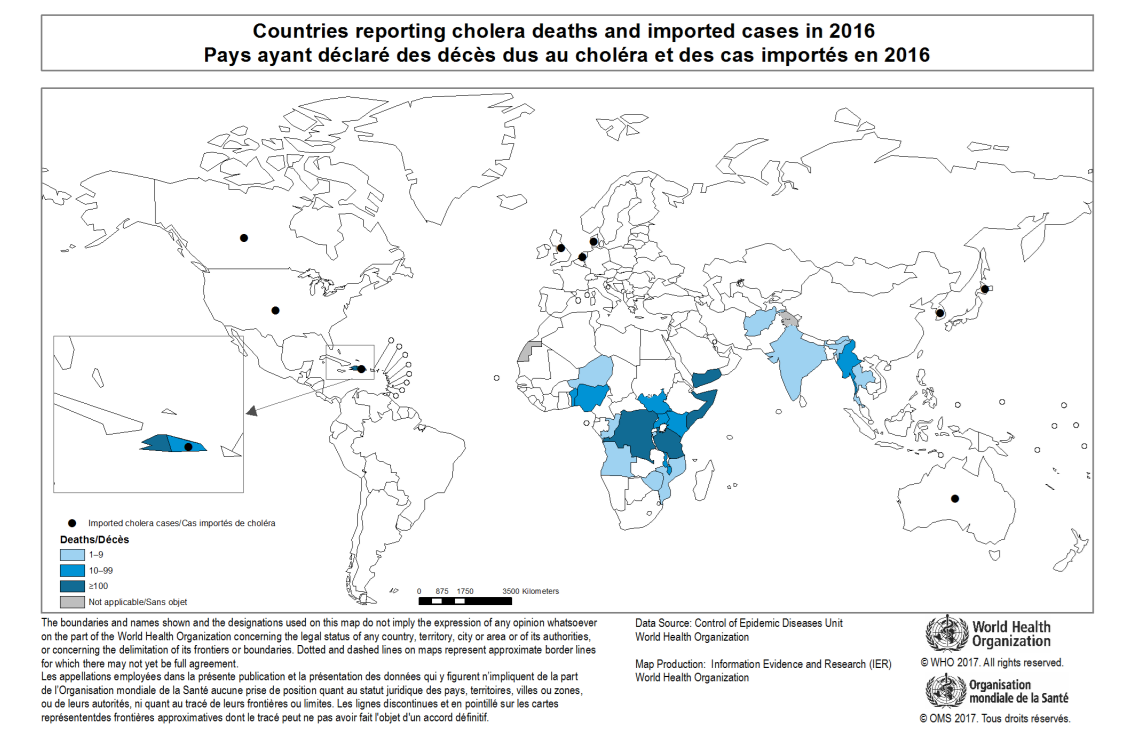
Cholera, which afflicts 3-5 million people and kills about 100,000 annually,76 is now confined to developing countries in the tropics and subtropics (Fig. 5). When an epidemic broke out in London in 1848, Dr. John Snow performed the world’s first epidemiological studies in linking itto contaminated water. Nearly a century and a half later, a paper in the prestigious journal Science77 linked a 1991 outbreak in South America to climate change. The real cause, however, was a failure of the Peruvian authorities to properly chlorinate water supplies.78 Climate change can be a convenient scapegoat for government failure!
Temperature Extremes
Deadly heatwaves such as the European one in 2003 are often attributed to climate change.93
Temperatures elsewhere across the globe at the time, however, were normal or below normal (Fig.
7).94
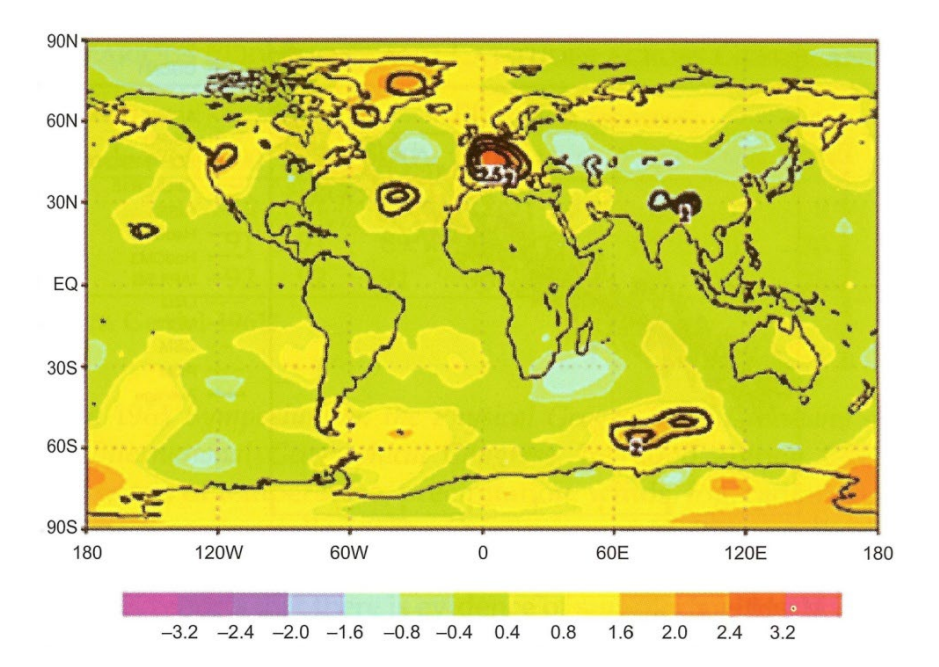
Figure 7: Global tropospheric temperature anomalies, June-August 2003. Source: Chase et al. (2006)
The 1936 North American heatwave during the Dust Bowl decade set record temperatures across 14 states, reaching 49⁰C in Steele, North Dakota, and killed at least 5,000 people.99 The 1954 summer-long heatwave across the Midwest, reaching 117⁰F (47.2⁰C) in East St Louis, ranks as the hottest in 11 states (Fig. 8) based on an analysis of Midwest temperature records from 1845 to 2009.100 Nancy Westcott (2011) also found a reducing trend of heatwaves over the 20th century.
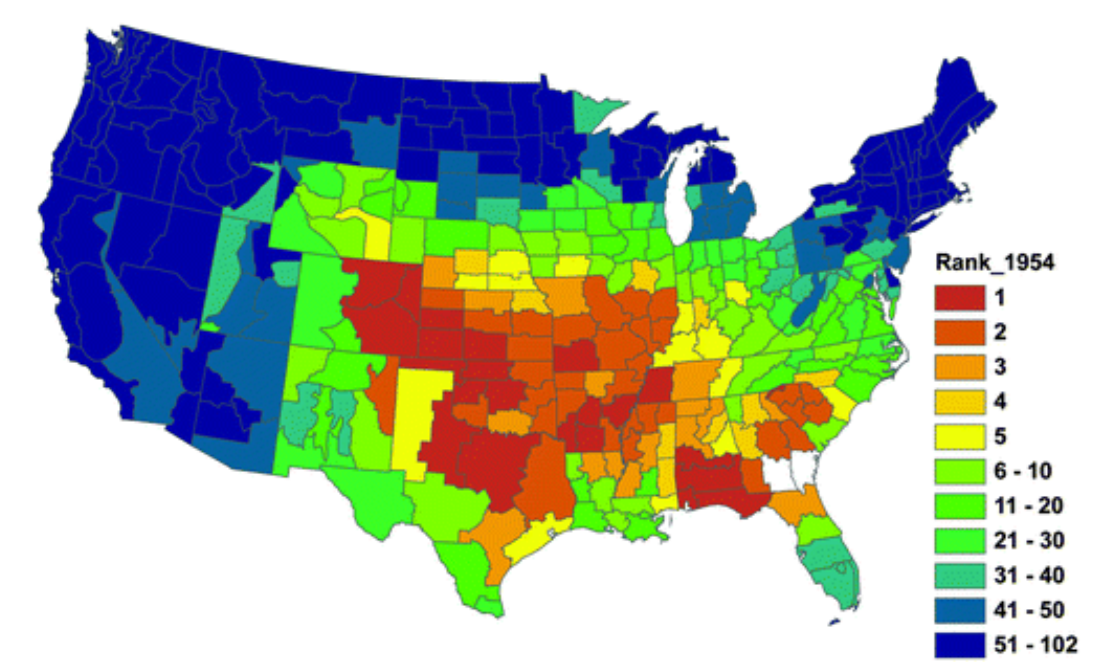
Figure 8: Rank of the June–September 1954 heat wave based on National Climatic Data Center (NCDC) climate division temperature data for the years 1895–2009. Source: Westcott (2011)
Temperature and Disease Vectors
West Nile Virus (WNV) was first identified in a West Nile district of Uganda in 1937. It is asymptomatic in 80% of infected people but can cause severe encephalitis or meningitis in about 1 in 150 infected persons, especially the elderly or immunocompromised. It is transmitted by a Culex species of mosquito that has bitten an infected bird (not human). Appearing in New York in 1999 and spreading across the states taking hundreds of lives, it was soon linked to climate change. 173 174 But its rapid spread from northeast to the south and west (Fig. 12) and its decline despite warming (Figs. 13 and 14) indicates that the vector was already there and climate change had nothing to do with that.
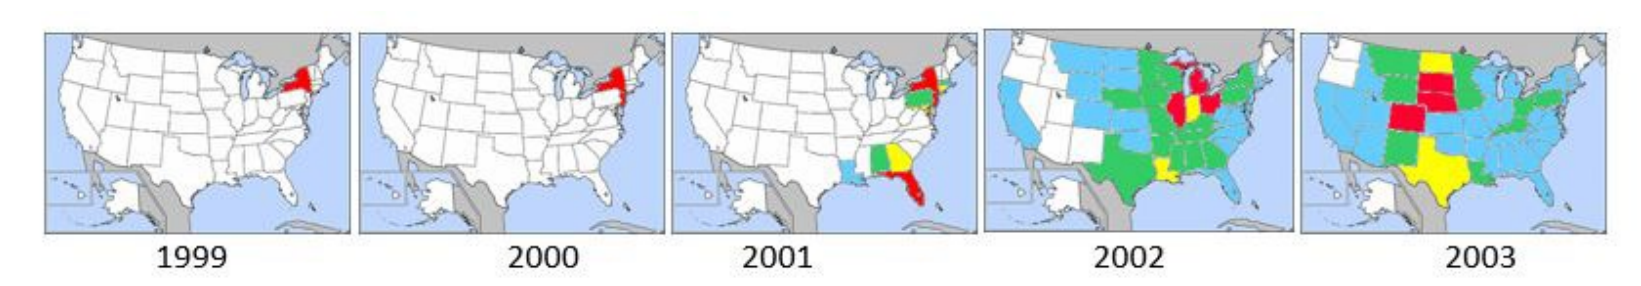
Figure 12: Progress of WNV in the U.S. 1999-2003. White 0, Blue <1%, Green1-5%, Yellow 5-10%, Red >10%
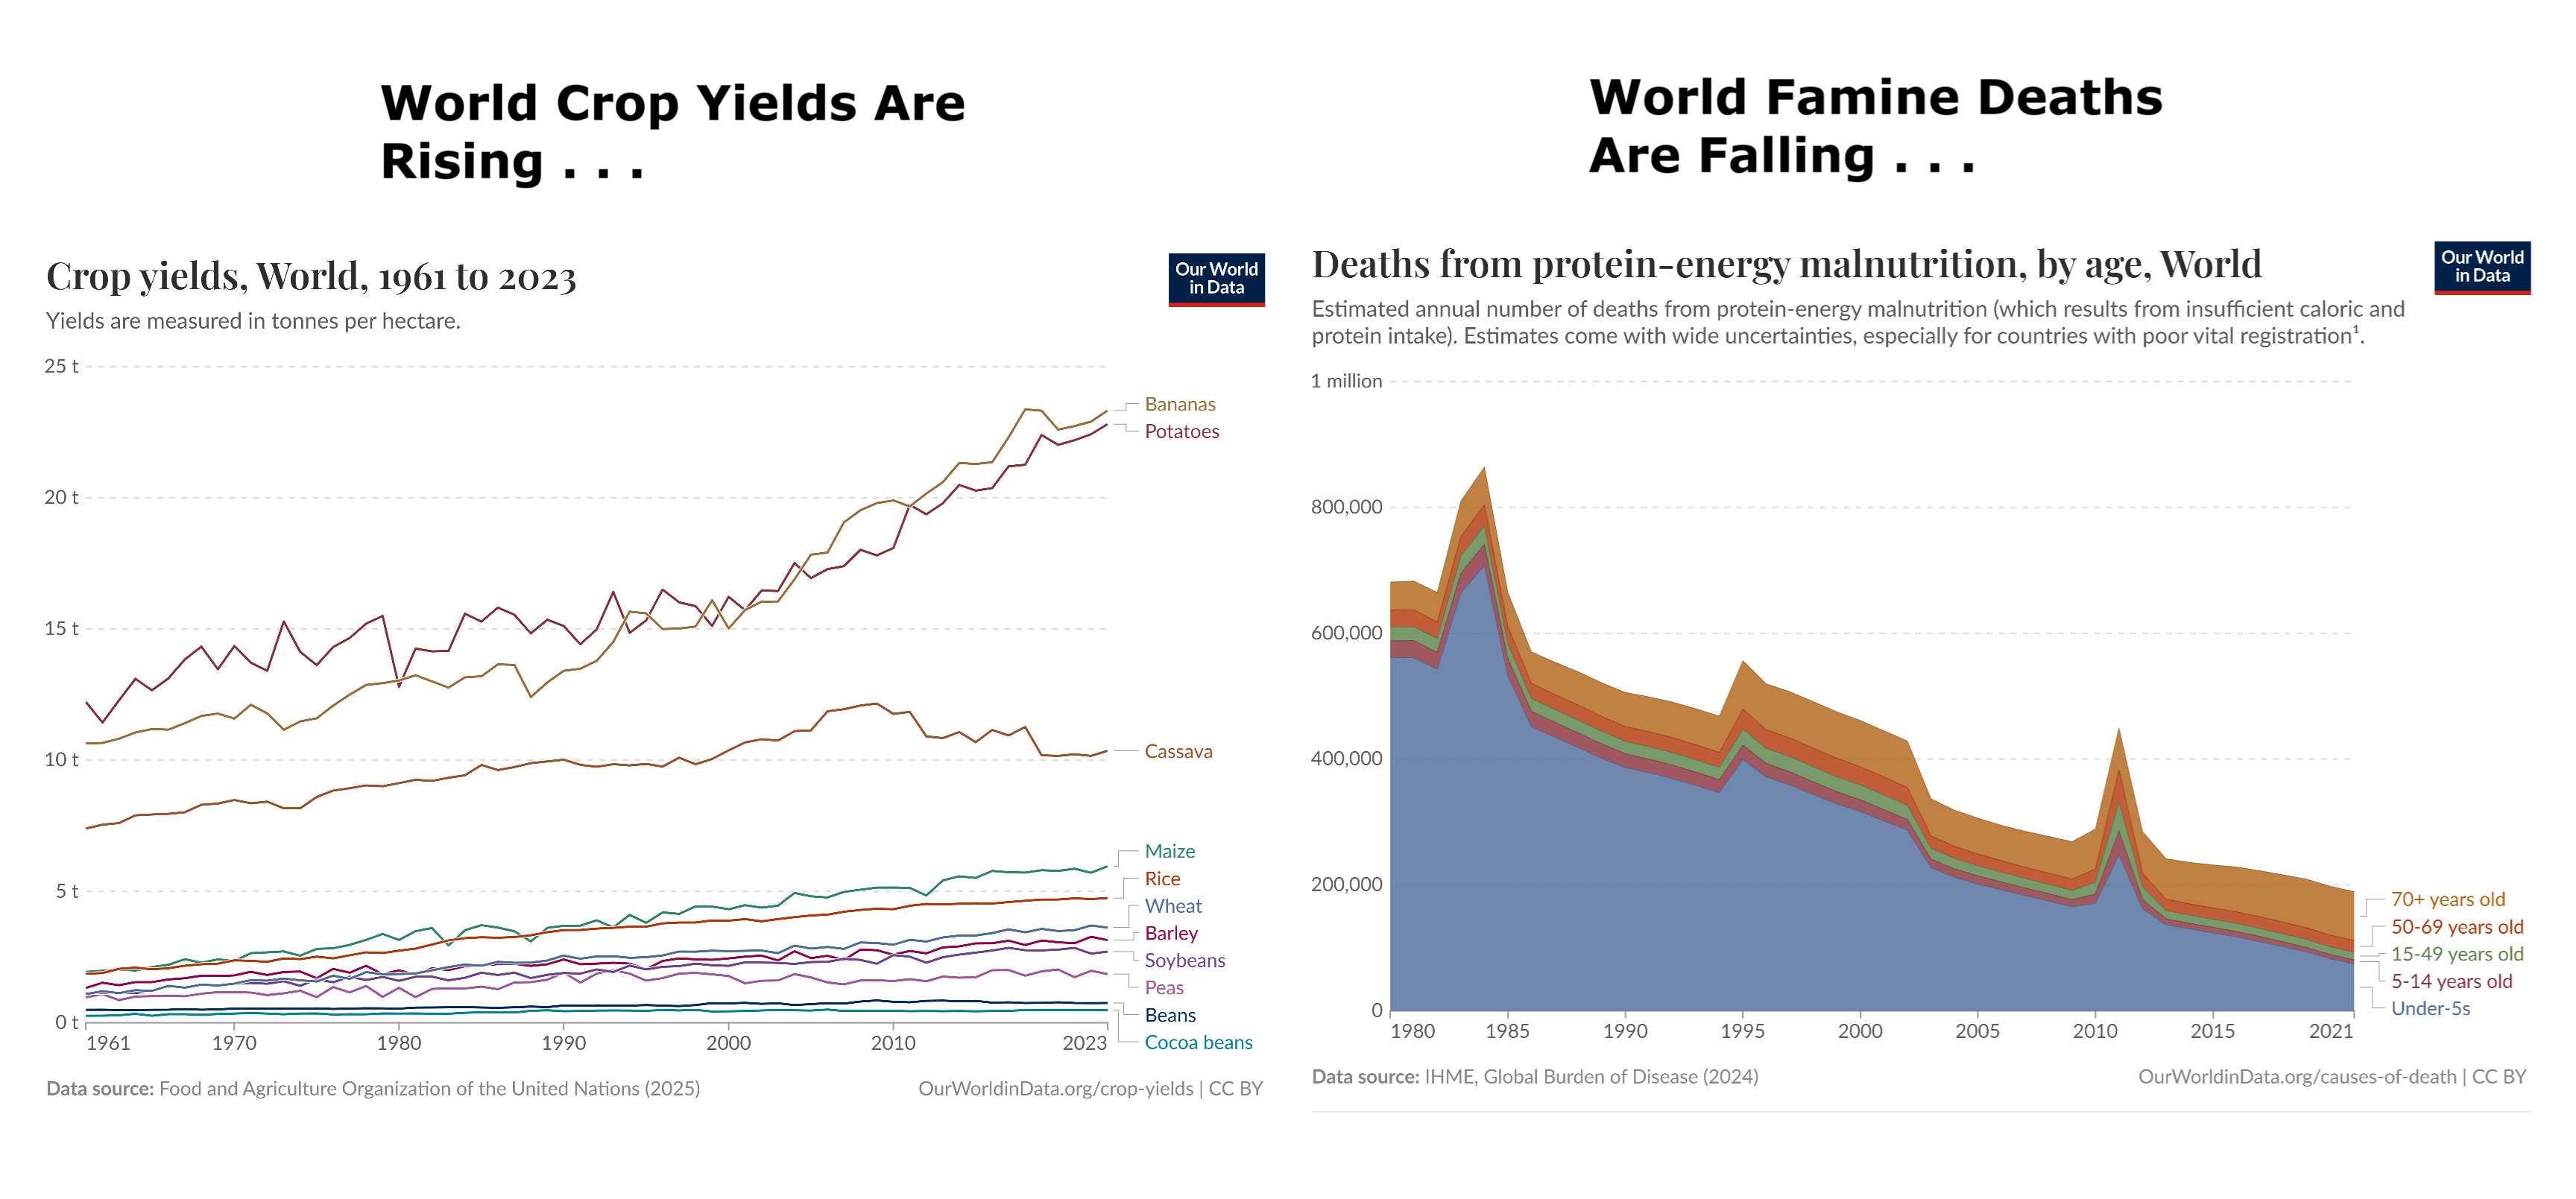
Food, Famine, Climate and CO2
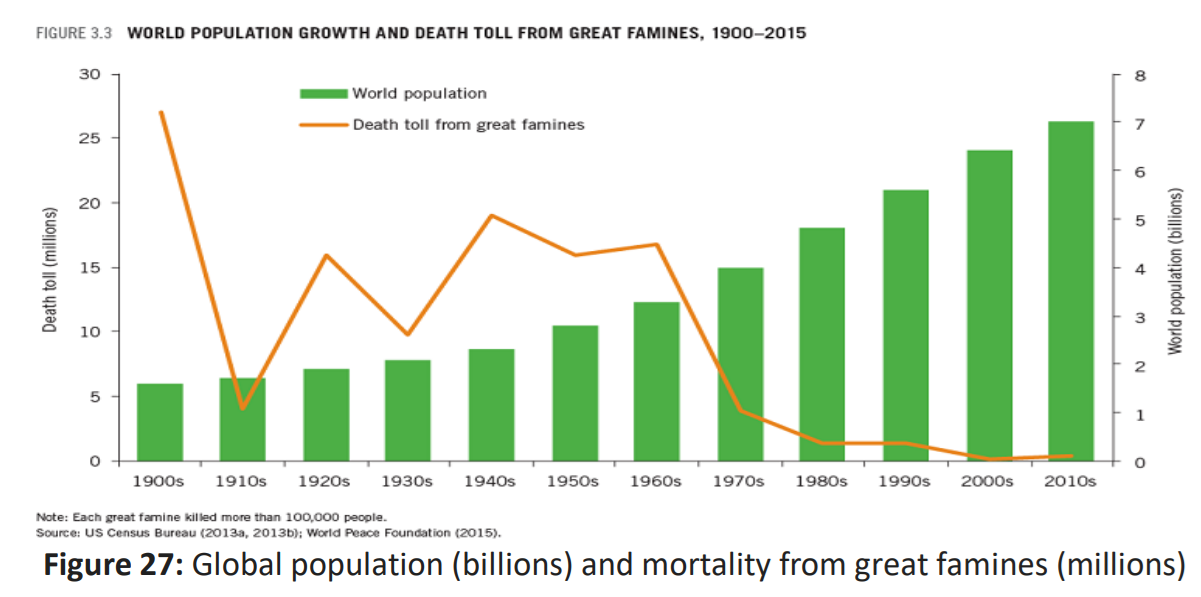
In his 1968 book The Population Bomb, Paul Ehrlich predicted widespread famine with hundreds of millions starving to death in the 1970s, but the death toll declined as the population grew
(Fig. 27).
The U.S. National Bureau of Economic Research matched satellite-based observations of outdoor CO2 levels across the U.S. with county-level agricultural output data and other economic variables and concluded that CO2 emissions had boosted U.S. crop production since 1940 by 50 to 80%, much larger than previous estimations using FACE experiments, and found that every ppm of increase in CO2 boosts corn yields by 0.5%, soybeans by 0.6%, and wheat by 0.8 % (Fig. 29).305
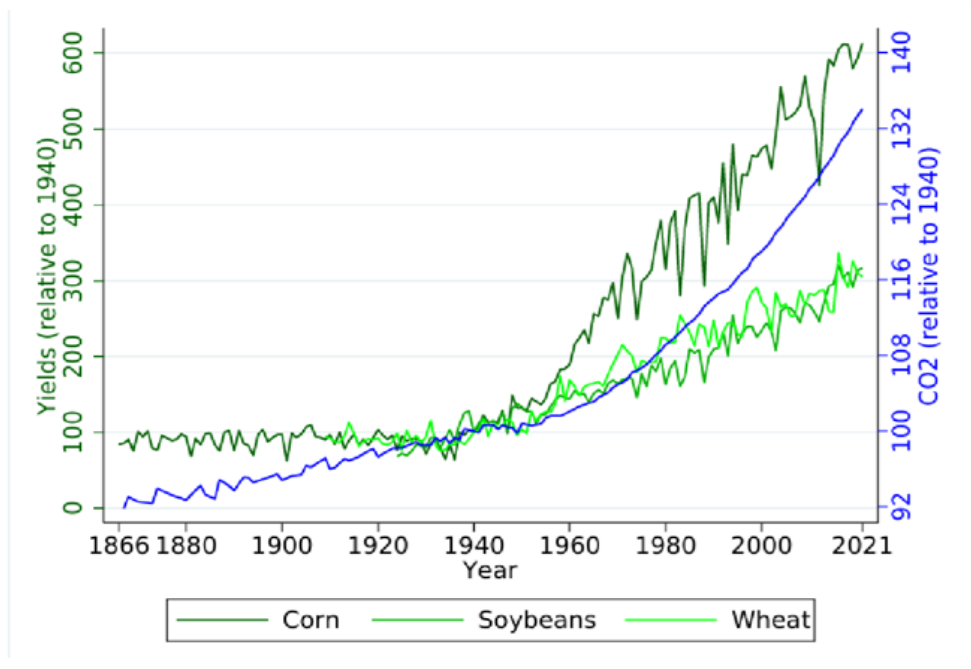
Figure 29: U.S. average CO2 levels and yields of corn, soy and wheat all normalized so 1940=100. Source: Taylor and Schlenker (2023)
Mental Health

Dire predictions are often based on flawed models, exaggerations, wild imaginations and a failure to factor in human ingenuity.335 Predictions made in the 1970s of an impending ice age, falling crop yields, increasing global famine, advancing deserts, a pesticide-induced cancer epidemic, of oil, gas and other resources rapidly running out, were not only wrong but the very opposite has happened.

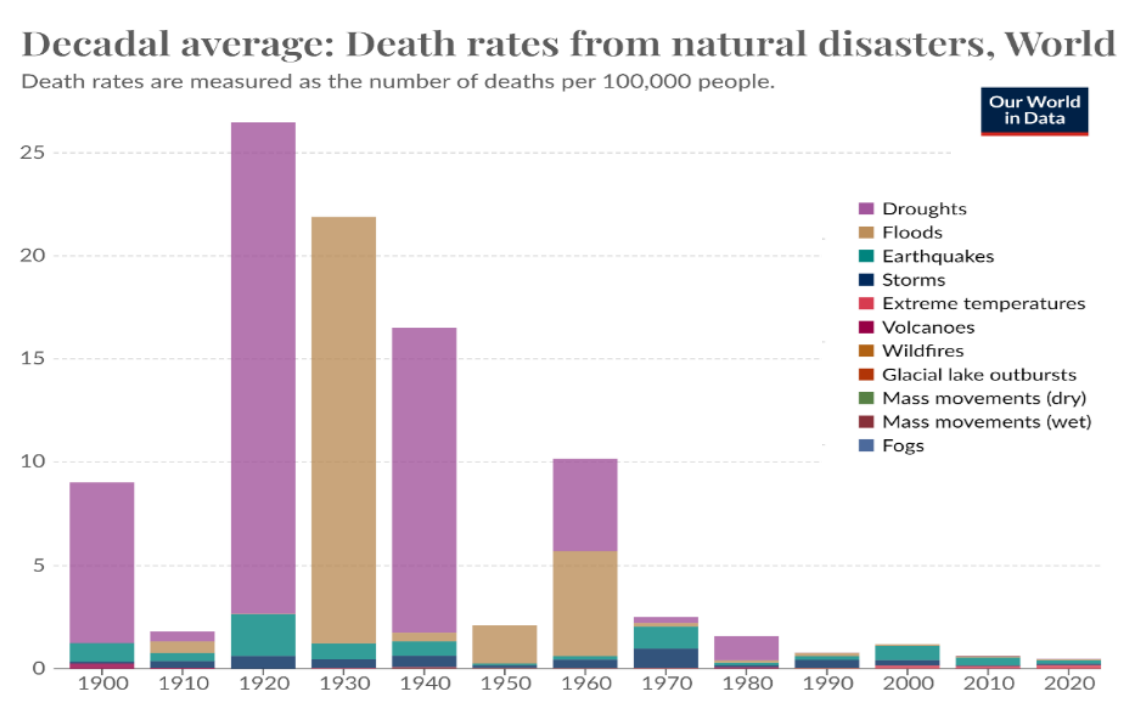
More recent predictions of malaria spreading across the globe, Arctic ice disappearing by 2013, increasing droughts and tropical cyclones have all failed to materialize. Indeed, the world has never been safer than now (Fig. 30).
The academic left first quarreled with science339 before capturing, corrupting and politicizing it. They then ignored quantitative uncertainties343 to contrive a catastrophic climate change consensus, calling sceptics deniers and inventing a climate crisis and global boiling to foster fear, funding and a rush to renewables. Anthropocentric purists prohibit alternative diagnoses, prognoses, priorities or remedies and suspect fossil fuel funding behind anyone challenging “The Science”. Climate change does impact the poorest the most but, as we shall see in the next section, a lucrative climate industry makes them even poorer and more vulnerable.

Conclusion
Warmth is good for human health and prosperity. Fossil fuels have played a vital role in providing the wealth essential for health and environmental protection. They have also boosted atmospheric CO2 and added a little warmth, both being hitherto beneficial overall for plants and people. The ingenuity of Homo sapiens at adapting to climate has permitted people to populate almost the entire globe from the freezing Arctic to the steamy tropics. If we stick to doing what we do best – adaptation – we will continue to thrive.
We must be prepared not only for global warming, but also for global cooling,
which will surely occur as our present warm Holocene draws to its inevitable end.

Human health and that of the planet depends on balancing productivity and development with conservation and environmental protection. Only developed countries with people lifted out of poverty can afford to produce clean energy, protect the environment, put power lines underground, construct buildings with 5-star energy ratings and use efficient lighting/appliances to minimize energy and water use, provide adequate safe water supplies and effective public health measures to control communicable diseases. It is vital that governments focus on real pollutants, not imagined ones, and that they avoid using climate change as a scapegoat for failure to implement sound public health policies and proven preventive measures. Misguided climate action can be worse than unmitigated climate change.
The 2014 IPCC Summary for Policymakers nicely summed it up:
“The most effective vulnerability reduction measures for health in the near term are programs that implement and improve basic public health measures such as provision of clean water and sanitation, secure essential health care including vaccination and child health services, increase capacity for disaster preparedness and response, and alleviate poverty (very high confidence).”

The greenhouse effect is clap-trap.
LikeLike