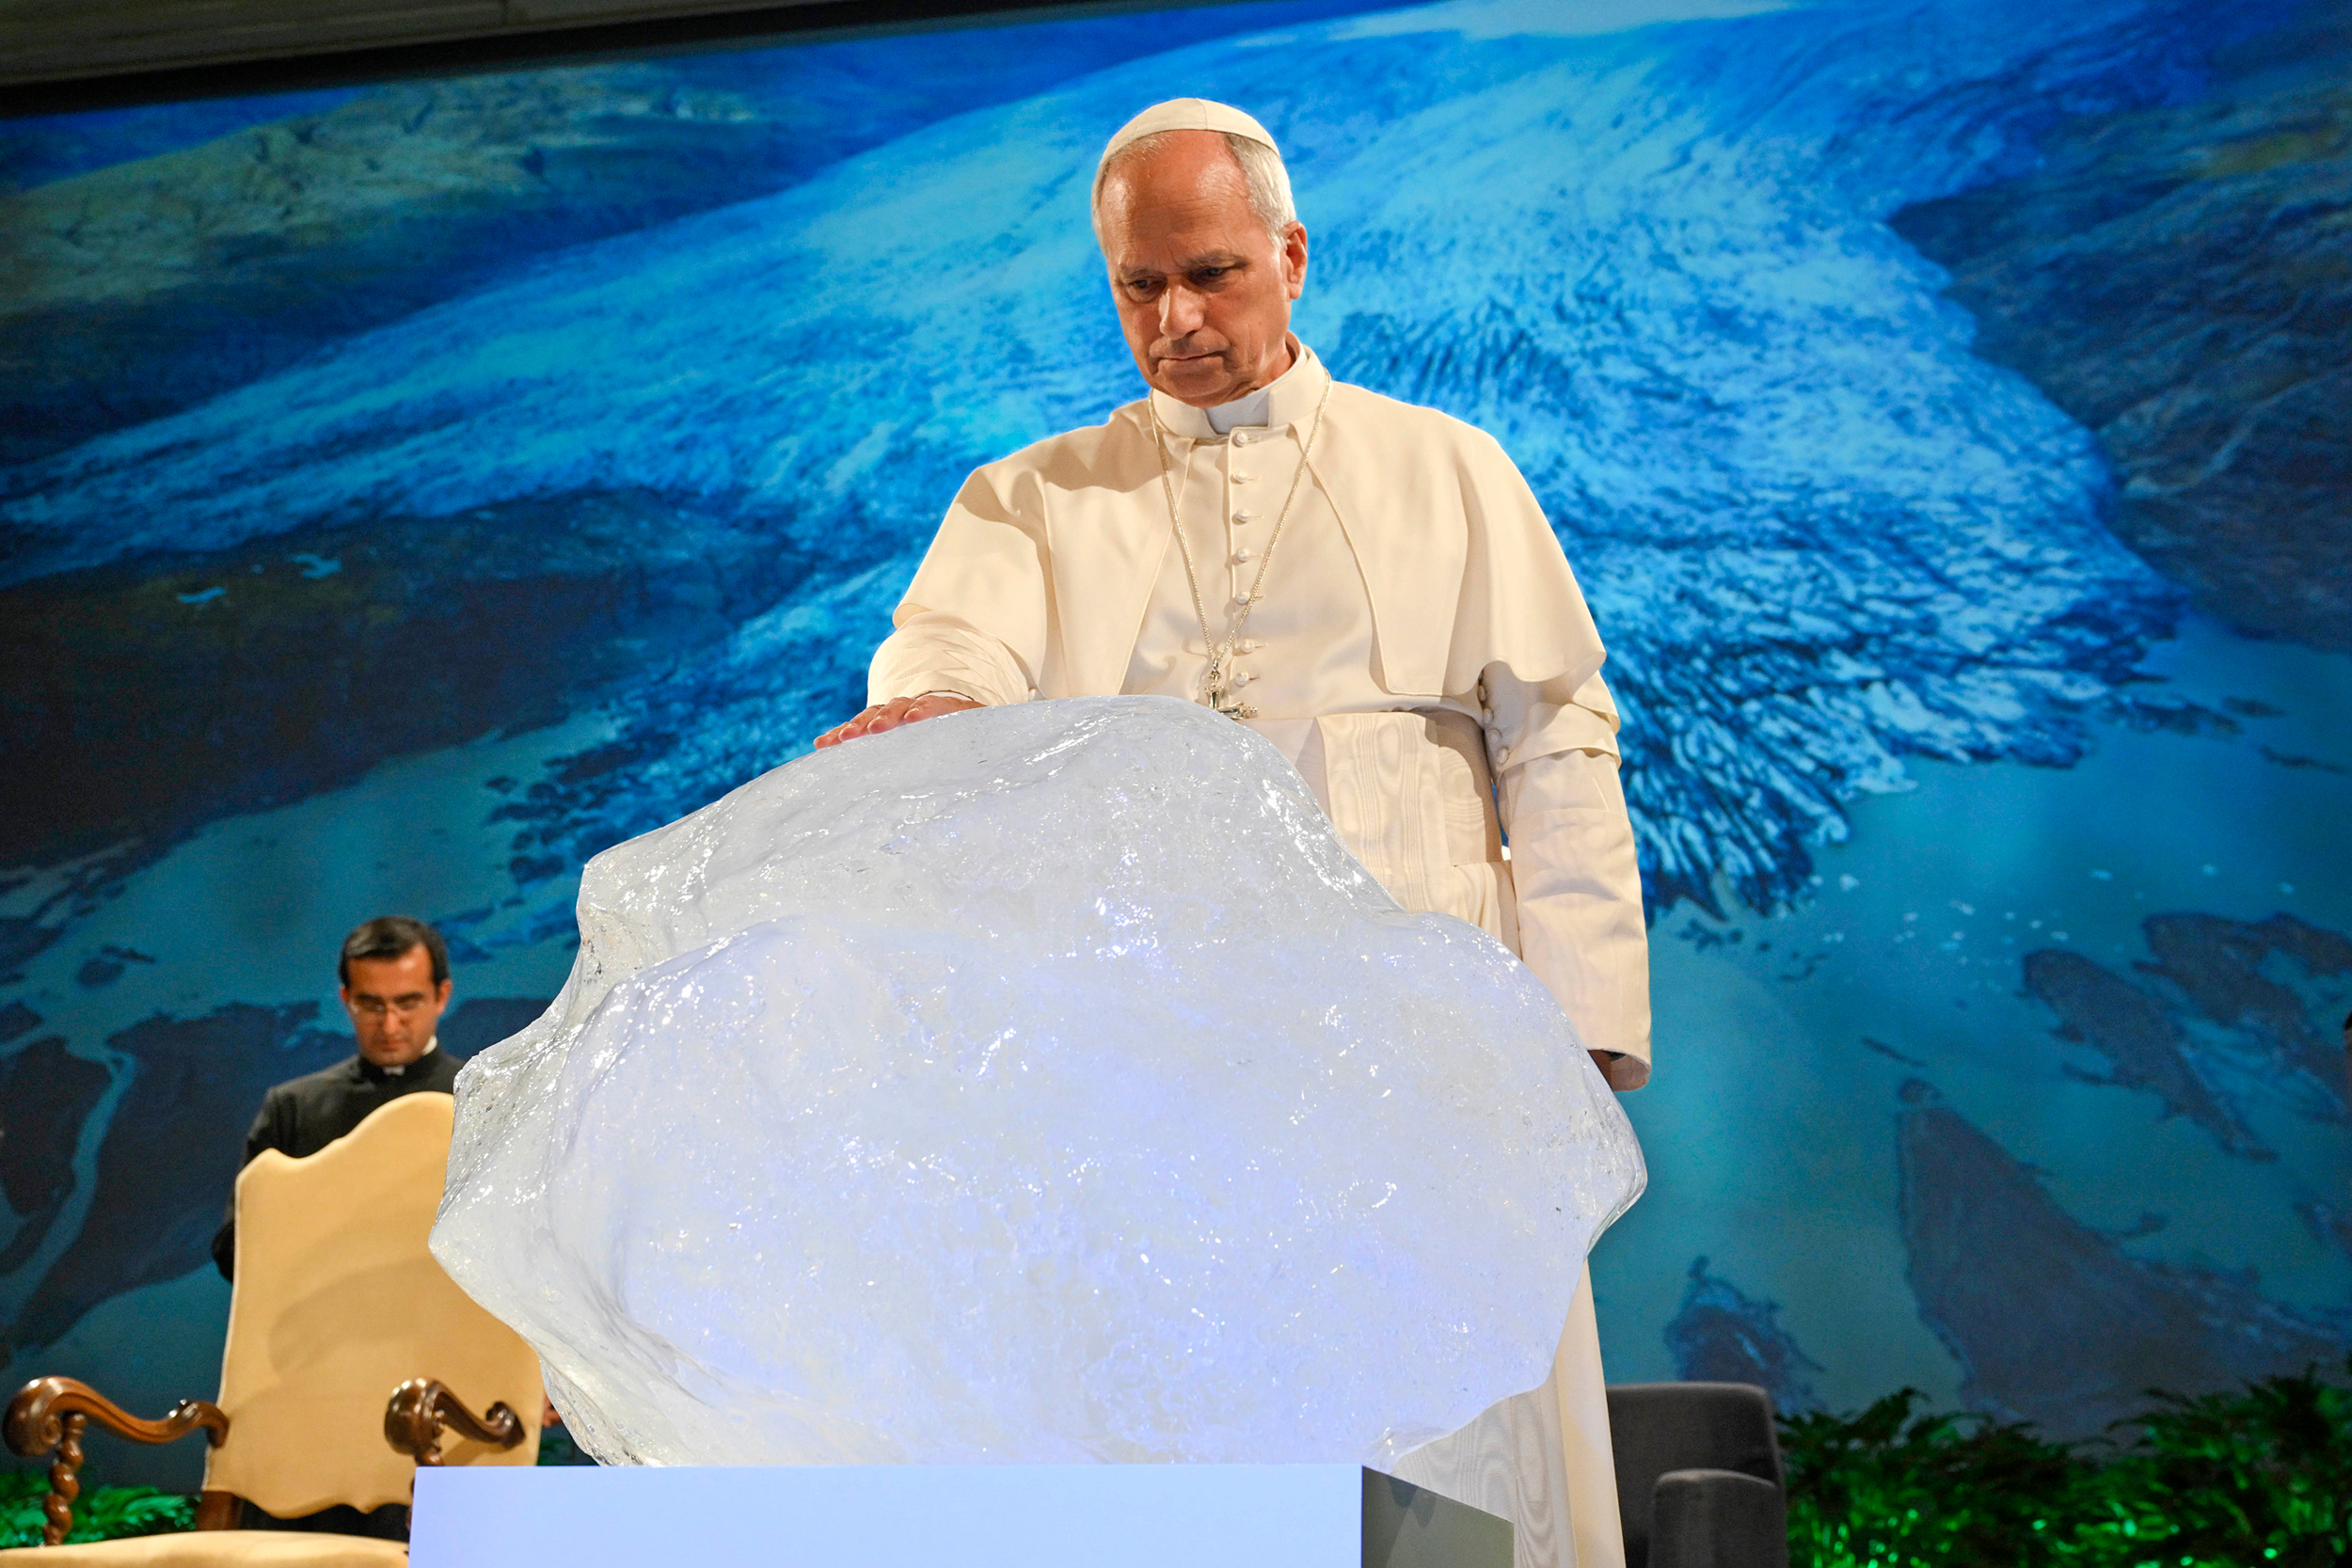
Last Wednesday Pope Leo spoke before a slowly melting chunk of glacial ice in Vatican City in his first address on climate change. The pontiff addressed a crowd of roughly 1,000 attendees and called on people all over the world to demand action on climate from their governments. This post presents evidence the Arctic is already heeding his call, growing by leaps and bounds. /sarc
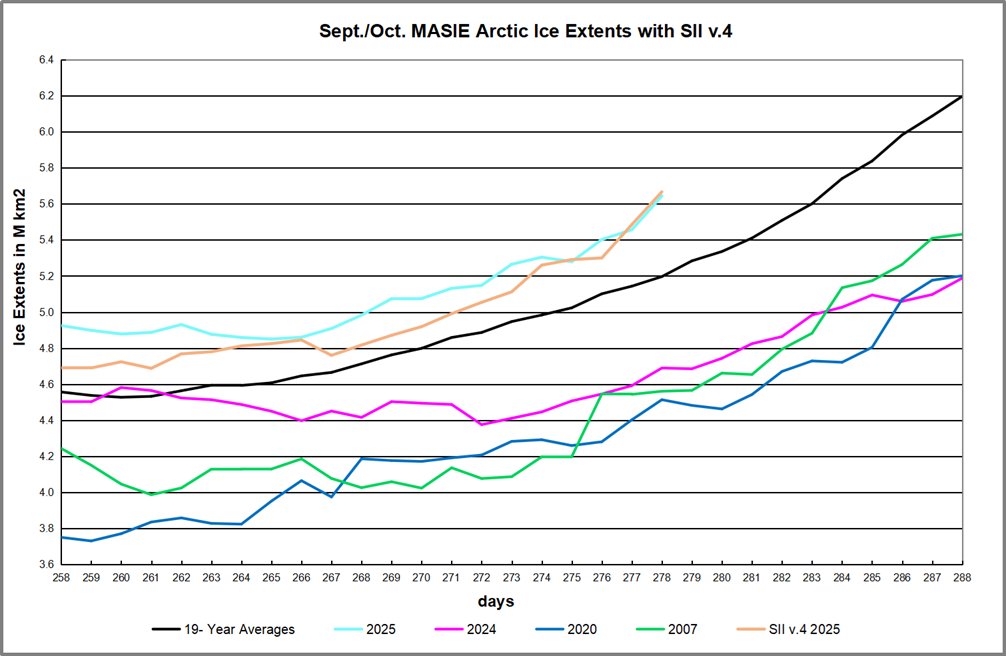
The graph above shows Sept./Oct. daily ice extents for 2025 compared to 19 year averages, and some years of note. Day 260 has been the lowest daily ice extent on average for the last 19 years. Note how in just the last five days, Arctic ice extent has grown by half a wadham or ~0.5M km2!
Why is this important? All the claims of global climate emergency depend on dangerously higher temperatures, lower sea ice, and rising sea levels. The lack of additional warming prior to 2023 El Nino, which is now receding, is documented in a post Tropics UAH Temps Cooler August 2025.

The lack of acceleration in sea levels along coastlines has been discussed also. See Observed vs. Imagined Sea Levels 2023 Update.
Also, a longer term perspective is informative:
 The table below shows the distribution of Sea Ice on day 260 across the Arctic Regions, on average, this year and 2007. At this point in the year, Bering and Okhotsk seas are open water and thus dropped from the table. The has grown to 5.64M km2 from 5.14 and the overall surplus to average is 447k km2, ( 9 %). The 2025 ice extent exceeds 2007 by a full wadham.
| Region | 2025278 | Day 278 ave. | 2025-Ave. | 2007278 | 2025-2007 |
| (0) Northern_Hemisphere | 5643927 | 5196640 | 447286 | 4560836 | 1083091 |
| (1) Beaufort_Sea | 781758 | 582635 | 199123 | 590267 | 191490 |
| (2) Chukchi_Sea | 474277 | 232765 | 241512 | 25934 | 448343 |
| (3) East_Siberian_Sea | 558888 | 329424 | 229465 | 311 | 558577 |
| (4) Laptev_Sea | 299904 | 208865 | 91039 | 305220 | -5316 |
| (5) Kara_Sea | 1026 | 45918 | -44892 | 22717 | -21691 |
| (6) Barents_Sea | 0 | 17669 | -17669 | 3580 | -3580 |
| (7) Greenland_Sea | 175128 | 271377 | -96248 | 404376 | -229248 |
| (8) Baffin_Bay_Gulf_of_St._Lawrence | 81997 | 63374 | 18623 | 72162 | 9835 |
| (9) Canadian_Archipelago | 355462 | 410626 | -55164 | 349687 | 5775 |
| (10) Hudson_Bay | 1172 | 2333 | -1161 | 1936 | -764 |
| (11) Central_Arctic | 2912747 | 3030507 | -117760 | 2783370 | 129376 |


Illustration by Eleanor Lutz shows Earth’s seasonal climate changes. If played in full screen, the four corners present views from top, bottom and sides. It is a visual representation of scientific datasets measuring ice and snow extents.


