Background from NOAA Climate.gov
Q: What’s the temperature of water at the ocean’s surface?
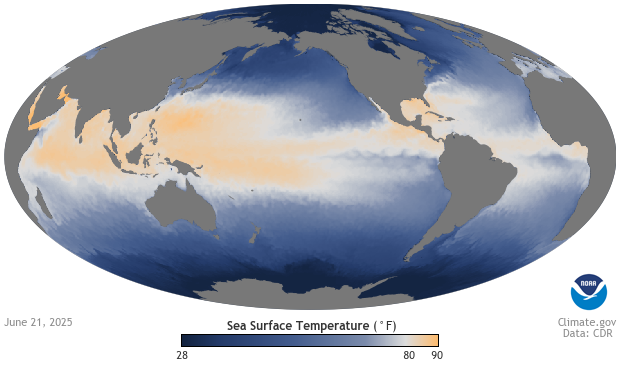
A: Colors on the map show the temperature of water right at the ocean’s surface. The darkest blue shows the coldest water: floating sea ice is usually present in these areas. Lighter shades of blue show temperatures of up to 80°F. White and orange areas show where surface temperatures are higher than 80°F, warm enough to fuel tropical cyclones or hurricanes.
Q: Where do these measurements come from?
A: Satellite instruments measure sea surface temperature—often abbreviated as SST—by checking how much energy comes off the ocean at different wavelengths. Computer programs merge sea surface temperatures from ships and buoys with the satellite data, and incorporate information from maps of sea ice. To produce the daily maps, programs invoke mathematical filters to combine and smooth data from all three sources.
Q: Why do these data matter?
A: While heat energy is stored and mixed throughout the depth of the ocean, the temperature of water right at the sea’s surface—where the ocean is in direct contact with the atmosphere—plays a significant role in weather and short-term climate. Where sea surface temperatures are high, relatively large amounts of heat energy and moisture enter the atmosphere, sometimes producing powerful, drenching storms downwind. Conversely, lower sea surface temperatures mean less evaporation. Global patterns of sea surface temperatures are an important factor for weather forecasts and climate outlooks.
Q: How did you produce these snapshots?
A: Data Snapshots are derivatives of existing data products: to meet the needs of a broad audience, we present the source data in a simplified visual style. NOAA’s Climate Data Records Program produces the Opitimum Interpolated Sea Surface Temperature files. To produce our images, we run a set of scripts that access the source files, re-project them into desired projections at various sizes, and output them with a custom color bar.
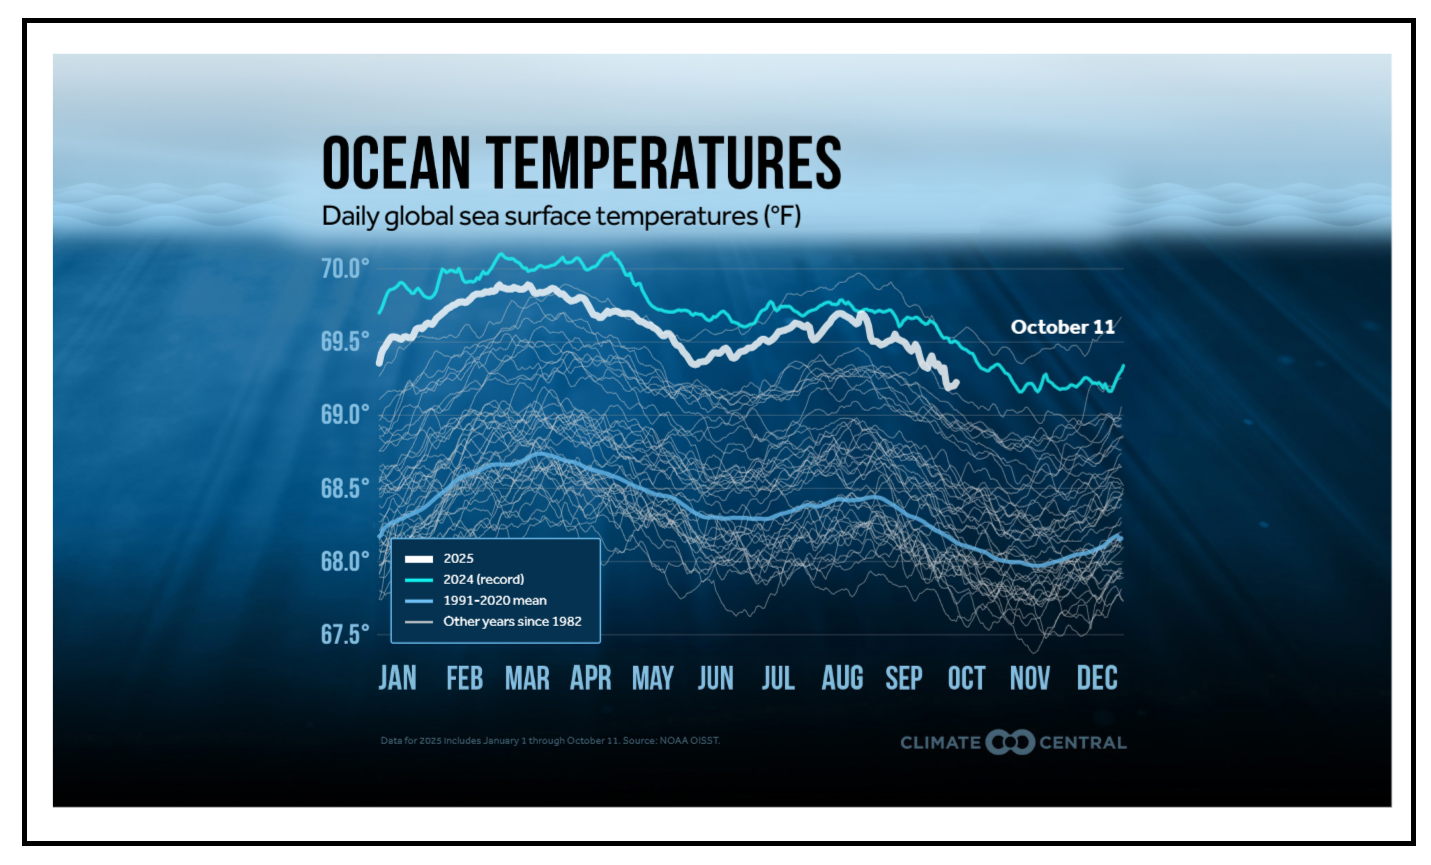
With the federal government shutdown, dataset updates are uncertain, but OISST is current and shows how presently the ocean is cooling down from it’s 2024 high temperatures.
Note: Daily SST Ocean Temperature Graphic, 1982-2025
Use the options below to generate graphics of daily sea surface temperatures since 1982 using data from NOAA’s Optimum Interpolation Sea Surface Temperature (OISST) v2.1 dataset. [The chart above defines Global as 60°N to 60°S.] These graphics will update daily, or as data becomes available on the Climate Reanalyzer website. Note the most recent two weeks of data are considered preliminary. Specific information about the data can be found here.
My Comment:
The chart shows how 2025 is tracking ~half a degree F cooler than 2024. That may not seem significant, except that the ocean covers 71% of the Earth’s surface, and any SST warming is reported in numbers of zettajoules. This is explained at the EPA website Climate Change Indicators: Ocean Heat:
The top 700 meters of the ocean contain 63% of the ocean’s heat content. The data shows that ocean layer has warmed about a zettajoule (1×10^22 joules) yearly since 1990.
For reference, an increase of 1 unit on this graph (1 × 10^22 joules) is equal to approximately 17 times the total amount of energy used by all the people on Earth in a year (based on a total global energy supply of 606 exajoules in the year 2019, which equates to 6.06 × 10^20 joules).
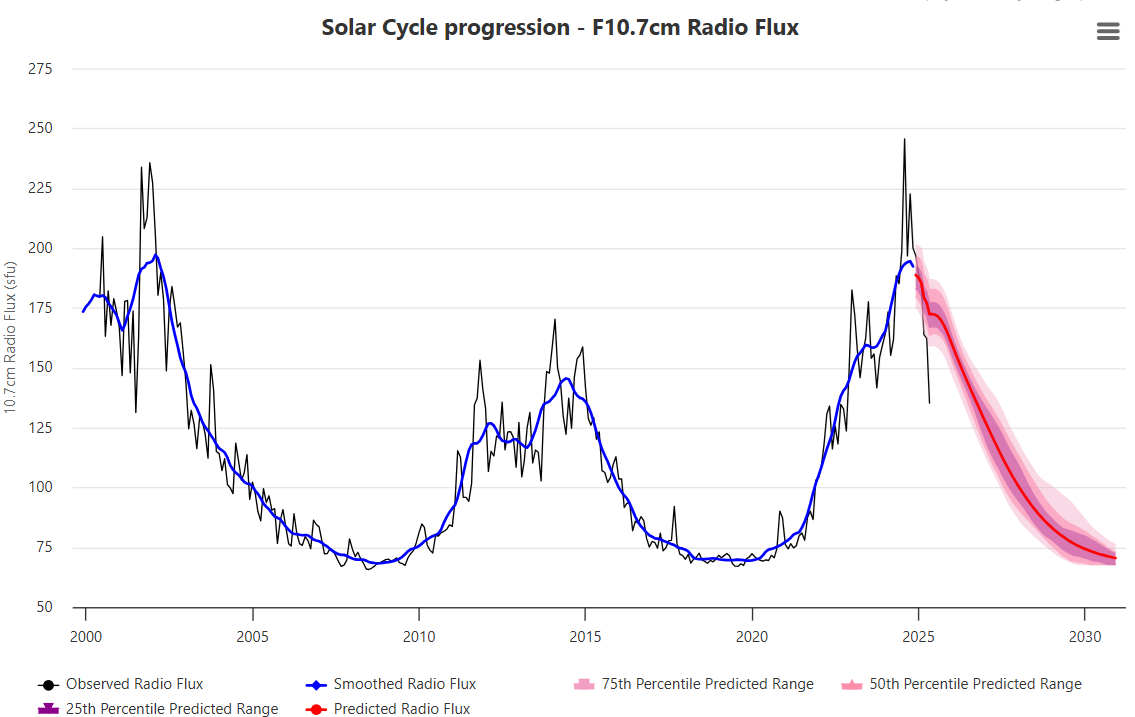
It appears that presently we may be about to lose that amount of energy through oceanic cooling. And the sun could be to blame:

Say, where is Trenberth’s missing heat?
LikeLike
beth, funny you mention that. Every resource I looked at claimed the oceans absorb 90% of the warming from CO2 emissions. No admission that any downward LW radiation can only induce evaporation. And no admission that Argo buoys show no evidence of heat moving from surface downward, except by wind-driven currents.
LikeLiked by 1 person