The animation shows the rapid growth of Arctic ice extent during October 2025, from day 274 to day 304, yesterday. For all of the fuss over the September minimum, little is said about Arctic ice growing 3M km2, that’s 3 Wadhams in one month!. Look on the left (Russian side) at the complete closing of the Northern Sea Route for shipping.
The graph below shows 2025 compared to the 19 year average (2006 to 2024 inclusive), to SII (Sea Ice Index) and some notable years.
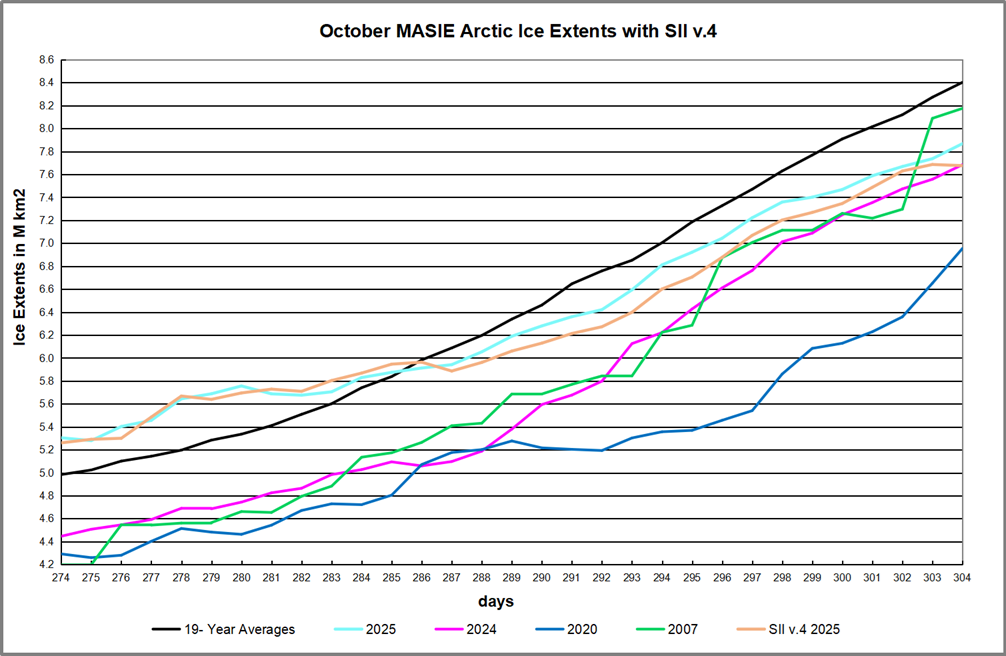
This year October added 2.6M km2 from end of September compared to an average October increase of 3.4M km2. The first two weeks were above average, before the refreezing rate slowed down ending in a deficit of ~0.5M km2. In other terms the end of October ice extents were four days behind the average, according to MASIE. SII started the same, but tracked lower in the second half of October.

The table below shows the distribution of ice in the Arctic Ocean basins.
| Region | 2025304 | Day 304 Ave. | 2025-Ave. | 2007304 | 2025-2007 |
| (0) Northern_Hemisphere | 7867621 | 8401977 | -534356 | 8175072 | -307451 |
| (1) Beaufort_Sea | 975681 | 937777 | 37904 | 1038126 | -62444 |
| (2) Chukchi_Sea | 683493 | 466318 | 217175 | 242685 | 440809 |
| (3) East_Siberian_Sea | 1087032 | 952325 | 134707 | 835071 | 251961 |
| (4) Laptev_Sea | 849204 | 848501 | 703 | 887789 | -38585 |
| (5) Kara_Sea | 137515 | 478870 | -341355 | 311960 | -174445 |
| (6) Barents_Sea | 1466 | 81088 | -79621 | 52823 | -51356 |
| (7) Greenland_Sea | 351374 | 418343 | -66969 | 443559 | -92184 |
| (8) Baffin_Bay_Gulf_of_St._Lawrence | 128777 | 247258 | -118481 | 289374 | -160596 |
| (9) Canadian_Archipelago | 568663 | 740190 | -171526 | 817220 | -248557 |
| (10) Hudson_Bay | 8609 | 66501 | -57892 | 48845 | -40236 |
| (11) Central_Arctic | 3051977 | 3153485 | -101508 | 3206345.33 | -154368 |
Overall ice extent was 534k km2 below average or 6%. Surpluses appear on the Eurasian shelf seas of Beaufort, Chukchi and East Siberian, while sizeable deficits are shown elsewhere on the Atlantic side, especially Kara, Baffin Bay, Canadian Archipelago and Central Arctic.

Illustration by Eleanor Lutz shows Earth’s seasonal climate changes. If played in full screen, the four corners present views from top, bottom and sides. It is a visual representation of scientific datasets measuring ice and snow extents.

