The arctic ice extents are now fully reported for January 2026, showing refreezing rates fluctuating, likely due to a wavy polar vortex sending cold Arctic air to sub-arctic latitudes and replacing it with warmer southern air.
From AER Polar Vortex blog:
As seen in Figure iii (and also Figure 12) the PV has an elongated shape in appearance for much of the next two weeks in contrast to the more circular PV of early January. The PV has a “split” appearance this week and into next week, a character trait or signature of a more extreme stretched PV. I think the more extreme nature of the stretched PV is consistent with the model forecasts of extreme cold in the US and even potential snowstorms. But then at least in this animation there is a clear PV split with two distinct and independent PV centers.
Figure iii. Forecasted average 10 mb geopotential heights (dam; contours) and geopotential height anomalies (m; shading) across the Northern Hemisphere for 19 Jan 2026 and forecasted from 20 Jan 2026 to 03 Feb 2026. The forecasts are from the 00Z 19 Jan 2026 GFS model ensemble.
The chart below shows the 20-year averages for Arctic ice extents in January along with 2026 and 2025, as well as SII v.4.
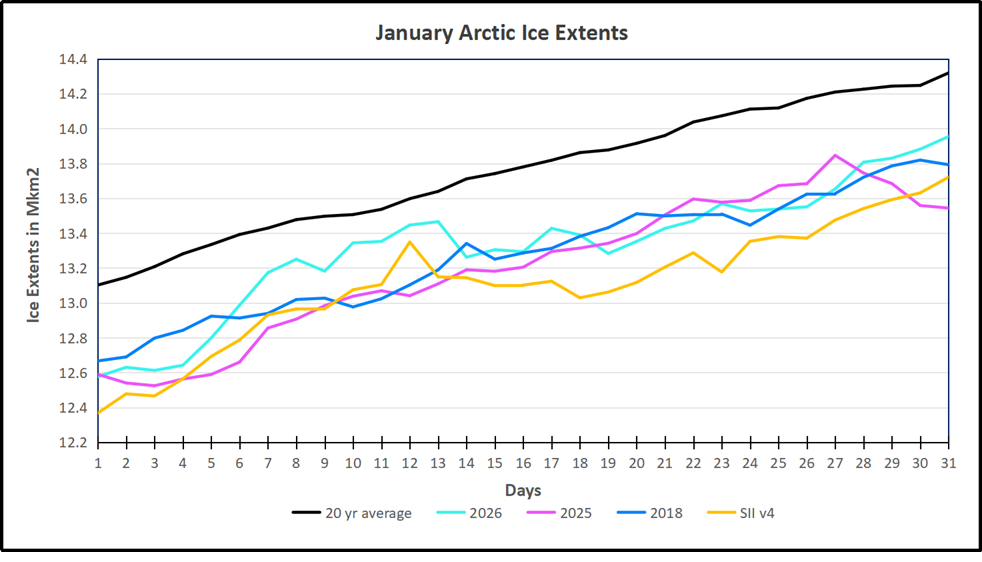
Note MASIE 2025 started 5 to 600k km2 (or half a Wadham) below the 20 year average, but by day 12 cut the deficit to 151k km2, or a gap of 1%. Freezing rate went flat for a week before recovering and ending the month nearly 14M km2, 365k id deficit or 3%. SII v.4 tracked lower than MASIE throughout January, averaging ~200k km2 lower for the month. The chart below shows the distribution of ice extent across the Arctic regions at January 31, 2026.
| Region | 2026031 | Average Day 31 | 2026-Ave. | 2025031 | 2026-2025 |
| (0) Northern_Hemisphere | 13954044 | 14319064 | -365020 | 13543739.54 | 410305 |
| (1) Beaufort_Sea | 1071070 | 1070419 | 651 | 1071000.73 | 69 |
| (2) Chukchi_Sea | 966006 | 965975 | 31 | 965989.12 | 17 |
| (3) East_Siberian_Sea | 1087137 | 1087067 | 70 | 1087137.23 | 0 |
| (4) Laptev_Sea | 897845 | 897825 | 20 | 897844.8 | 0 |
| (5) Kara_Sea | 923456 | 917599 | 5857 | 921519.96 | 1936 |
| (6) Barents_Sea | 582372 | 556751 | 25621 | 428814.24 | 153558 |
| (7) Greenland_Sea | 663996 | 613445 | 50551 | 614788.59 | 49207 |
| (8) Baffin_Bay_Gulf_of_St._Lawrence | 1027979 | 1315356 | -287378 | 1080930.32 | -52952 |
| (9) Canadian_Archipelago | 854931 | 853582 | 1349 | 854877.96 | 53 |
| (10) Hudson_Bay | 1260870 | 1260784 | 86 | 1260903.34 | -33 |
| (11) Central_Arctic | 3202511 | 3210553 | -8042 | 3211378.6 | -8867 |
| (12) Bering_Sea | 670583 | 642788 | 27795 | 534452.21 | 136131 |
| (13) Baltic_Sea | 114996 | 61637 | 53359 | 39333.65 | 75663 |
| (14) Sea_of_Okhotsk | 549996 | 809973 | -259977 | 559692 | -9696 |
The table shows that most regions are close to the 20-year average. Two major deficits are in Baffin Bay and Sea of Okhotsk, partly offset by several smaller surpluses.