2026 March Arctic Ice Recovery Slowed by Vortex
 The arctic ice extents are now reported through end of March 2026, the month whose average is taken as the annual maximum. As noted previously the wavy polar vortex has hampered ice formation with incusions of warmer southern air into the Arctic circle. This may be changing according to the most recent image from AER PV blog.
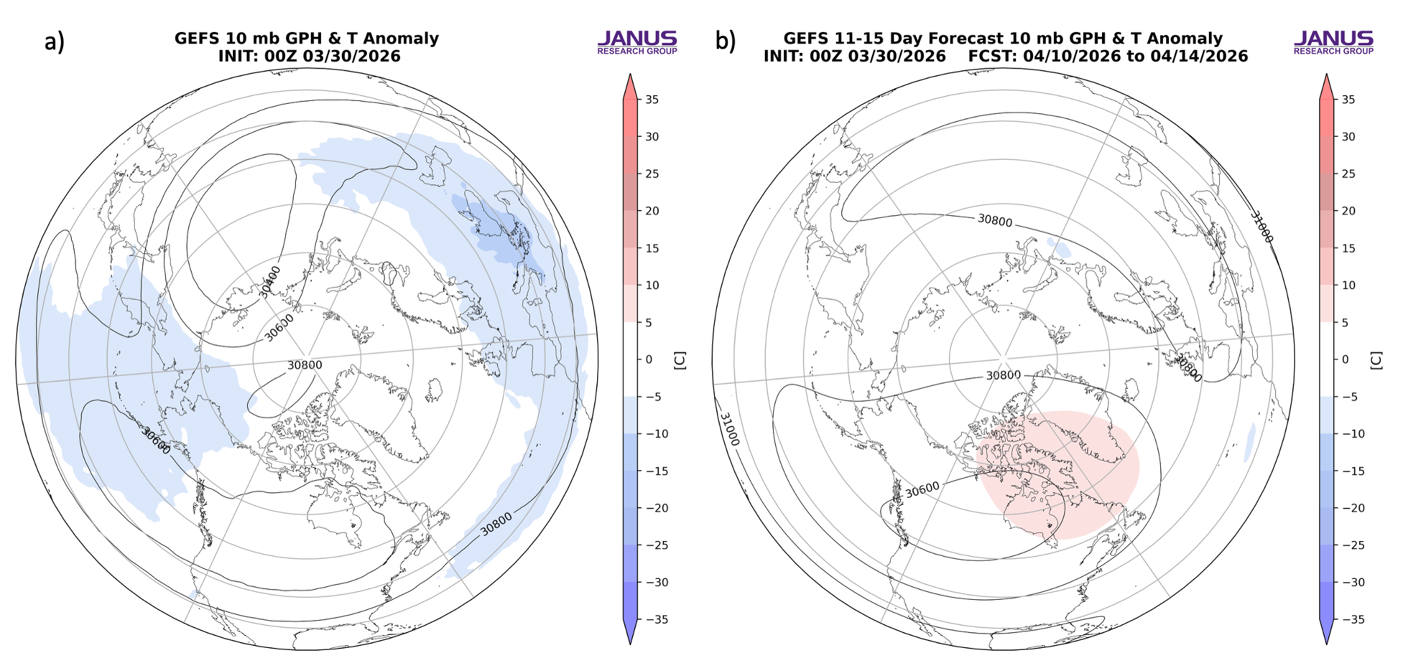
Figure 12. Observed 10 mb geopotential heights (dam; contours) and temperature anomalies (°C; shading) across the Northern Hemisphere averaged from 17 Mar. (b) Same as (a) except forecasted averaged from 28 Mar to 1 Apr 2026. The forecasts are from the 00Z 17 Mar 2026 GFS ensemble.
Remarkably, the 2025 annual daily extent maximum of 14.48M km2 was on day 73 of that year. Arctic ice reached 14.55 on day 63 in 2026, and continued near that level until day 74, before starting the usual decline.
The chart below shows the 20-year averages for Arctic ice extents for March along with 2026, 2025 and 2006 as well as SII v.4.
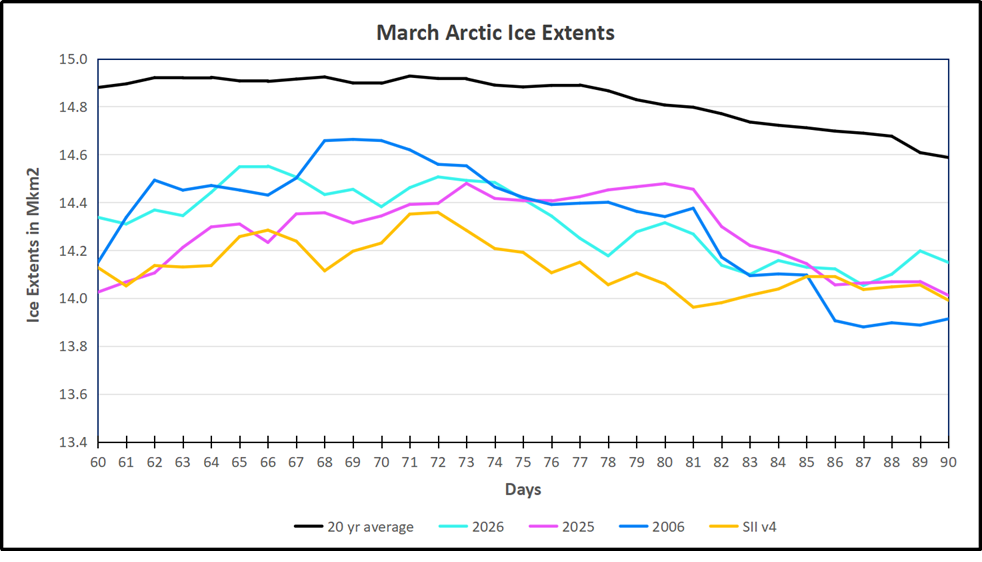
The 20-year average maximum daily ice extent appears at 14.93M km2 on day 71 before starting to decline. MASIE 2006 and 2026 started this period the same and tracked each other until 2026 ended higher by ~200k km2, and slightly above 2025.
The table below shows the distibution of ice extents on day 90 across regions of the Arctic ocean.
| Region | 2026090 | Day 90 Average | 2026-Ave. | 2006090 | 2026-2006 |
| (0) Northern_Hemisphere | 14149101 | 14587351 | -438250 | 13913402 | 235699 |
| (1) Beaufort_Sea | 1071070 | 1070279 | 791 | 1068683 | 2387 |
| (2) Chukchi_Sea | 966006 | 964325 | 1681 | 959091 | 6915 |
| (3) East_Siberian_Sea | 1087137 | 1086309 | 828 | 1084627 | 2510 |
| (4) Laptev_Sea | 897845 | 897135 | 709 | 897773 | 71 |
| (5) Kara_Sea | 930404 | 918948 | 11456 | 922164 | 8240 |
| (6) Barents_Sea | 582189 | 653649 | -71460 | 623912 | -41723 |
| (7) Greenland_Sea | 569080 | 667067 | -97988 | 604935 | -35856 |
| (8) Baffin_Bay_Gulf_of_St._Lawrence | 1403737 | 1384371 | 19366 | 1026934 | 376804 |
| (9) Canadian_Archipelago | 854931 | 853349 | 1582 | 851691 | 3240 |
| (10) Hudson_Bay | 1260887 | 1255554 | 5333 | 1240389 | 20498 |
| (11) Central_Arctic | 3223020 | 3234756 | -11736 | 3241074 | -18054 |
| (12) Bering_Sea | 819147 | 705446 | 113701 | 662863 | 156284 |
| (13) Baltic_Sea | 36855 | 60091 | -23235 | 129348 | -92492 |
| (14) Sea_of_Okhotsk | 433109 | 826350 | -393242 | 588167 | -155058 |
The table shows that most regions are close to or above the 20-year average. The majority of the 3% overall deficit is from Sea of Okhotsk, down ~400k km2, Smaller deficits are in Barents and Greenland seas, partly offset by a surplus in Bering sea. All of those regions will be nearly ice-free end of summer.


As for the March Monthly Averages, here is the history:
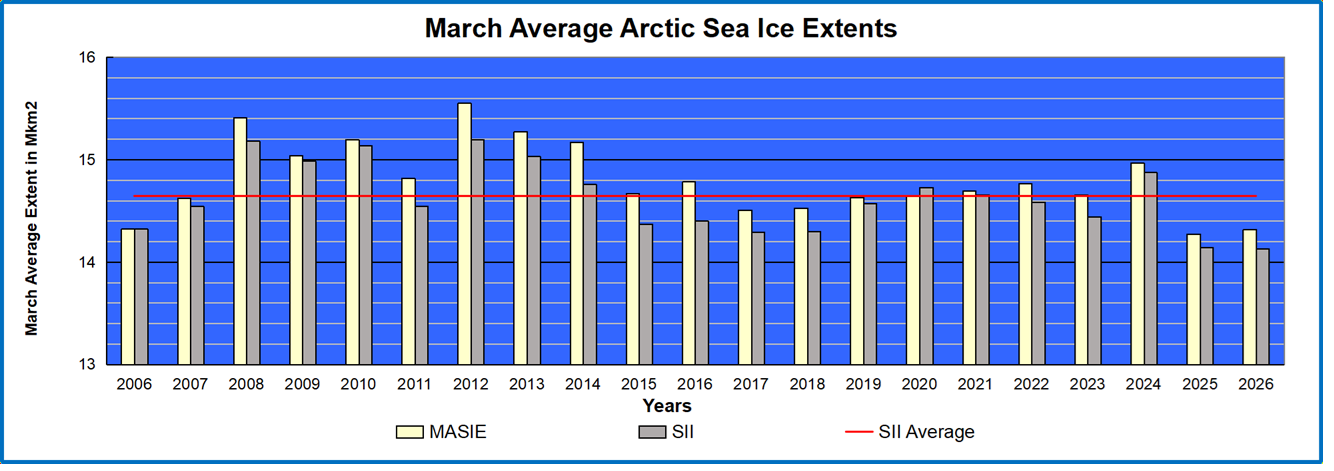
Illustration by Eleanor Lutz shows Earth’s seasonal climate changes. If played in full screen, the four corners present views from top, bottom and sides. It is a visual representation of scientific datasets measuring ice and snow extents.