Energy Revolution Not In The Cards
Kite & Key explains in above video Why the Odds Are Stacked Against Net Zero. For those preferring to read I provide a text from the captions, though the video is entertaining along with great images, some of which are included with the text in italics with my bolds.
Overview
Are we at the beginning of the end of fossil fuels? That’s the theory advanced by an international coalition of politicians who aim to get us to net zero carbon emissions by the year 2050. Just one problem: Research from the experts in their own governments suggests it’s a nearly impossible task. Enthusiasts for net zero often say we’re on the cusp of an “energy revolution.”
And that theory has a big problem: Energy revolutions don’t happen — at least not in the way that politicians often describe. While it’s true that technological and economic factors sometimes change the energy mix — countries that get wealthier become less dependent on wood, for example — the broader trend in the history of the world’s energy consumption can be defined by three words: more, more, more.
In a power-hungry world, we keep adding new energy sources. But there’s rarely any subtraction. And, with global energy demand expected to increase by about 35% by 2050, it’s nearly impossible that we can get all the power we need from carbon-free sources. For instance, meeting the net zero goals would require the construction of over 9,000 nuclear plants by 2050. The number currently being built around the world? 59.
So, what will the future of energy really look like? Our video explores.
Transcription
It doesn’t happen that often. But every once in a while, a single generation witnesses a technological breakthrough that will change the world forever.
The printing press.
The beginning of human flight.
And, for our generation, an inevitable full scale revolution in clean energy…
…that’s running a little behind schedule…
…Ok, way behind schedule.
“The beginning of the end of the fossil fuel era.” That’s how the United Nations referred to the outcome of a 2023 climate change summit held in…the United Arab Emirates. Which is sort of like having the Prohibition Conference in Vegas. Nevertheless, delegates from throughout the world left the gathering having pledged that the world would transition away from fossil fuels and get the world to net zero carbon emissions by the year 2050.
Now, the rationale for this is clear enough. Leaders from around the globe are worried that without a shift over to carbon-free energy sources like wind, solar, hydro, and nuclear the world will face significant problems as a result of climate change.
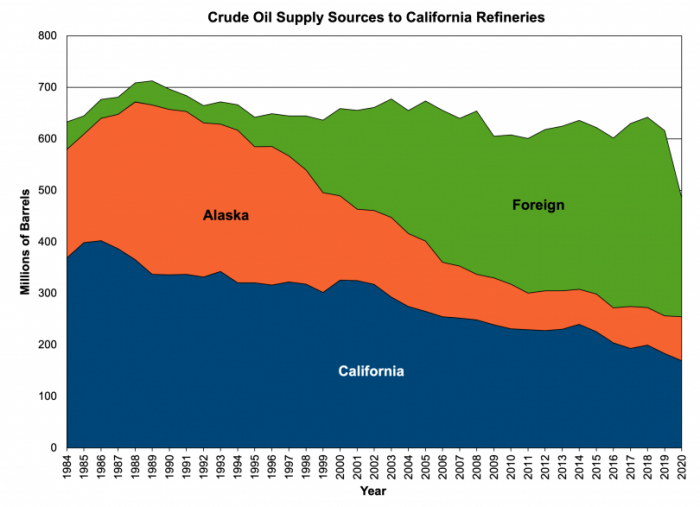
But, regardless of why they’re doing this, the more important question is whether they can do it. Because here’s the thing about energy revolutions: they don’t happen. At least not in the way that the UN is imagining. To understand why, it’s worth looking at the history of the world’s energy consumption – which looks like this.
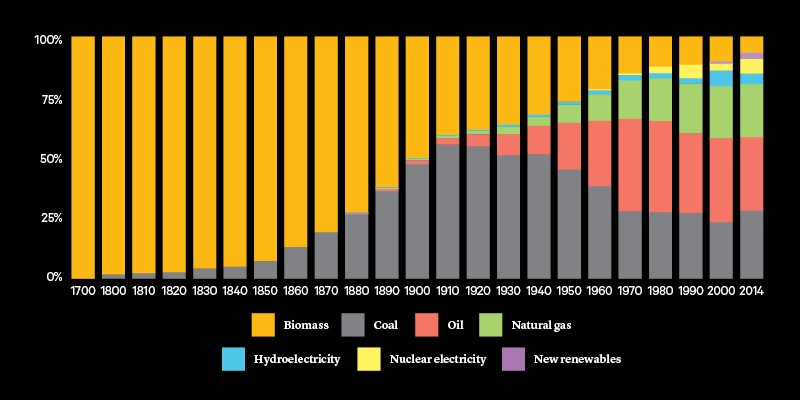
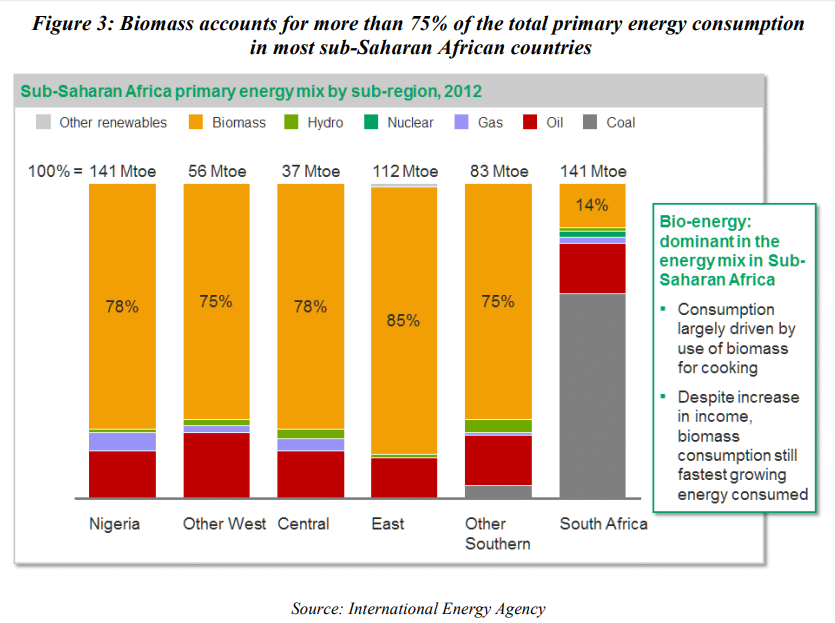
Go back a couple of centuries and the world basically ran on “traditional biomass”– -which is a fancy way of saying … wood. We burned a lot of wood and also … dung. Then in the mid 19th century, coal came into the picture in a big way. By the 20th century, we’re using tons of oil. And natural gas is a big factor too, especially as we cross into the 21st century, and fracking makes it both abundant and more affordable. As the years went by, we added low-carbon sources of energy as well, like nuclear, hydro, wind, and solar–though overall, they’re still a pretty small part of the picture.

Now, there are two important things to note about this chart. First, the history of the world’s energy consumption can be defined in three words: more, more, more. Which kind of makes sense. After all, pretty much everything that defines modern life involves a lot of energy. Between 1950 and 2022, for example, the population of the U.S. a little more than doubled. But in that same time period, our electricity use got 14 times larger.

And second, because of that “more and more, more” trend, the only things we’ve ever had that look like energy “revolutions” have been about adding new sources into the mix, not getting rid of existing ones as net zero goals propose.
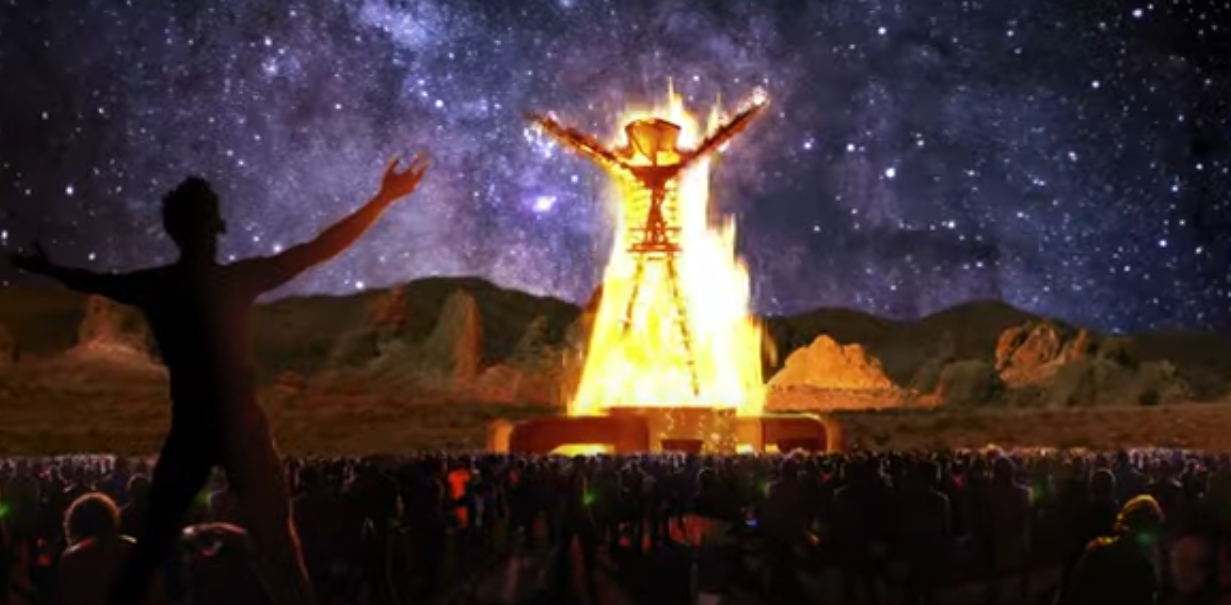
Now, to be clear, that doesn’t mean that nothing ever changes. In wealthier nations, the rise of cheaper natural gas has led to less coal usage, especially in the U.S. And poorer countries usually abandoned traditional biomass as they get wealthier, because no advanced nation powers itself by burning wood. We use it for much more sophisticated purposes…like doing psychedelics in the Nevada desert.
But using a little less coal or wood or relatively modest changes–and importantly are driven by cold, hard economic facts. By contrast, what the net zero goals entail is replacing all of this … with this … in just about 25 years. Based on little more than the fact that politicians just want it to happen.
To understand just how tall a task this is, it’s worth looking at what it would require to make it a reality. It’s estimated that meeting net zero goals would require deploying 2000 new wind turbines…
…every day … for the next 25 years. To give you some context for that, the U.S. builds about 3000 new wind turbines…
…a year.
Alternately, you could open one new nuclear plant every day for the next 25 years. For the record, that’s over 9,000 of them. And, also for the record, as of 2023, the number that were actually being built across the entire world was … 59. And here in the U.S. anyway, it generally takes over a decade to build them.
And those are some of the reasons why what politicians promise about net zero and what the experts in their own governments say…don’t exactly match up. The government’s U.S. Energy Information Administration, or EIA, projects that by the year 2050, far from seeing a revolution in energy, America will be a little less reliant on coal, a little more so on renewables…and the rest of the picture looks pretty much the same as today.
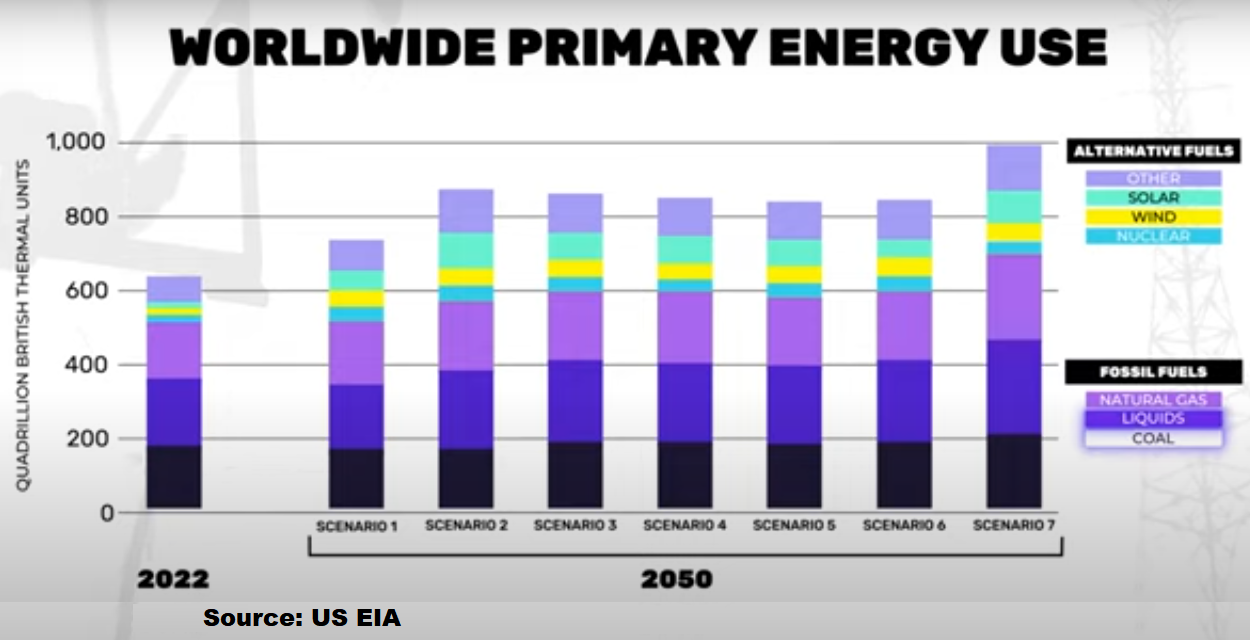
And in fact, this is true for the entire world. The EIA ran seven different scenarios for what the world’s energy consumption could look like in 2050, and while all of them showed a significant increase in renewables … they also all showed a world that continued to get most of its energy from things like coal, oil, and natural gas. Not exactly “the beginning of the end of the fossil fuel era.”
The reason for all of this: We simply can’t take enormous quantities of energy offline in a world where it’s predicted that we’re going to need almost 35% more of it by the year 2050. For one thing, there are a lot of poor countries around the world who are going to need dramatically more energy to bring themselves up to even a fraction of our standards of living.

And for another, the technologies of the future require vast amounts of power. By the year 2030, it’s estimated the computer usage around the world will take up as much as five times more of the world’s electricity production as it did even in 2020. The digital cloud we all use to store data already uses twice as much electricity as the entire nation of Japan. And with new energy-hungry technologies like AI on the way, things are only gonna move further in that direction.
Which means the real future of energy is probably: everything. Nuclear, natural gas, wind, and solar, oil, hydropower, coal. We’re going to need all of it. Probably not much wood though.
Except for these guys.
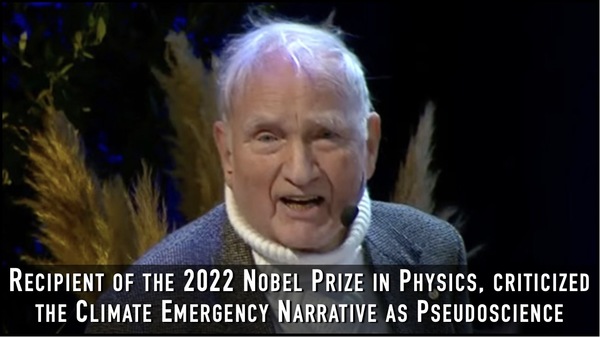
 “If there’s anything that I argue, it’s that we need to be resilient. We should stop pretending that if we changed or lowered our emissions the climate would stop changing. That’s the true denial of climate right there,” Wielicki says. “What we need to accept is that regardless of the CO2 in the atmosphere, we are going to have climate change and those shifts could occur over timescales of decades or centuries, and we should be prepared.


 Today we have a coordinated release globally of a study claiming to disprove the Covid 19 virus came from the Wuhan Institute of Viology (WIV). An example is the article from the UK so-called Independent


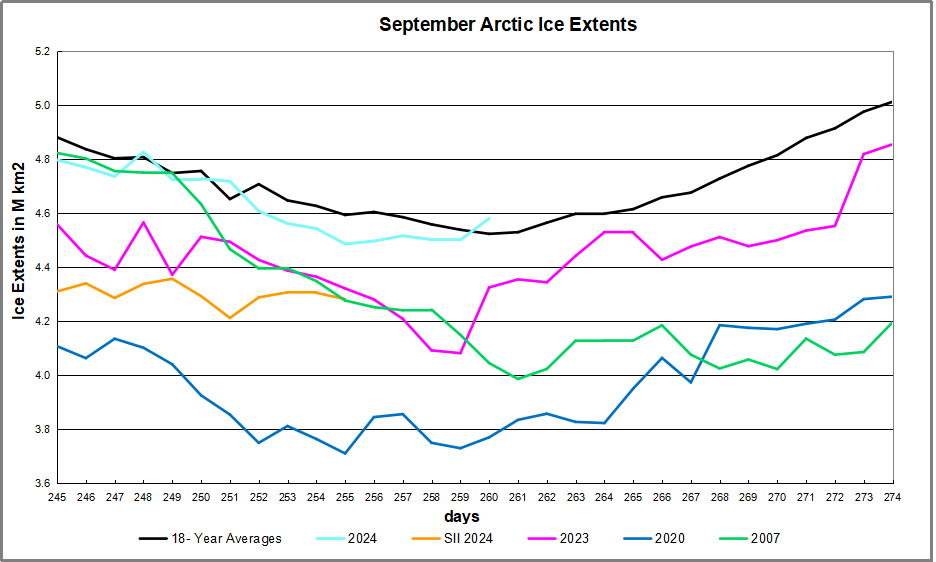


 The table below shows the distribution of Sea Ice on day 260 across the Arctic Regions, on average, this year and 2007. At this point in the year, Bering and Okhotsk seas are open water and thus dropped from the table.


 Kip Hansen gives the game away in his Climate Realism article


Two seemingly mutually excluding theories of SARS-CoV2 origin are now a matter of a heated debate.
On one hand, scientists siding with the lab-leak idea are bringing up a lot of reasonable but circumstantial evidence in favor it. There is no real way to prove the leak until an unbiased commission of researchers inspects the potential sites and lab records. That is unlikely to happen, and the problem may be never solved, unless another leak, next time a leak of critical information happens.
On the other hand, a seemingly large group of scientists supports the natural origin of the COVID19 pandemics. The key point here is that they also do not have a direct evidence of SARS-CoV2 being transmitted to humans through an intermediate host in a manner similar to what was found before for SARS and MERS viruses.
The debate becomes more and more heated, not at the least being motivated by non-scientific reasons. Major journals publish unbalanced editorials favoring ‘natural origin’ theory that so far has not produced the fatal blow to the opposite view. It is argued that it is hard to find a needle in the haystack (an animal that is an intermediate host for SARS-CoV2), but this is the real source of uncertainty.
For an unbiased critical mind, it is impossible to take sides in this debate simply because both previous lab leaks (including of SARS virus) and a natural transmission through intermediate hosts of human SARS and MERS coronaviruses have been documented. If one wants to convince that unbiased critical mind of the natural origin of human SARS-CoV2 – show us the money!
Find the intermediate host, find the virus, explain in molecular terms
how it got the furin cleavage site, or better continue working hard.
The article by Michael Worobey is an example of delivering arguments that can hardly make a dent in the leak theory for the following reasons:
Calm, however, is an unlikely outcome of this debate. My argument is that scientific thinking and integrity should come first. It is really tiring to read the numerous editorials and letters that are unilateral with no substance. I rest my case totally prepared to be convinced one way or another by solid direct evidence.