Apparently someone posted on Facebook that Arctic ice extent is presently surplus to average, which triggered the fact checking agency employed by the platform. The content below is from The Cable Fact Check No, short time data can’t determine overall decline of arctic sea ice. In italics with my bolds and comments in parentheses.
Facebook post has claimed that arctic ice is neither declining nor disappearing.
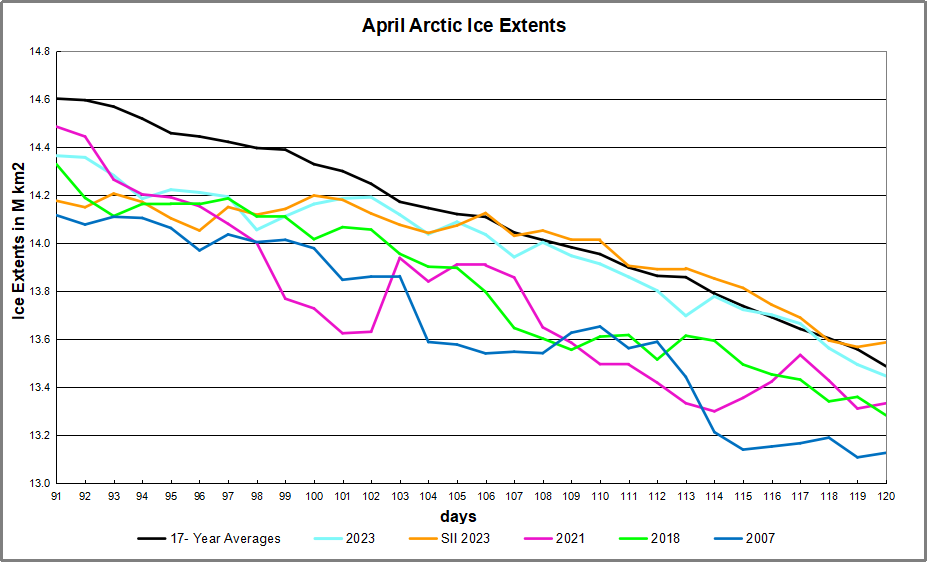
Attached to the post was an article showing a graph for arctic ice for mid-April through mid-May in 2007, 2018, 2021 and 2023.
The article was titled: “Arctic Ice Plentiful Mid May 2023”.
The graph indicated that the area of the ocean covered by a certain percentage of ice is higher in 2023 than in the other listed years and similar to the 17-year average.
“The ice is not disappearing,” says the Facebook post, which claimed that data for the month of April and May 2023 shows that the arctic sea ice is not declining. [consistent with “similar to the 17-year average”]
RECORDS SHOW THAT SEA ICE IS DECREASING
According to the National Aeronautics and Space Administration (NASA), a US agency responsible for aeronautics and space research, the volume of ice has significantly reduced. [Note the switch to the volume metric which is model estimated with considerable uncertainty]
The US agency has also reported that the average age of sea ice is becoming shorter.
Citing far back as the late 1970s, when satellite recording commenced, NASA says most of the ice covering the arctic ocean at that time was greater than 4 years old.
Presently, most of the ice covering the ocean is first-year ice, formed during winter, and very unlikely to withstand a single melt season during summer. [Really, how about this:

Also, data released by the National Snow and Ice Data Centre, explains that the size of the arctic sea has declined since the 1970s. [size of the sea itself?]
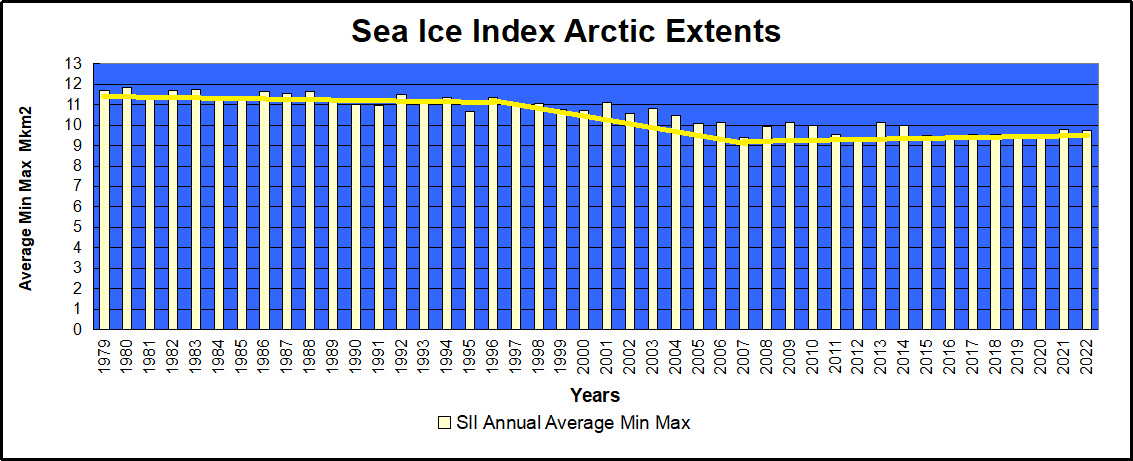
Although the 2023 sea ice extents were slightly higher for the period under review – mid-April through mid-May than in 2007, 2018 and 2021 – just like the Facebook post stated. However, the sea ice varies by year and season despite that it is experiencing an overall decline. [Varies, yes, but the decline stopped in 2007:
Sea ice extent is the area of ice that covers the arctic ocean at a given time.
Climate experts have also reported that compiling or analysing short-term data is inadequate for making accurate climatological inferences.
Olusola Ayantobo, a hydro-climatologist and research associate at China’s Tsinghua University, had told TheCable that “station data shouldn’t be used to predict climate change conditions over a particular region”.
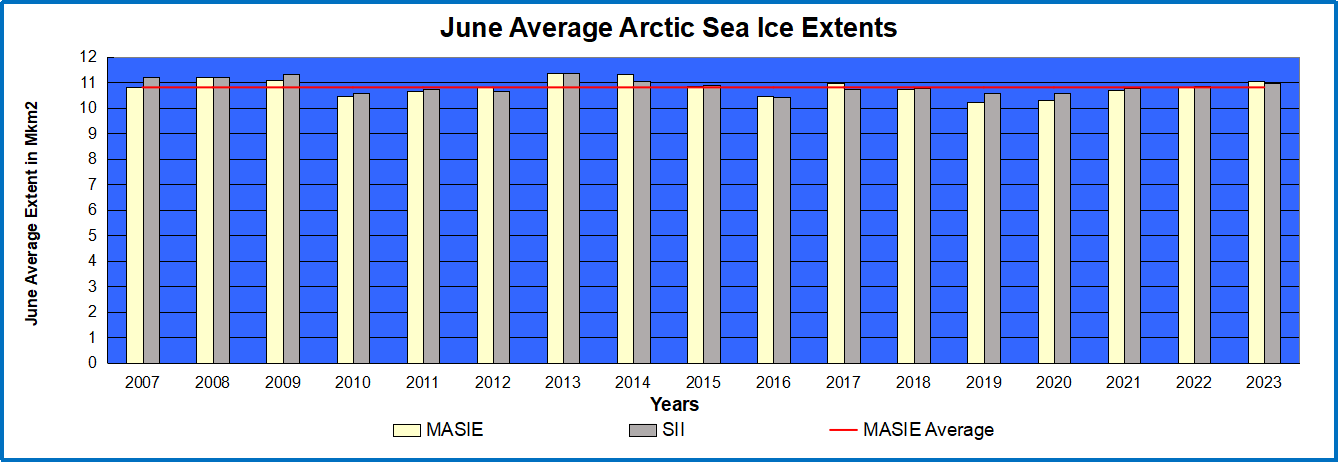
The climate expert added that: “Short-term datasets can only be used for weather prediction while a long dataset is appropriate for climate change predictions.” [Note that both their preferred Sea Ice Index (SII) and MASIE the best current condition dataset, validated from 2006 forward, show the same lack of decline in sea ice extent]
Experts say that though two decades might look quite long, however, it is short when studying long-term climate trends. [True, but the same people predicted an ice-free arctic based on the decline from 1997 to 2007.]
MELTING SEA ICE AGGRAVATES GLOBAL WARMING
The albedo effect explains why the rapid melting of sea ice aggravates climate change. The theory says that the bright surface of the ice reflects solar energy, which has a cooling effect. Also, ocean water, which is darker, absorbs more solar energy, causing more warming.
The loss of sea ice warms the arctic, hence, contributing to a phenomenon referred to as arctic amplification, a process through which the arctic warms at a faster rate than lower latitudes.
VERDICT
The claim that the sea ice is neither melting nor disappearing is false.
Long-term studies dating back to 1970 show that arctic sea ice has declined significantly. Climate experts have also warned that only long-term data analysis can provide accurate inferences when studying climate trends. [Note: Does that mean ignoring the last 17 years of ice stability?]
This fact check was produced by TheCable with support from Code for Africa’s PesaCheck, International Fact-Checking Network, and African Fact Checking Alliance network. [Code For Africa is funded by 2 investors. Omidyar Network and Bill & Melinda Gates Foundation are the most recent investors.]
[Comment: As usual, they are checking a narrative, rather than facts. And then cherry-pick other facts or statements favoring their preferred narrative.]
Regarding Arctic “Amplification”
An artifact of using anomalies, which are highly variable at higher latitudes:

The Original Post: Arctic Ice Plentiful Mid May 2023
The image above shows 2023 Arctic ice extents from Mid April (day 106) to Mid May (day 135). As usual, the LIFO pattern is observed: ice that is Last In is the First Out. The Pacific basins of Okhotsk (top left) and Bering (bottom left) rapidly turn to open water. Baffin Bay (lower right) melts more slowly. Barents Sea (top center loses ice extent steadily. Note Hudson Bay (bottom) keeps its ice, and Canadian Archipelago (lower center) retains most of its ice. On the left center, the Eurasian coastline remains frozen.
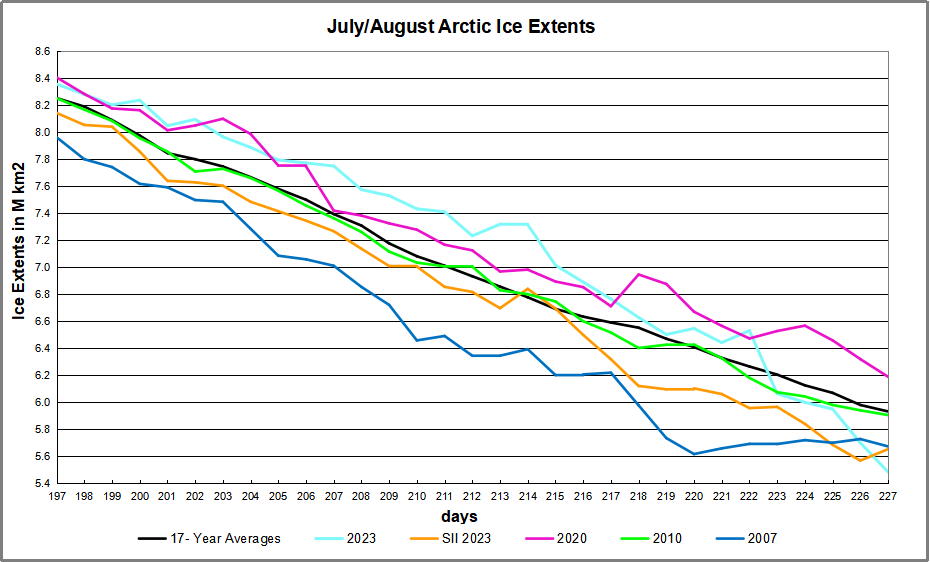
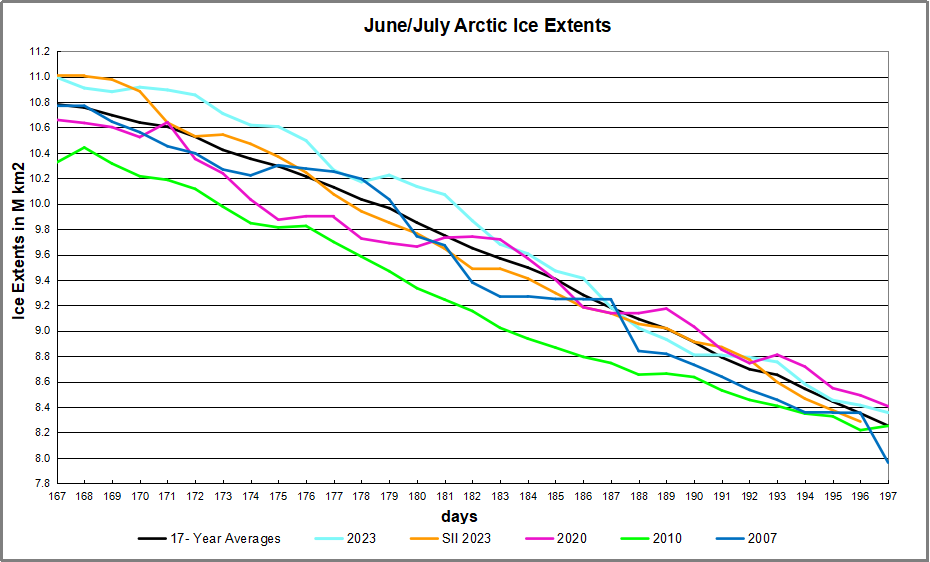
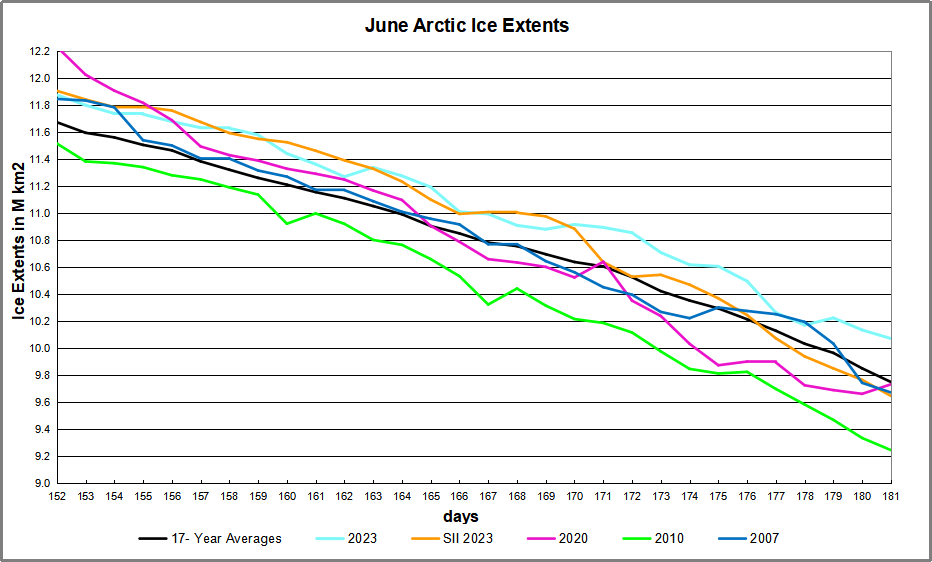
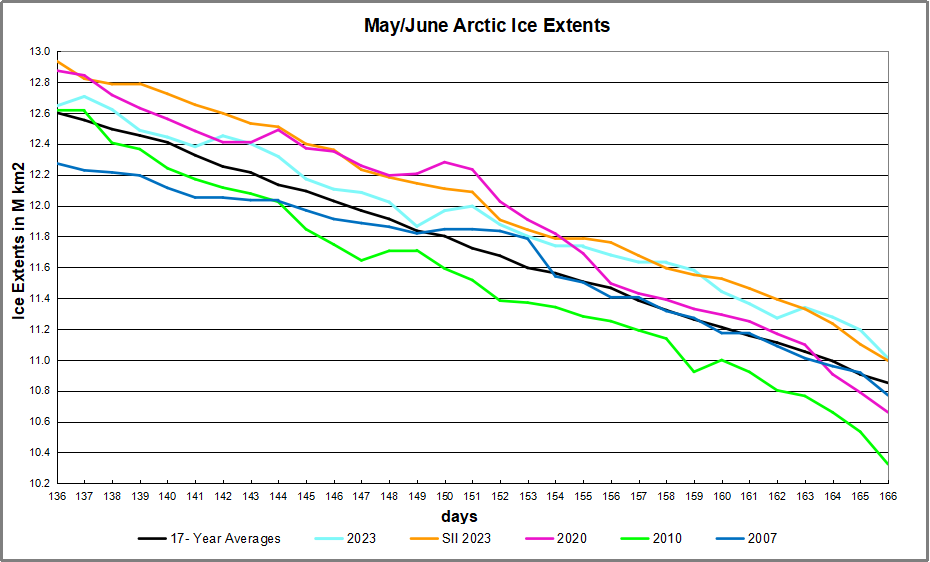
The graph below shows 2023 compared to 17 year average and some recent years for this time period.
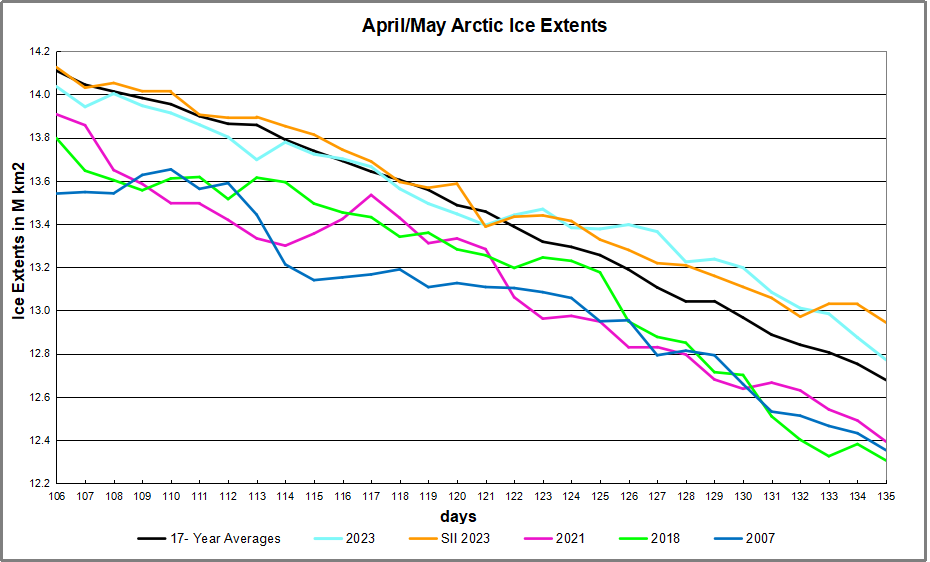
Firstly, on average this period shows ice declining 1.44 M km2 down to 12.68M km2, Note that 2023 matched the average in April, then retained more ice than usual during first two weeks of May. Sea Ice Index (SII) was close to MASIE throughout.. The other years, including 2007, were ~300k km2 lower than average.
| Region |
2023135 |
Day 135 Average |
2023-Ave. |
2007135 |
2023-2007 |
| (0) Northern_Hemisphere |
12771477 |
12677903 |
93574 |
12431928 |
339549 |
| (1) Beaufort_Sea |
1050531 |
1046418 |
4113 |
1057649 |
-7118 |
| (2) Chukchi_Sea |
943942 |
926464 |
17478 |
953491 |
-9549 |
| (3) East_Siberian_Sea |
1085822 |
1081321 |
4501 |
1075314 |
10508 |
| (4) Laptev_Sea |
897060 |
881069 |
15991 |
828738 |
68322 |
| (5) Kara_Sea |
919027 |
879799 |
39228 |
876053 |
42974 |
| (6) Barents_Sea |
407569 |
418431 |
-10862 |
351553 |
56016 |
| (7) Greenland_Sea |
730714 |
619664 |
111050 |
564865 |
165849 |
| (8) Baffin_Bay_Gulf_of_St._Lawrence |
979333 |
1076523 |
-97190 |
1018780 |
-39447 |
| (9) Canadian_Archipelago |
841610 |
839708 |
1902 |
830604 |
11006 |
| (10) Hudson_Bay |
1153016 |
1186552 |
-33536 |
1167310 |
-14294 |
| (11) Central_Arctic |
3247995 |
3223255 |
24740 |
3234305 |
13690 |
| (12) Bering_Sea |
296036 |
301878 |
-5842 |
298268 |
-2231 |
| (13) Baltic_Sea |
6134 |
7668 |
-1534 |
6368 |
-234 |
| (14) Sea_of_Okhotsk |
211027 |
186778 |
24249 |
164833 |
46194 |
The table shows the distribution of ice in the Arctic basins. The main deficits to average are Baffin and Hudson Bays, more than offset by surpluses in Kara and Greenland Seas. Most other regions are surplus with a few slightly negative.

Resources: Climate Compilation II Arctic Sea Ice