Insider Exposes Corrupt Climatism (Anika Sweetland)
At the World Prosperity Forum in Zurich—held alongside the World Economic Forum in Davos—climate scientist Anika Sweetland delivers a provocative and deeply personal address that challenges the foundations of modern climate orthodoxy.
Drawing on her own education and professional experience, Sweetland recounts how climate science training fostered fear, despair, and unquestioned consensus rather than open scientific inquiry. She argues that generations of students have been indoctrinated with alarmist narratives that distort climate history, suppress debate, and justify sweeping political and economic control.
In this speech, Sweetland examines:
♦ The psychological impact of climate alarmism on children and students
♦ Media-driven climate narratives and shifting doomsday predictions
♦ Historical climate cycles, ocean dynamics, and orbital forces
♦ The role of international institutions and the concentration of power
♦ Why carbon dioxide is portrayed as a villain—and why she disputes that claim
♦ How climate policy, finance, and governance have become tightly intertwined
Presented as a counterpoint to the centralized, collectivist worldview promoted at Davos, this talk embodies the mission of the World Prosperity Forum: to challenge prevailing narratives, defend sovereignty, and restore open debate on climate, energy, and economic policy. For those who prefer reading, below is a transcription with my bolds and added images.
My name is Annika Sweetland and I trained as a climate scientist and during my time in what was meant to be a world-class education, I learned the world was a fragile system on the brink of collapse and that we were practically doomed. What sets me apart from most climate scientists is this, I’ve realized I was indoctrinated. Going through my old lecture notes now, I see lie after lie after lie, painting a picture that does not and will not ever exist. I was that girl that ticked the box when booking a plane ticket to say yes, I’m willing to pay a higher price to make this an environmentally friendly transaction and offset my carbon emissions.
Airlines saving polar bears, sign me up. But of course the
consensus was always the same, there was nothing
I could really do to solve the climate crisis.
So let me take you through my journey from being a scientist in complete and utter despair to standing here before you today armed with the truth. Today I’m going to be telling you about the realities of climate education, so let’s start at the beginning of the climate merry-go-round, the indoctrination of school children. Do you realize the alleged consequences from climate change are actually similar to those of war? The child’s world is inherently unstable, after all due to extreme sea level rise and extreme weather events, their lives are at risk. But this is what we’re teaching our kids, that the world they live in is no longer a safe and stable environment, that ecosystems are collapsing and their world is on fire. This is an outrage, they promised this is the truth and if they question that narrative the school will write to their parents, no debate allowed. I have been told my whole life that there is impending doom in the form of climate change. It was in the news every day, my teachers schooled me on it, my friends were talking about it, there were even degrees in it.

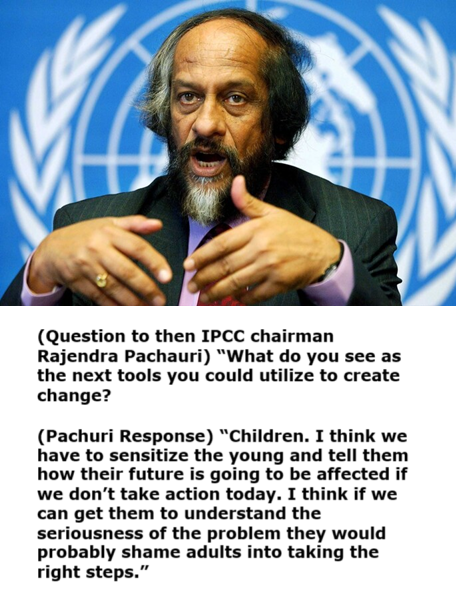
I can be forgiven for believing it. Why wouldn’t you believe what your teachers are telling you? They’re the ultimate authority at a young age. But the most significant point is this, it is the effect it has on our children.
They are scaring our children with these ghastly stories, they are shaping them to feel powerless because they can’t do anything about it and they are moulding them to be disillusioned and angry because the so-called people in charge don’t appear to be doing anything about it either. This is how you get the Greta Thunbergs of the world, that girl honestly believes her world is burning. Imagine for a second what it truly feels like to believe that.
I was at school in 1999 and this new emergency of global warming made me feel anxious and at that time three percent of school-aged children were diagnosed with anxiety. By 2023 this had escalated to more than 20 percent of school-aged children being diagnosed with anxiety. This is not a coincidence, the psychological impact of this story is crippling children’s mental health and it is simply unacceptable.
It is wrong, it is socially irresponsible and the minute they try and peddle that story on my child, well let me just make this clear, hell will have no fury like a mother who knows the truth and who is also a climate expert. Hell will not have enough fury and this is why I’m angry because I’ve seen the system from within and what I found at university wasn’t a debate, it was a script. So when I call climate change a narrative, I’m not being edgy, I’m being precise.

If you want a quick test for whether something is solid science or nonsense, just look for consistency and this consistency is exactly what’s missing. Firstly, the story keeps on changing. If it were a real story I guess the general facts surrounding it would probably remain the same but in the 60s and 70s the majority of scientists were predicting global warming but if you looked in the newspaper you’d think we’re heading straight into an ice age.
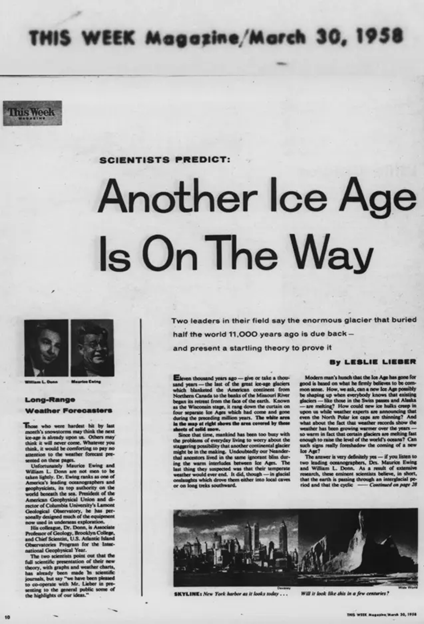
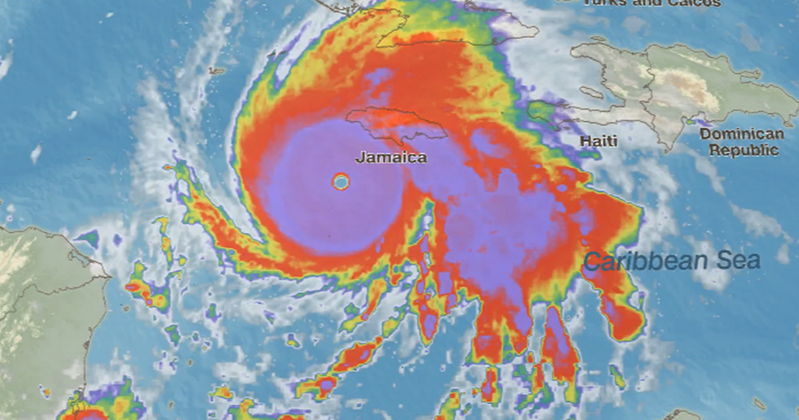
In 1974, Radio Times ran the headline, the ice age cometh. American media followed suit. Every cold weather event was sold as proof that there was an ice age approaching. Sound familiar? It should. It’s how the media still works today. A flood, a heat wave, a storm, completely normal weather, splash it across the front page, call it unprecedented and blame climate change. Everyday weather is rebranded as existential crisis. My point is this, it was never scientists telling the world an ice age was coming, it was the media with their use of selected experts. But why? Let’s dig deeper.

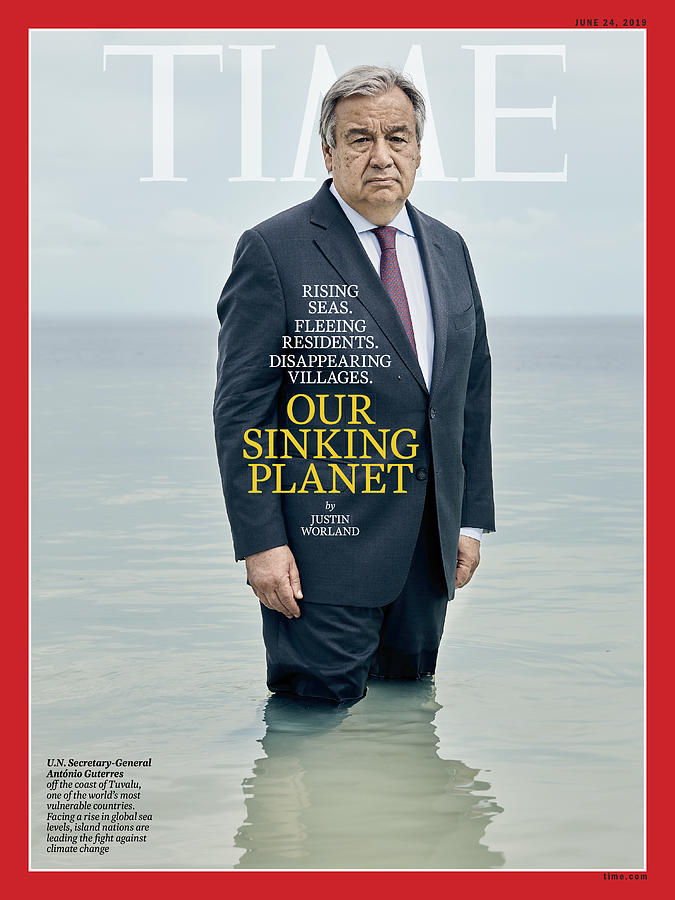
Newsweek warned governments were unprepared for climate driven food shortages and that planners were ignoring climatic uncertainty and that delay would make the coming crisis impossible to manage. This wasn’t just weather reporting, it was a script to create panic about hunger, global instability, they pull the lever for sympathy, for suffering in poorer countries and even today we see images of flooded villages, failed crops, desperate families, all offered up as proof of climate catastrophe and as justification for sweeping political action, urgent action with no time to consider the consequences.

In 1988, there was a rebranding exercise. The New York Times headline read, global warming has begun, expert tells Senate. I read this article, the evidence rests on five months of slightly warm weather and in climate sciences, a trend takes 30 years to establish, not just a season and worse still was the baseline they chose, 1950 to 1980. This is the very cooling period they had just used to scream ice age.
This is a classic case of data manipulation, you take a cold reference point and everything after that is going to look unusually warm. This was never ever science, there was never ever a global warming trend, it was data manipulated to tell a story. The ice age never came, first wrong prediction, but the story of the ice age, that did its job.
The media succeeded in creating a generation of fearful believers. In a speech to the Royal Society in 1988, Margaret Thatcher talked about the fear that people were feeling, the fear that humans were creating a global heat trap that could lead to climatic instability. This fear was gaslit by an NGO, the National Academy of Sciences, who promised the warming would cause a sea level rise of several feet over the next century.
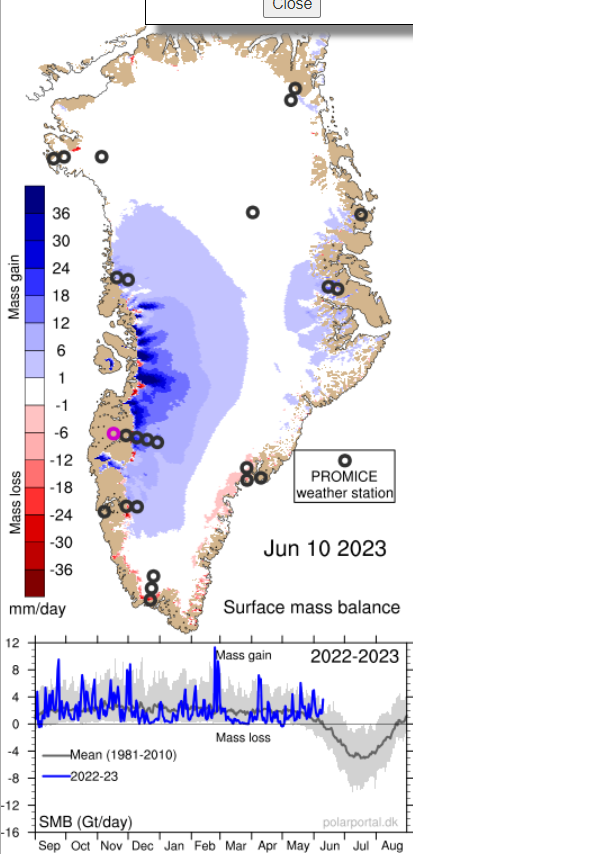
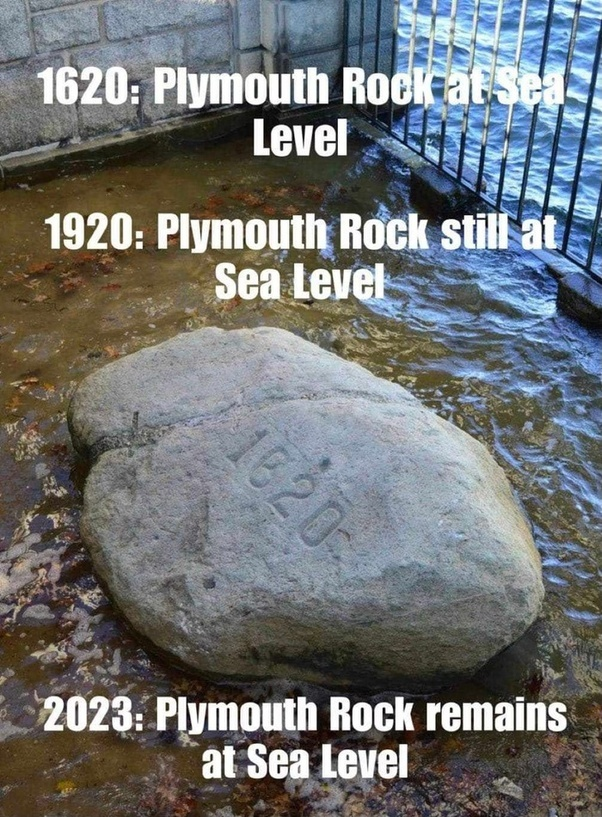
The following year, another NGO, the UN, went on the record and promised entire nations will be wiped off the face of the earth due to climate change induced sea level rise by 2020. Well, we’re still here aren’t we? Second false prediction, none of this sea level rise has eventuated and it’s exactly the same story they preach today. Extreme sea level rise and climate change refugees are nothing but a myth designed to scare people into whatever policy response is waiting in the wings.
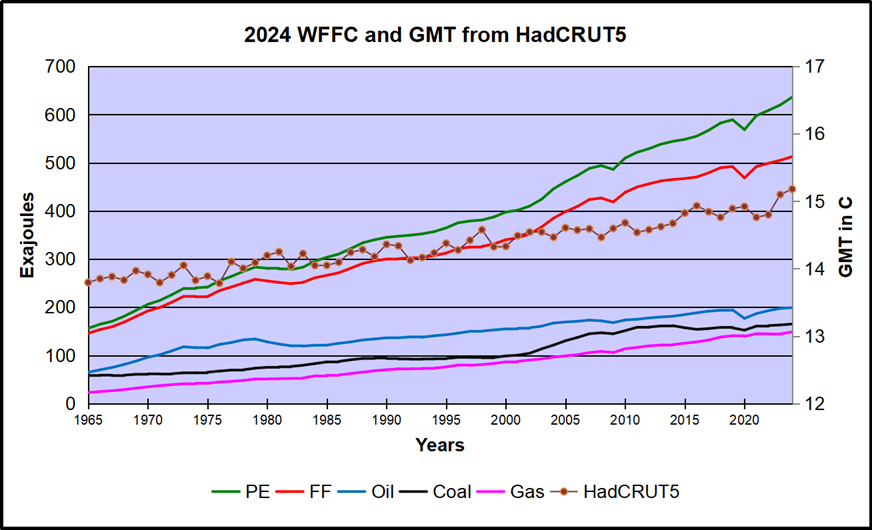
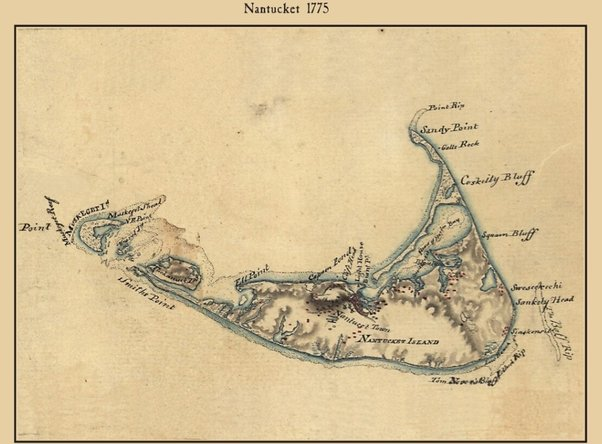
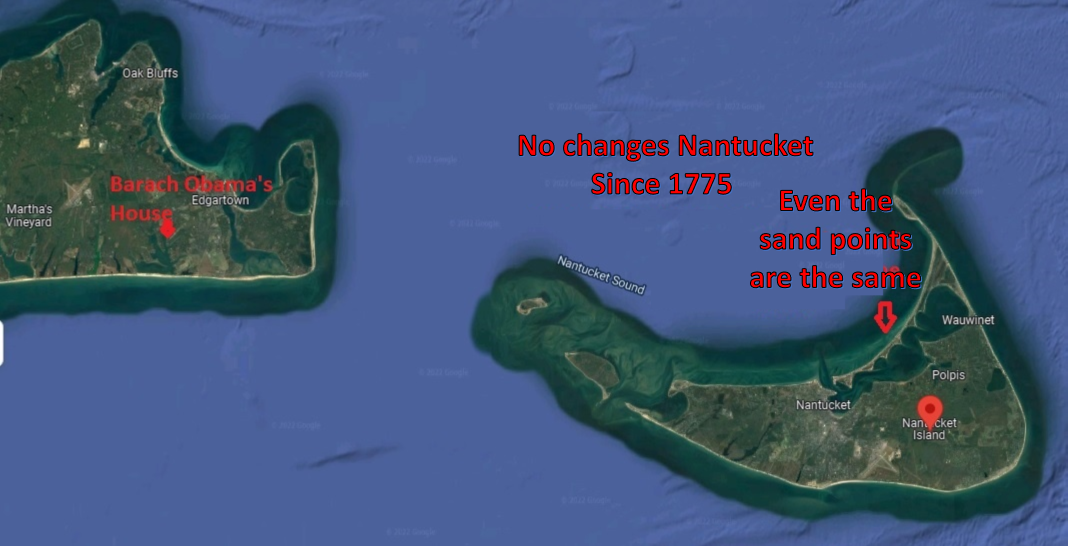
This is the first reason that the man-made climate change story is nothing more than a doomsday tale that has been evolving for the last 60 years. Think about it. These were arguably two of the world’s most powerful organisations. They’d had access to satellite data for 25 years, the best scientists, the most comprehensive data analysis in the world, plus the mainstream media at their fingertips. Was it really a coincidence that their story never came true? We now know that they would have known via satellites that the sea level was always rising steadily at 1.2 inches per decade, just like it does today. Plus, this sea rise actually brings sediment with it and increases the land mass at the same time, therefore rendering it impossible for islands to sink due to sea level rise.
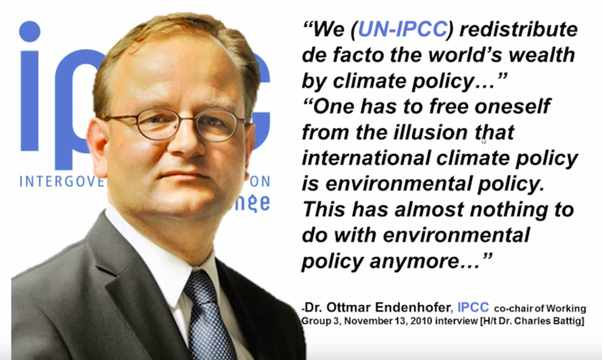
However, because it was never a real story, they were never interested in the real data. They could clearly see that there was no unusual sea level rise, but they intentionally chose to mislead the public and put their fraudulent plan into action. They advised the World Meteorological Organisation, another NGO, to create the Intergovernmental Panel on Climate Change.
Now, here’s where it gets juicy. The IPCC is structurally identical to the single world government model I was presented with during my studies as a prescriptive solution to climate change. My professors in global governance assured me that a global problem requires a single world government to fix it, and I admit it. I believed them. I respected my professors. Most of them were published authors in respected journals, and I was promised a world-class education.
But the tragedy is this. They were never training scientists.
They were training socialists to enact their agenda.
And it’s been clear to me for a time now that there’s never been a problem with our climate system, just a smoke screen to establish power and create control. Welcome to the only crisis where their solution is always the same. More control, more taxes, and less debate.

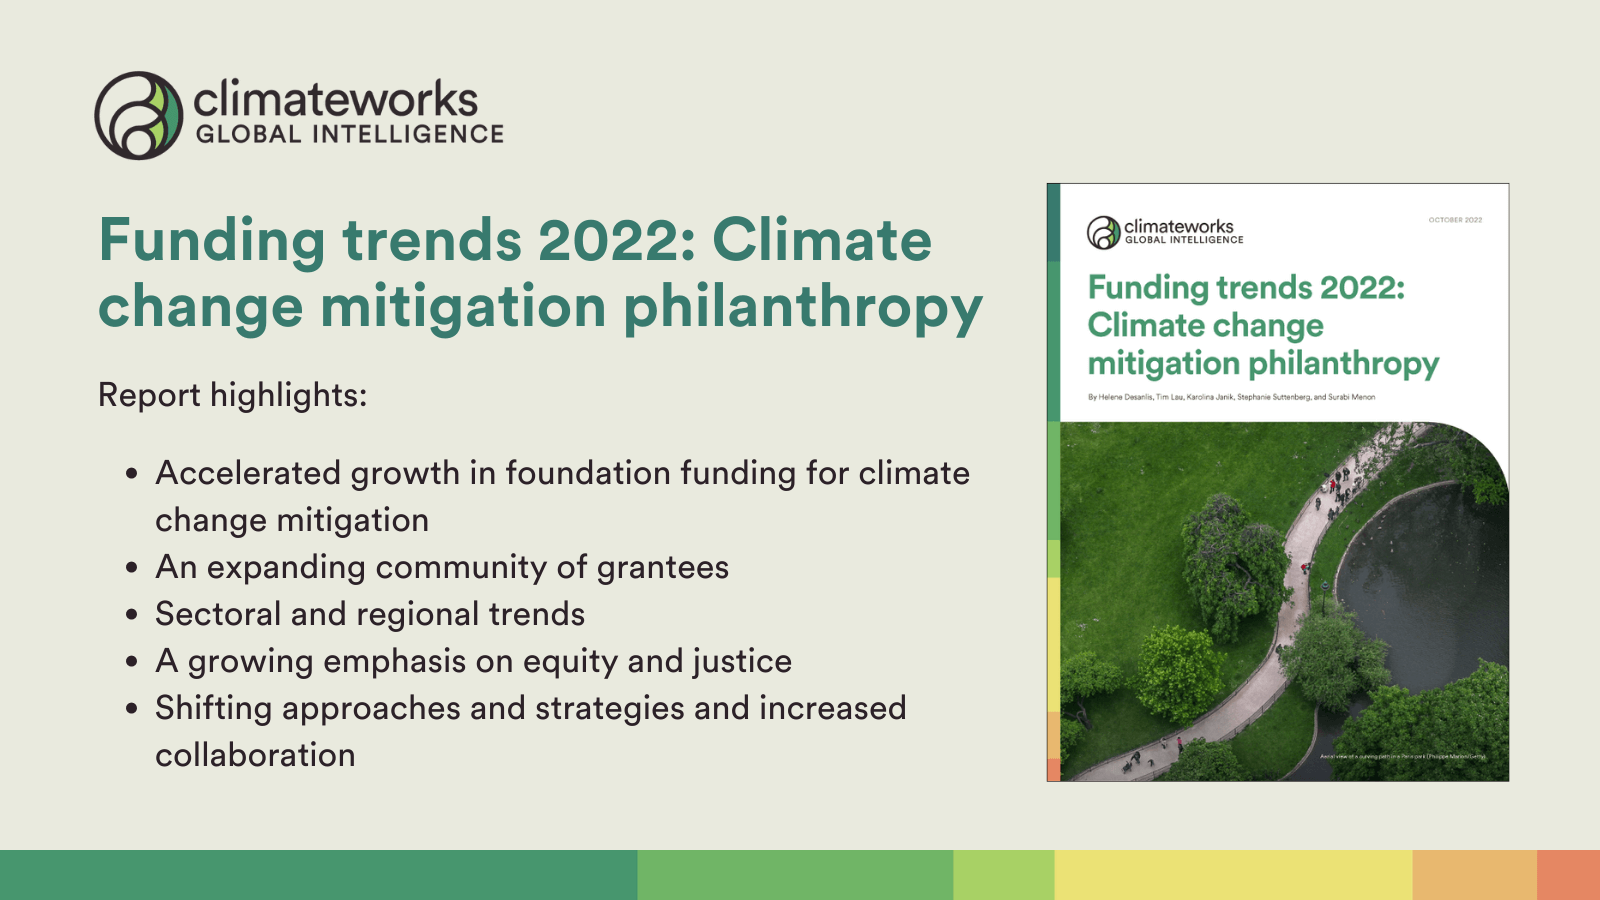
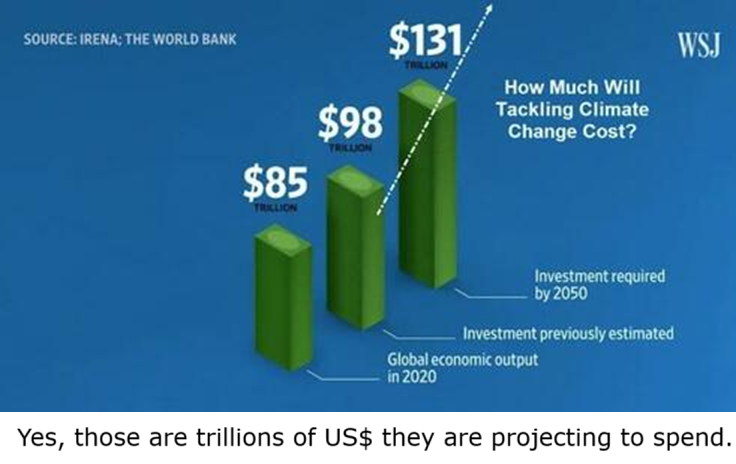
Let me make it clear how the IPCC benefits from maintaining and creating generations of climate change believers. To start with, they sit at the very top of the climate change establishment, and when I say establishment, I simply mean a stable network of institutions that fund, credential, and publish the urgency of man-made global warming. Climate finance reached a record-breaking $1.9 trillion in 2023, and last year saw a record $2.2 trillion in clean energy investment.
That’s more than $4 trillion in a couple of years. Think about who are the main winners here. They’re the unelected officials that sit atop the IPCC hierarchy. These are the people selling, building, financing, and certifying the global transition to clean energy. They are making billions.
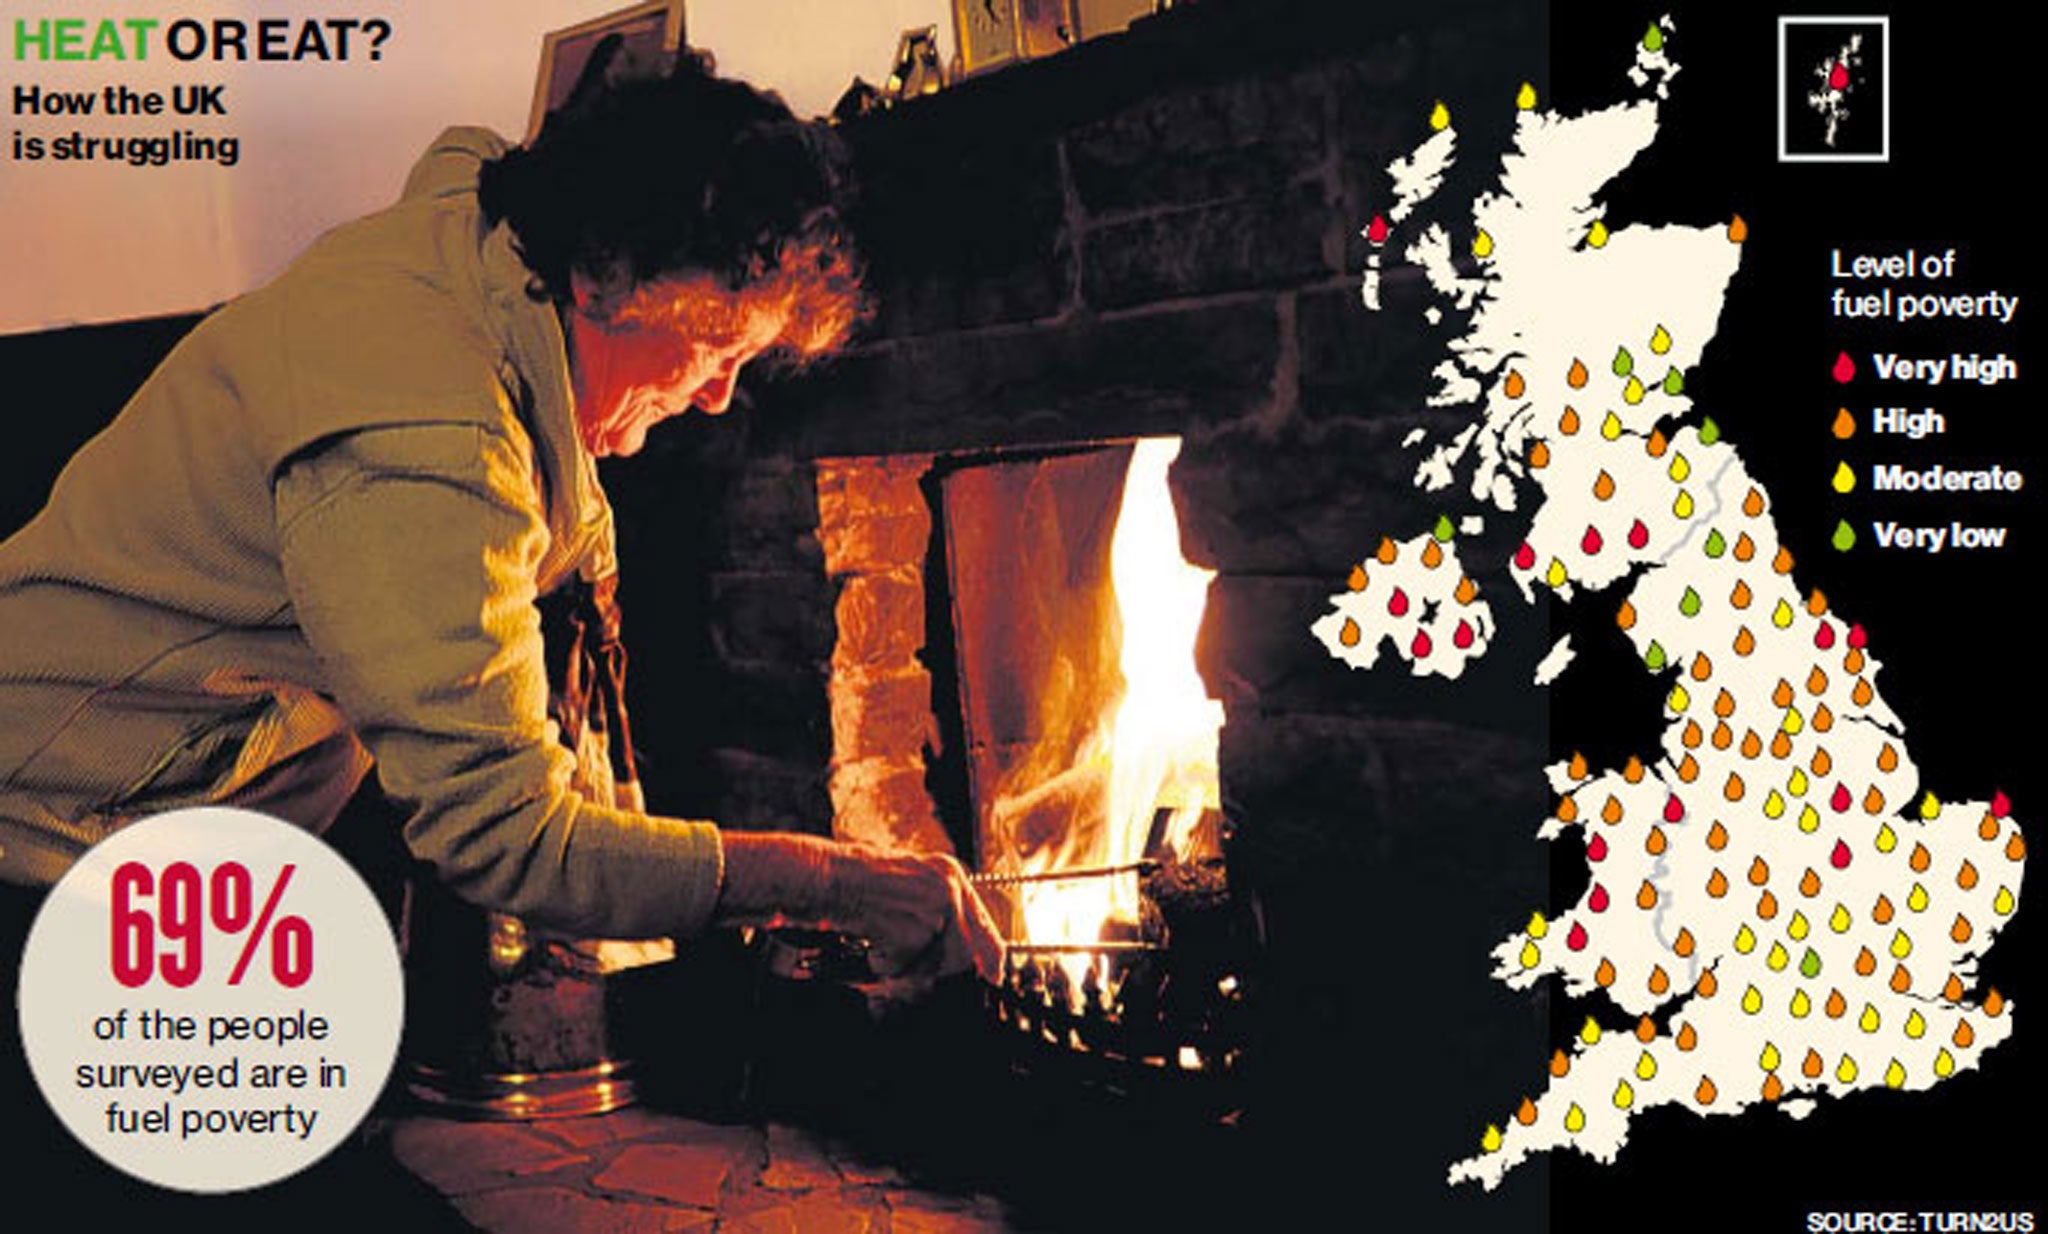
The financial victims, the United Kingdom is a victim.
Our economy is on the verge of recession after 30 years of big signatory to international climate agreements. What do we have to show for it? Not only are our energy bills the highest in the developed world, but the economy outside of London is closer to that of Bulgaria’s than Germany’s. Today, 18 to 30-year-olds are the first generation to earn less than their parents. We are getting poorer, both relatively and absolutely. My fellow countrymen are suffering, and this also makes me angry. Because of climate policy, because the IPCC says so, we’re not allowed to drill our own gas fields, which will make us completely reliant for others’ gas in the future.
We have the best quality gas in the world, and its exploration has just been made illegal. For existing projects, for every dollar made, the company is taxed upwards of 78 cents due to unnecessary climate taxation. Let’s take a really good look at just how much power the IPCC have created for themselves. They act as a global risk allocation engine. They determine which technologies reduce subsidies, which activities become legally constrained, which investments are encouraged or stranded.
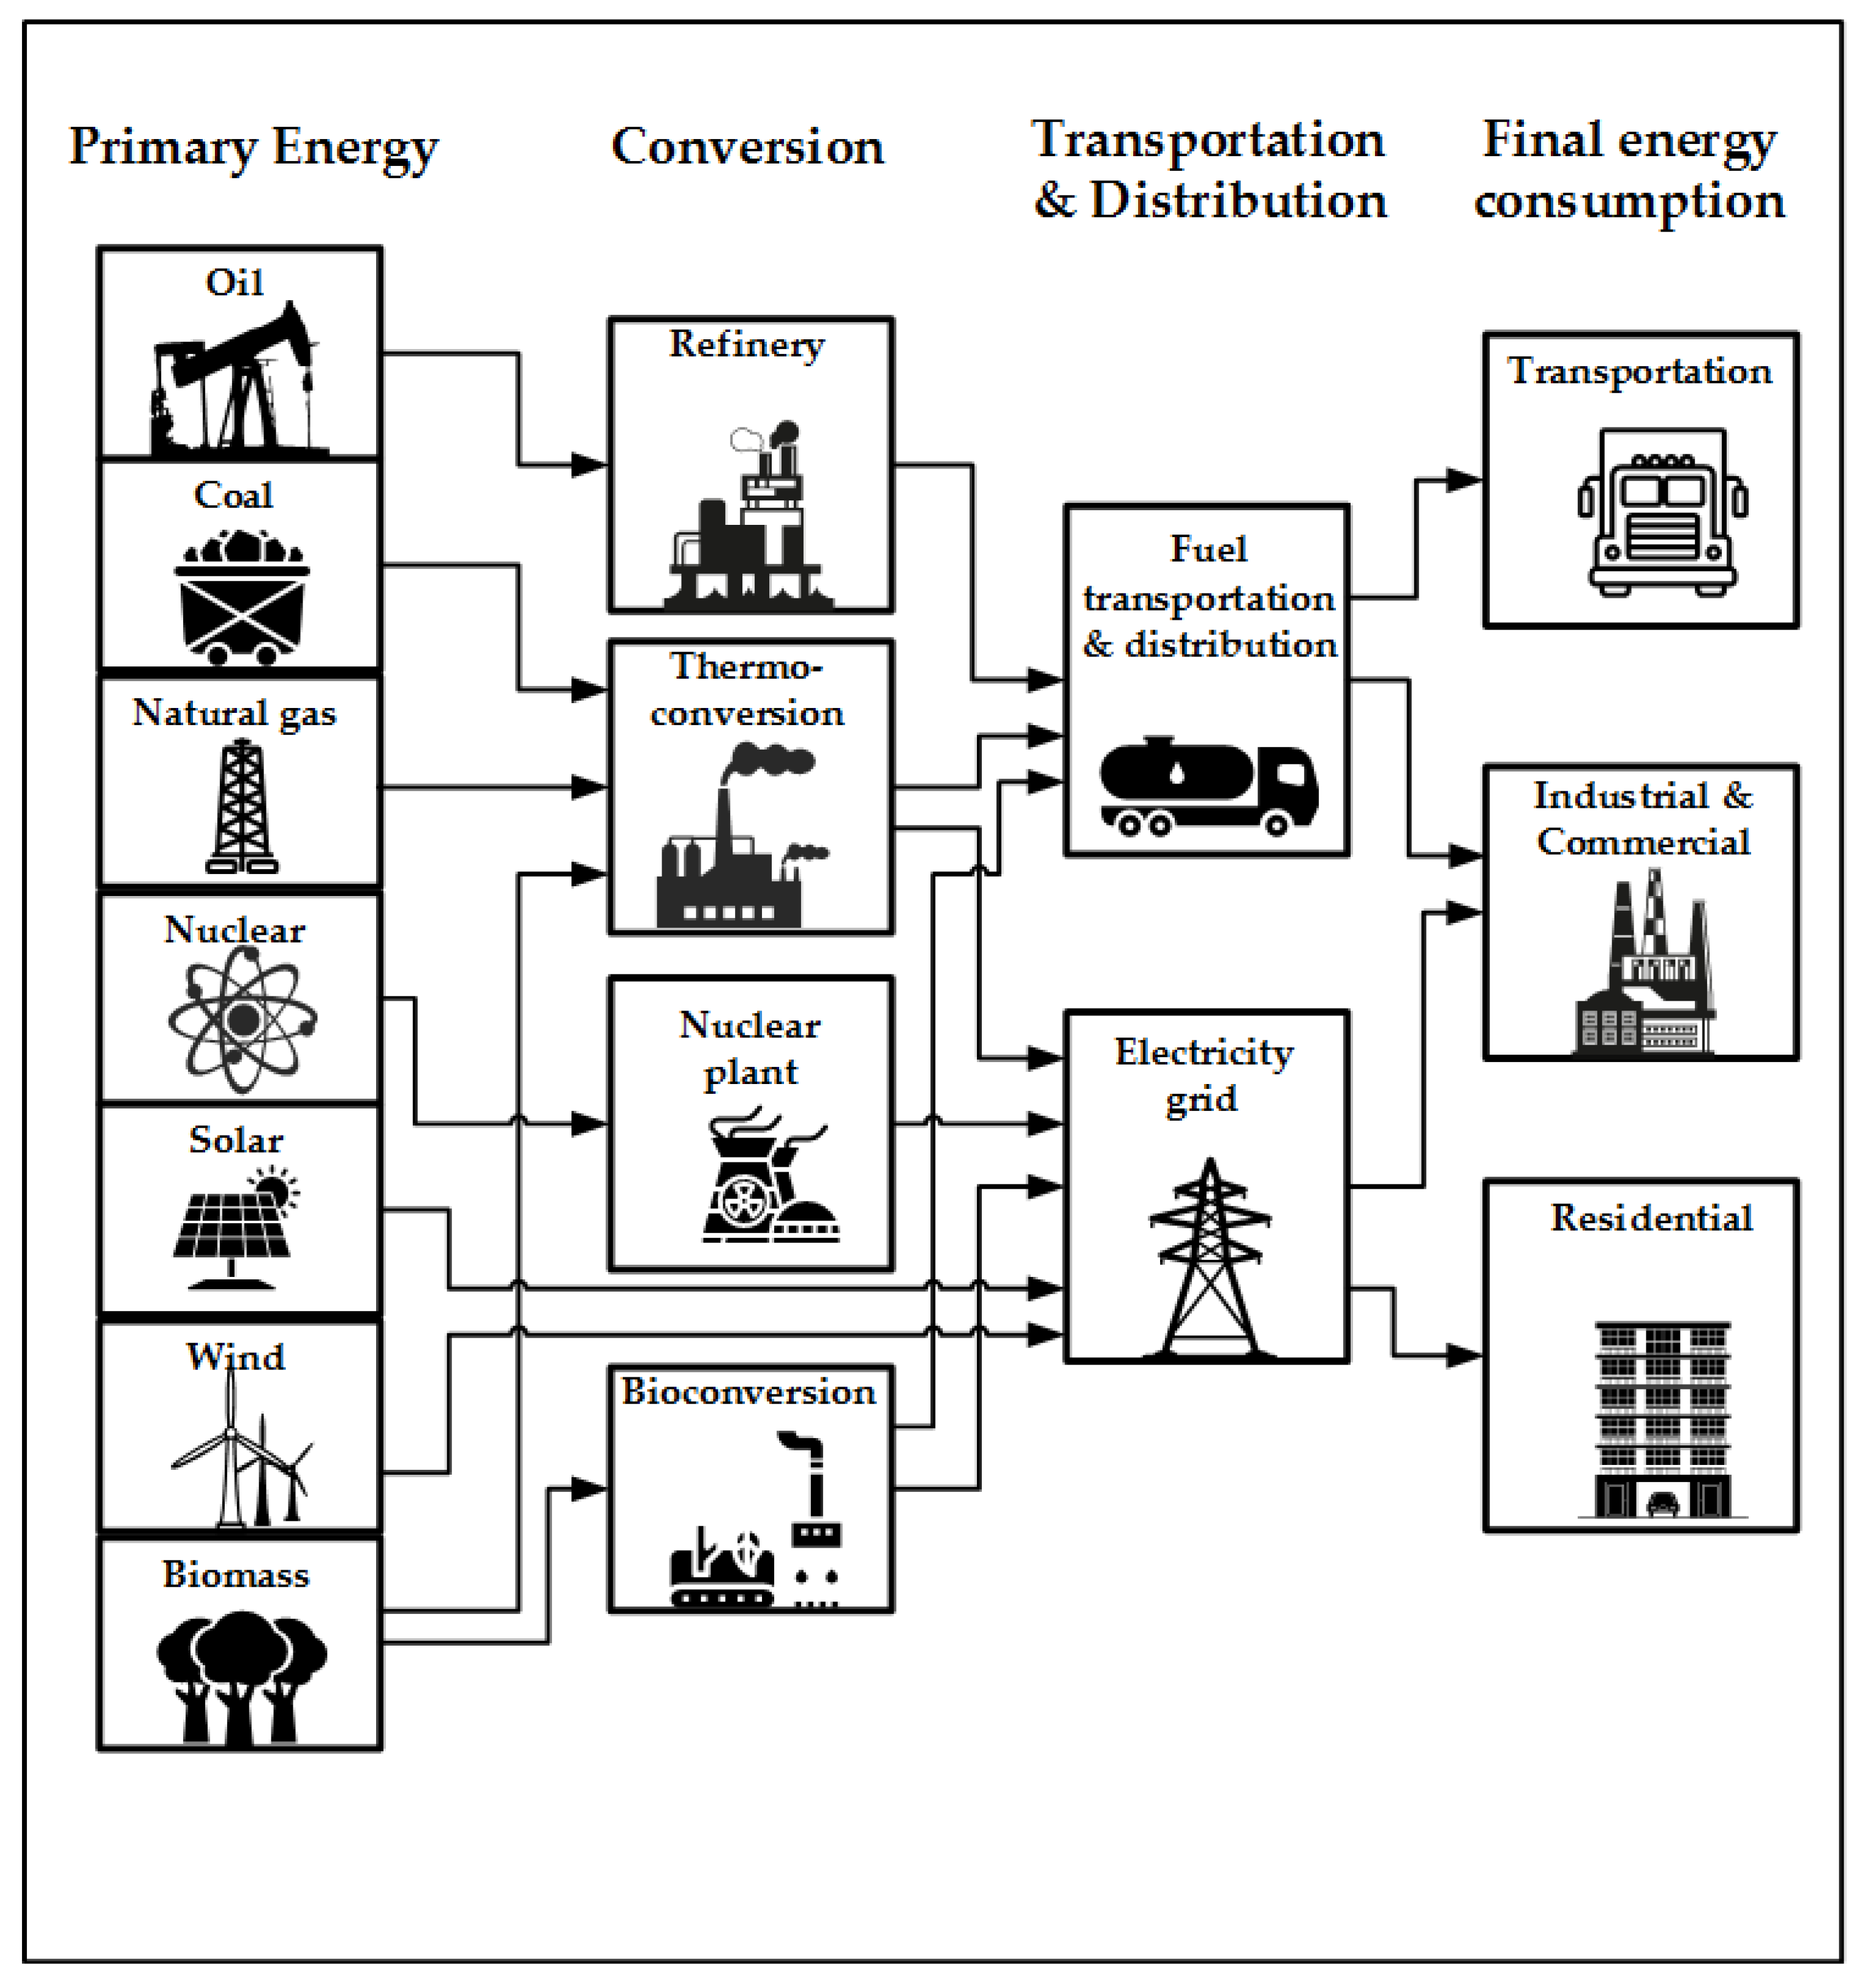
In the UK, we only have four oil refineries left. These are the basic building blocks of the modern industrial economy, but any company that comes in will not make a profit because the taxes are too high. The IPCC is making us poorer, both as nations and as individuals. Recent blackouts across Europe are just a glimpse into the dystopian future which awaits us.

As long as they continue to make us believe that man-made climate change is going to end life as we know it, we will keep filtering trillions of dollars throughout their organisation without questioning a thing. So what can we do? Firstly, I believe that the average person is more than capable of seeing a situation for what it really is. So please, tune in carefully as I seek to disprove the myth of man-made climate change once and for all.
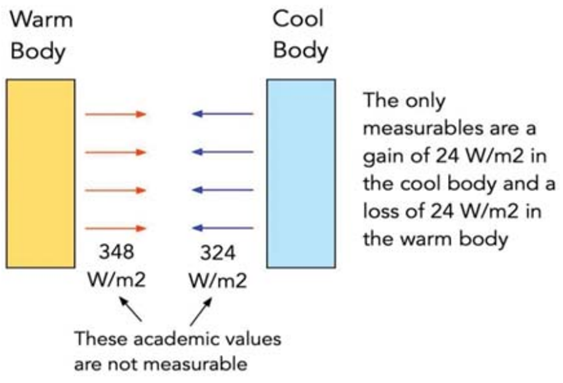
I’ve got you on tenderhooks now, that’s a good thing. You’re still with me. Let’s bust the first myth. More carbon dioxide causes a warmer planet. Here’s the truth. A recent study by arguably two of the world’s leading atmospheric scientists, both Professor Emeritus, one from MIT, one from Princeton, I mean, these guys are not messing around. They have shown that there is a limit to the amount of heat that is able to be trapped by carbon dioxide and they call this the saturation point. We are at 99% of the saturation point. Relatively speaking, no matter how much carbon dioxide we pump into the air, it will not increase our global temperature. It is but a fallacy. Joe Rogan recently had those authors on his podcast, Dr. Linzen and Dr. Happer. Joe Rogan also wants people to stop drinking the Kool-Aid.

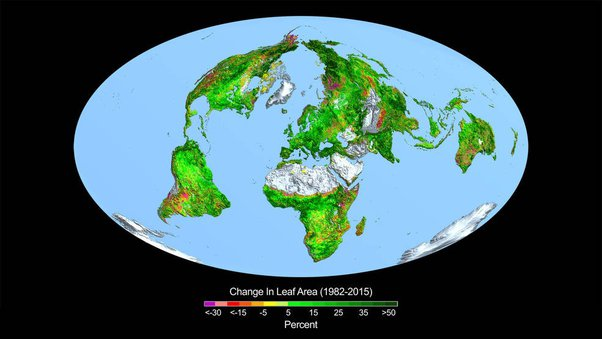
Now let’s bust the second myth, that carbon dioxide is bad for the planet. Guess what? Carbon dioxide is actually good for the planet. That’s right, I said it, the truth. Satellite data shows that plant growth has increased significantly over the last 35 years due to increased carbon dioxide. NASA measured a 10% greening of the earth between 2000 and 2020 alone. Meanwhile, at university, I was taught that trees would starve due to climate change.
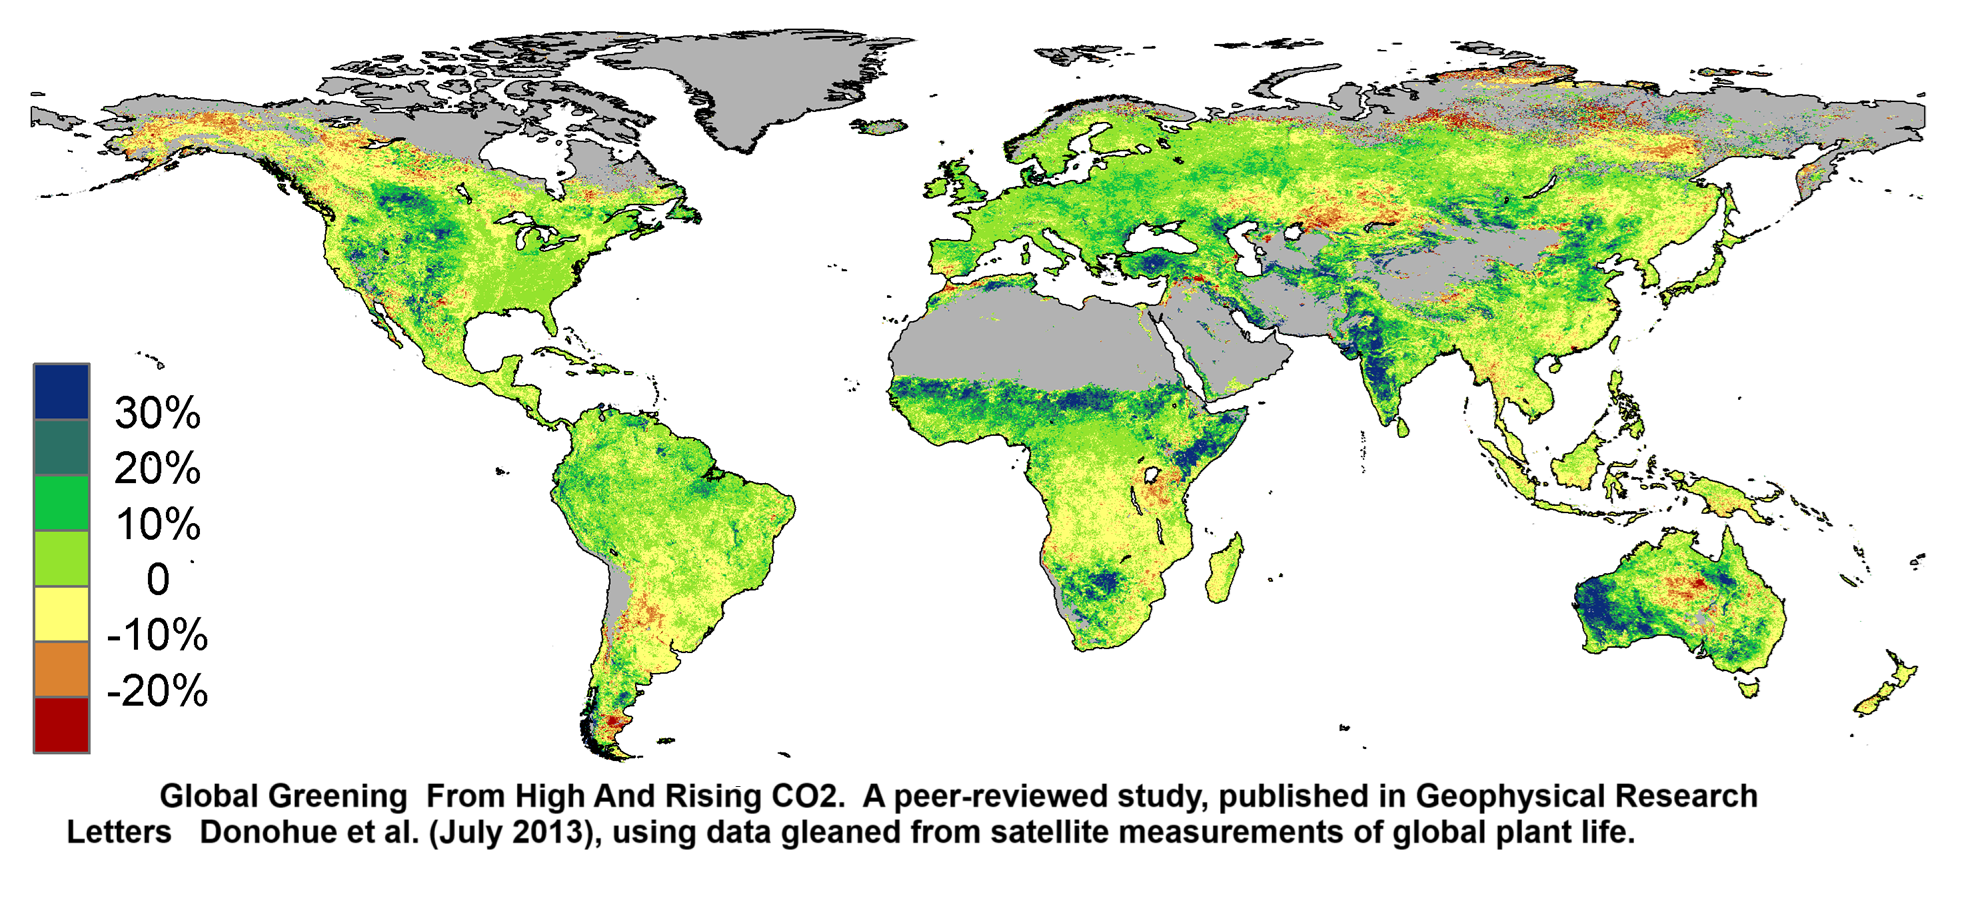
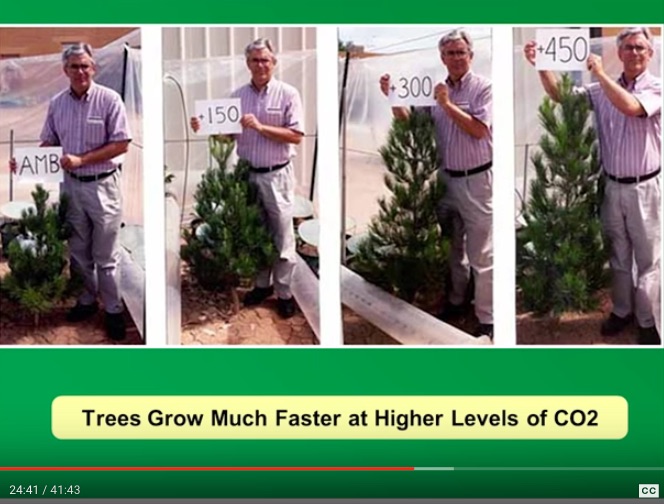
They intentionally used the word starve to elicit an emotional response. What actually happens is that when there’s more carbon dioxide available, not only do plants grow faster, but they use less water. We know this because commercial greenhouses pump carbon dioxide to 1400 parts per million because it grows the best plants. It’s called carbon dioxide enrichment. Come on. Carbon dioxide enriches the earth.
And the third myth, carbon dioxide has a direct relationship with temperature. Al Gore was the person responsible for demonizing carbon dioxide, and he said carbon dioxide is the highest it’s ever been. It’s just another lie. It’s actually the lowest it’s been in the last 320 million years. Not only that, but some of the highest levels of carbon dioxide occurred during an ice age 340 million years ago, which just proves that carbon dioxide and temperature have no direct link whatsoever.

Of course, in my training, carbon dioxide and its rise or fall could explain everything that happened in our climatic history through some sort of feedback loop or time lag mechanism. And this is the whole basis of their argument. That more carbon dioxide we put into the atmosphere, the more the temperature will increase. The most important takeaway from this today is that is a lie. The truth is, the earth is just getting greener, and we are simply uneducated as to why the climate actually changes. Indeed, all of us are completely brainwashed to never question it.
So why do the IPCC have a conflict of interest with the truth? Let’s understand exactly how much power this unelected, undemocratic, unaccountable, non-governmental organization are protecting with their lies. The IPCC produce assessments that 195 governments around the world use as an authoritative reference for climate policy. They use IPCC scenarios to set emissions targets, justify carbon budgets. If countries argue for compensation or climate aid, they cite IPCC risk assessments.
The IPCC projections define which regions are at risk and therefore where the money flows. And what they really don’t want you to know is that the most powerful leverage is in financial markets. IPCC scenarios are used in ESG scoring frameworks, climate stress testing for banks, insurance risk models, central bank climate risk assessments, and investment screening criteria. In practice, this means that a company’s ability to access capital increasingly depends on whether its business model is aligned with IPCC-derived pathways.
They have a monopoly not only on the success of entire countries but on individual business interests. In effect, their projections now sit upstream of policy, regulation, infrastructure, and economic structure. And this here, this is why they carry so much power. This isn’t just undemocratic, it’s anti-democratic. I never voted for them to make these decisions. These are people that cannot be held to account by the electorate and that is an unacceptable structure. It is a socialist, globalist agenda that has been carried out right beneath our noses. And it is the spitting image of the one world government framework that was prescribed in my training.

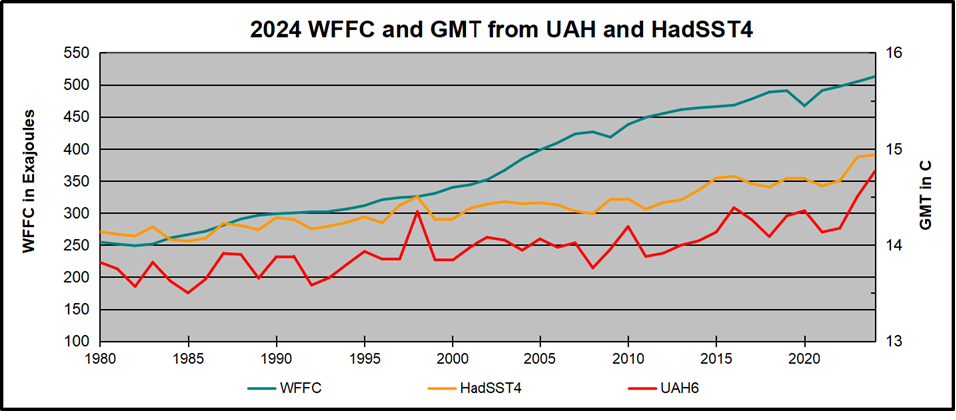
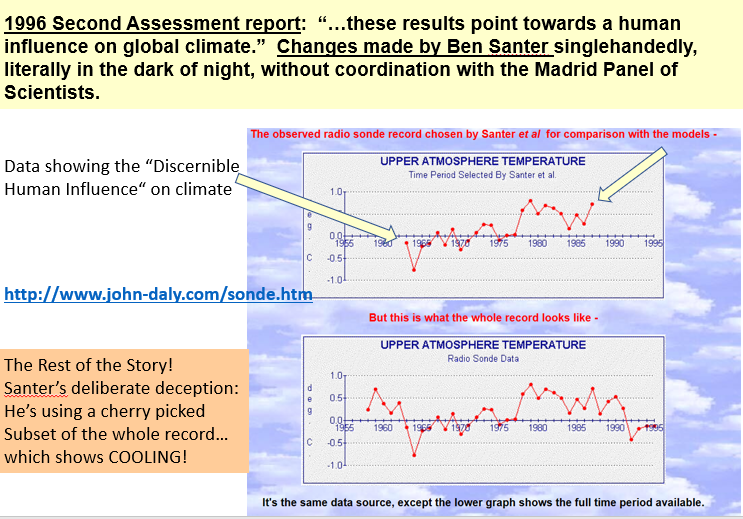
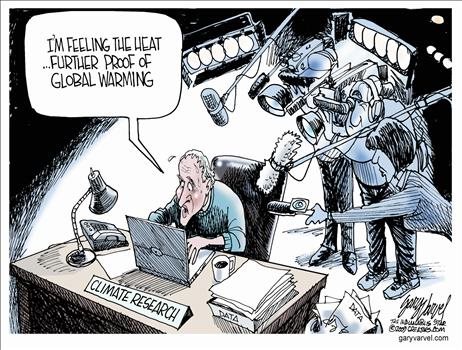
So, with the whole world relying on their projections, with trillions of dollars on the line, you would think that their utmost priority should be the accuracy of those projections. It’s why the believers say, look at the data, you can’t ignore the data. Well, spoiler alert, the data is doctored, just like it’s always been, just like my textbooks were, just like my lecture notes were, this whole thing is indoctrination.
And here is the proof. Hackers leaked emails from IPCC assessment report authors which exposed them freely discussing their efforts in deleting and manipulating the real data because it didn’t quite fit with their doomsday story.

And I quote, I’ll maybe cut the last few points of the filtered curve as that’s trending down. They needed it to be trending upward to fit with their past projections. Another email says, I’ve just completed Mike’s nature trick to hide the decline. These are real emails between the authors of the IPCC report. There are more than 2000 emails like this showing corrupt behavior and they are still the lead authors today. They are unelected, corrupt and have a conflict of interest with the truth. Trillions of dollars of spending rests on fabricated nonsense.
In the UK, if we don’t allocate our national budget to their satisfaction, we’re taken to court. Most recently, we were taken to the European Court of Human Rights because of failure to adequately prepare for extreme heat and flooding. And this, they say, violates fundamental human rights because we are not protecting people against man-made climate change. It is an outrage. So what can we do? It’s time to reclaim our sovereignty.

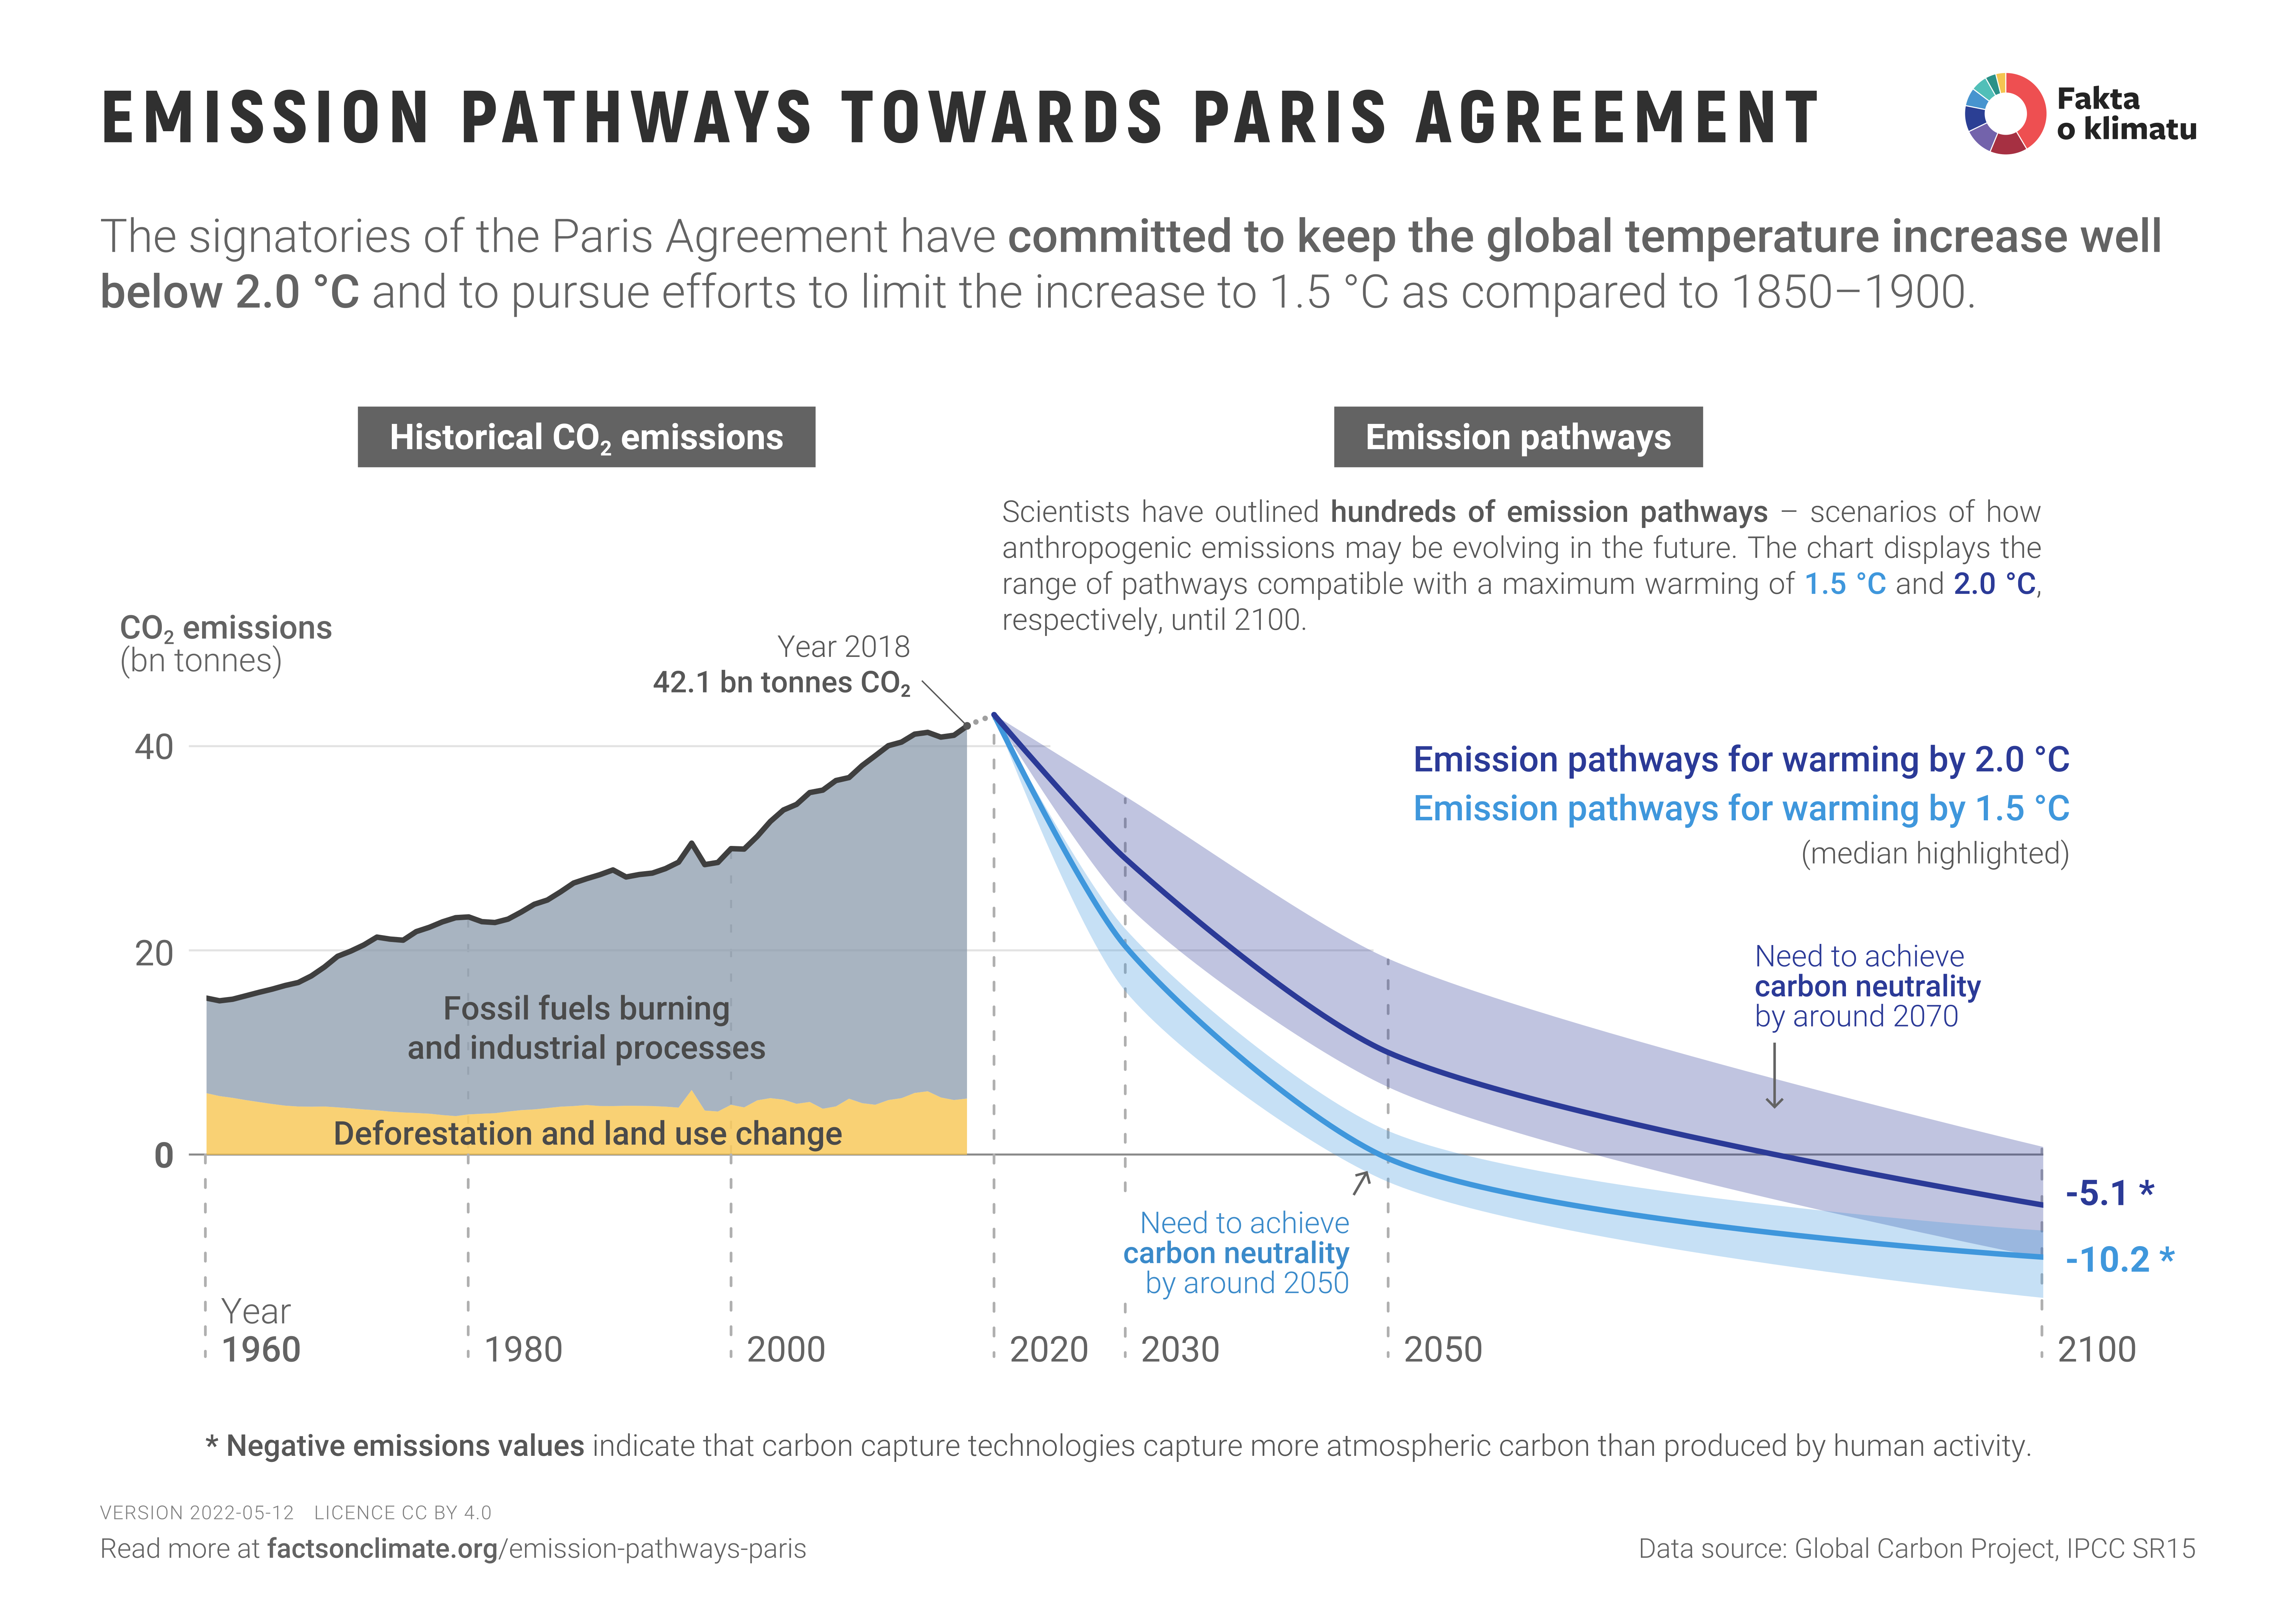
And we do this by formally leaving all agreements governed by the climate establishment, repeal the Climate Change Act, withdraw from the Kyoto Protocol, withdraw from the UNFCC, leave the Paris Agreement. America withdrew from all United Nations architecture this month. It’s time for the rest of the world to follow suit.

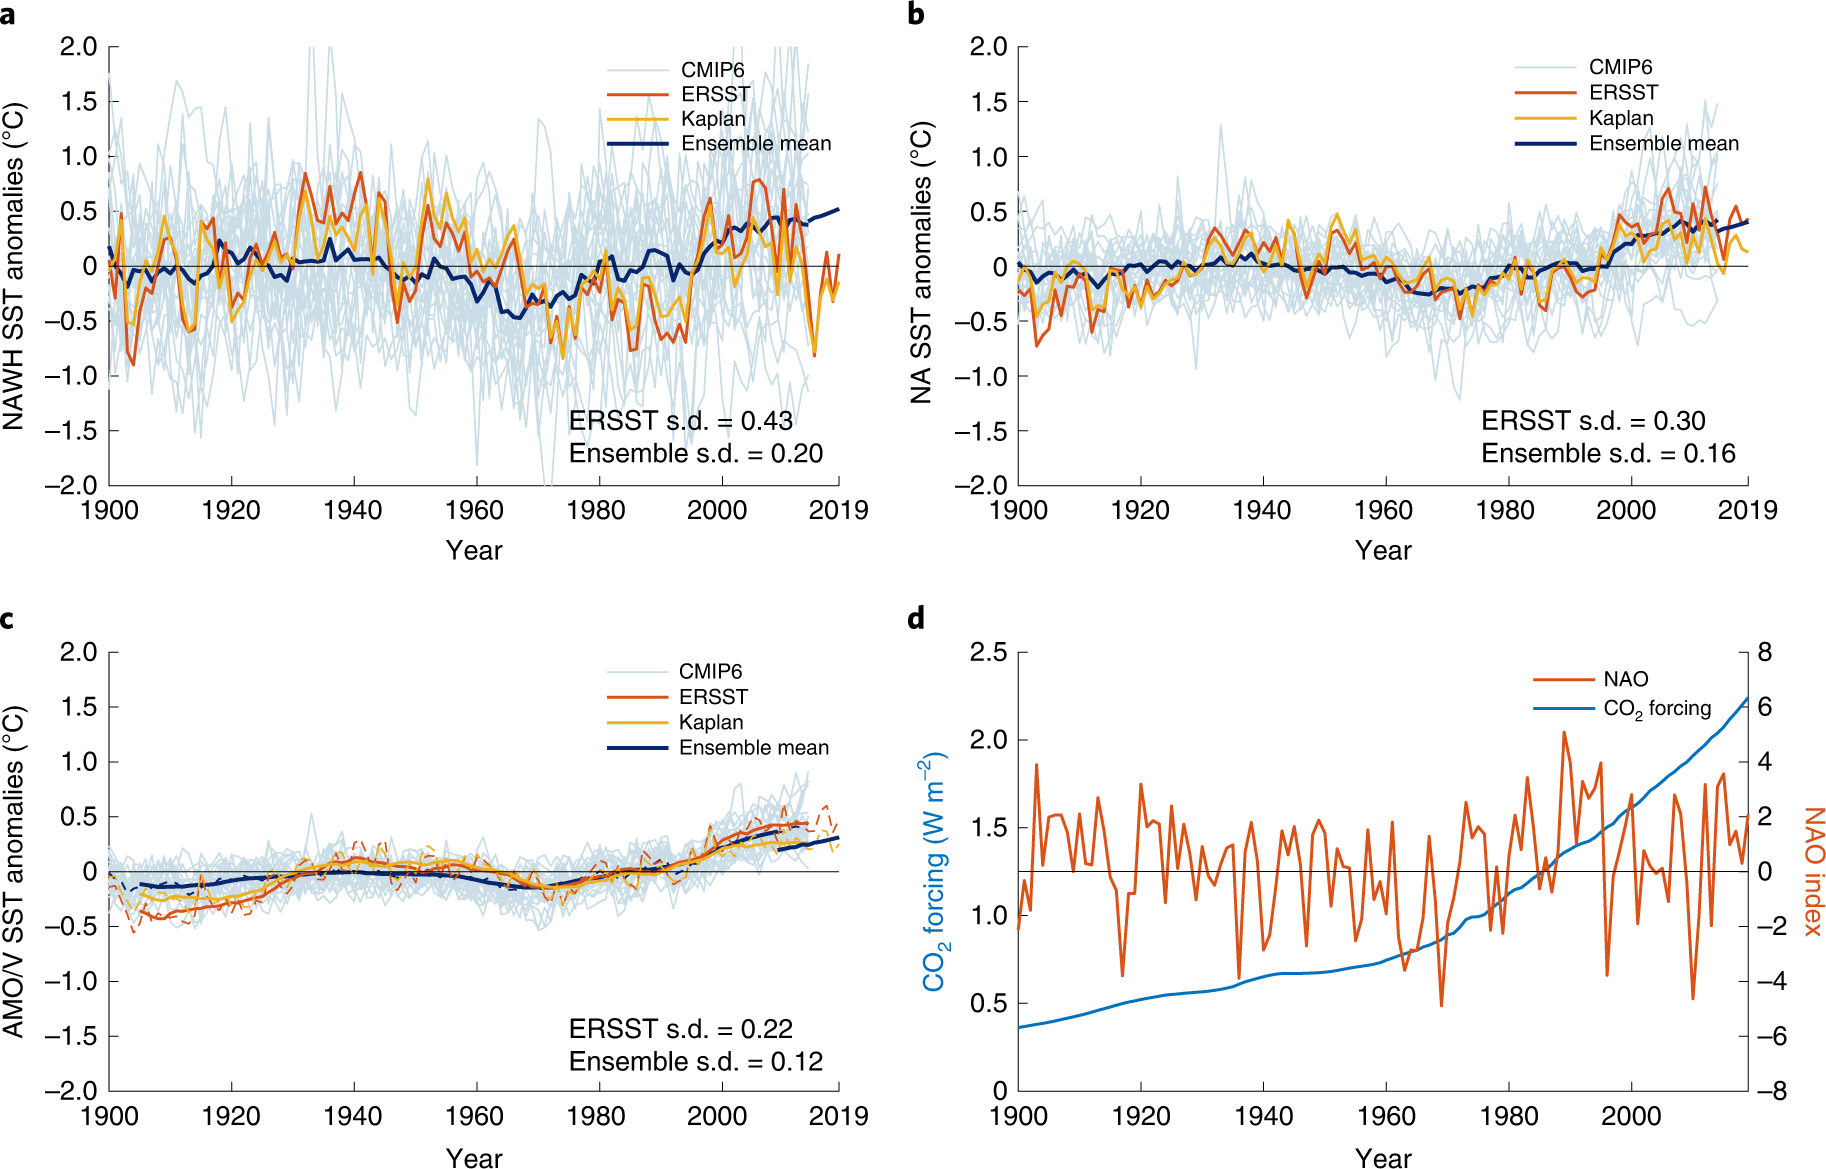
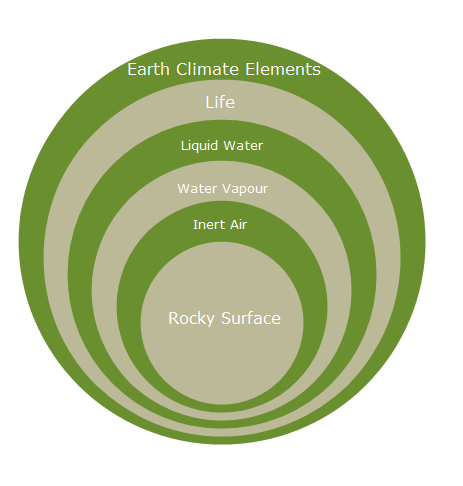
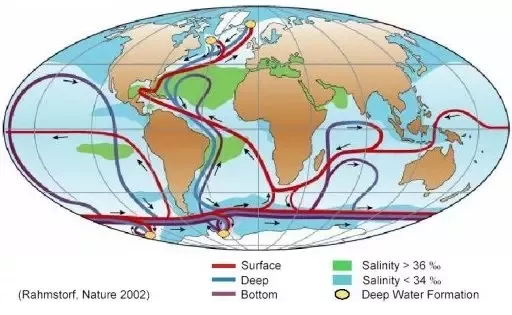
I can already hear the objections, but if we don’t act, aren’t we doomed? As a climate scientist, let me reassure you. The climate is meant to change and it’s meant to change drastically. It is just its natural state and this is very much like the earth. We are in a natural period of warming called the Holocene. We’re still coming out of the Little Ice Age, which was between 1400 and 1900. Our earth’s climate gets warmer and cooler in 1500 year cycles. There is also an ocean pattern called El Nino Southern Oscillation, (ENSO) which drives huge temperature changes. Most global warming is in fact driven by changes in the ocean currents. Other changes are driven by orbital forcings called milankovitch cycles. These cycles change the position of our planet relative to the sun and historically produce an ice age every 100,000 years. There’s nothing man-made about it. There is only natural climate change.
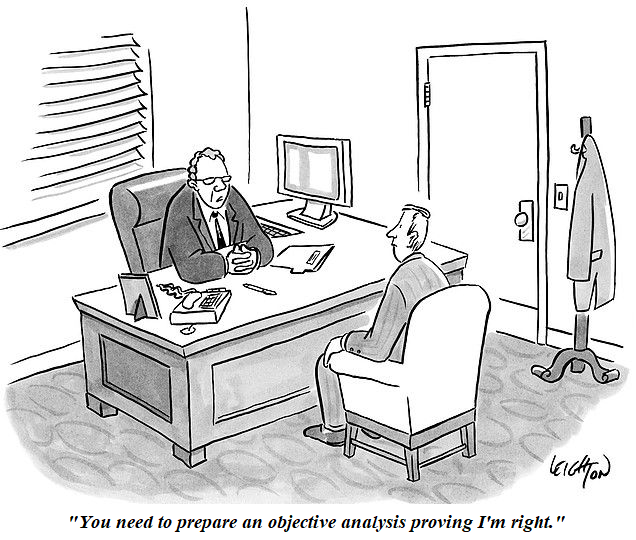
But training experts that the world will listen to and who will enact their agenda is a crucial part of the IPCC’s strategy to retain control. Well, I’m a climate scientist. I’m an expert. So, listen to me. All man-made climate education in schools has to stop. It is not science. It is consensus which is very different to objective scientific fact.
Teach them natural climate change. Teach them about milankovitch cycles, the El Nino. Do not teach them lies that I have just proven wrong. I don’t want my child to gain an ideology. I want him to gain an education. The next generation must be clever. And for this to happen, they need to be learning factual information.

For anyone out there that has ever felt guilty or afraid due to climate change, I want to reassure you, you are not the problem. We have been brainwashed every day by the media. We are being lied to every day. And if we question it, we’re told we’re crazy. We are told we’re in denial because the climate establishment is afraid.
They will tell you that I’m the extreme one because I don’t believe the world is on fire. They will do everything they can to make us fearful. The world as we know it is ending, burning, boiling, to maintain control, constrain us in regulatory burden, and have us accountable to their courts if we spend our taxpayers money the wrong way.

The climate establishment targeted intelligent people who genuinely loved the environment. They taught us the earth was dying and on the brink of collapse. And I believed it. That is not stupidity. That is programming. Because my university lecturers who I respected and the institution of the university itself assured me this was the latest cutting edge research.
I mean I’m thinking I want my money back at this point. They told you it’s settled. They told you it’s urgent. They told you to comply. Well, I’ve told you what they haven’t. The climate is meant to change. The man couldn’t affect the climate system even if he wanted to. Carbon dioxide is good for the planet and will not increase the temperature any. And both children and university students are being brainwashed to blindly perform and enact their agenda.
Well, I am no puppet. For me, once, shame on you. Fool me twice, shame on me. The choice of what to believe is now yours. But the establishment should be afraid because I am a climate scientist who knows the truth. Thank you. Thank you so much. I also just want to thank the Heartland Institute so much for having me speak at the inaugural World Prosperity Forum here in Zurich.