Why Your Energy Bill is So High (Kathryn Porter)
A part of Battle of Ideas Festival 2025 was the above presentation explaining plainly why UK energy has become so expensive. For those who prefer reading, below is a transcript with my added bolds and images.

Why are our electricity bills so high? We’re told as Craig referenced that it’s all the fault of gas. Now this argument is going to come to somewhat crashing reality in the next year. I was just checking the prices now and from yesterday’s close we’re now 87 percent down from the highs in 2022. Now has anybody seen an 87 percent reduction in their bills, hands up, anybody? Oh that’s a huge shock. Next year gas analysts expect that the gas price will return to its long-term average pre-2021.
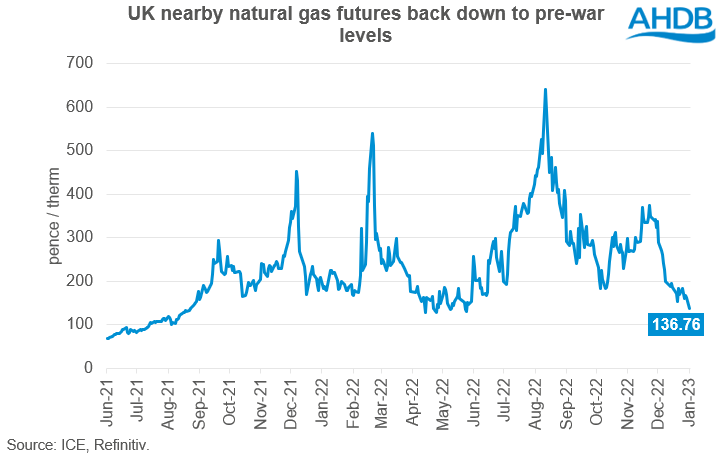
So the gas crisis actually began in the autumn of 2021, about six months before the invasion of Ukraine and it was to do with the recovery from COVID. Basically during COVID demand for gas fell because industrial activity dropped, a lot of upstream production was shut in and it takes time to bring that back, you can’t just turn on the tap in most cases, it requires quite a bit more work than that. So there was a delay in bringing that production back online and when you have more demand than you’ve got supply then prices go up and then Putin took advantage of this in the following February and well we all know what happened then.

Since then in the upstream sector they’ve been busy bringing new LNG, liquefied natural gas projects, on stream. By the end of this year there’ll be enough new LNG to fully replace all of Russian gas and sometime next year we’re expecting the global gas market to go back into length. So there’ll be more supply globally than there is demand and prices are expected to fall. In fact the only reason why Miliband could possibly deliver the 300 pound reduction in bills would be because of gas prices falling.
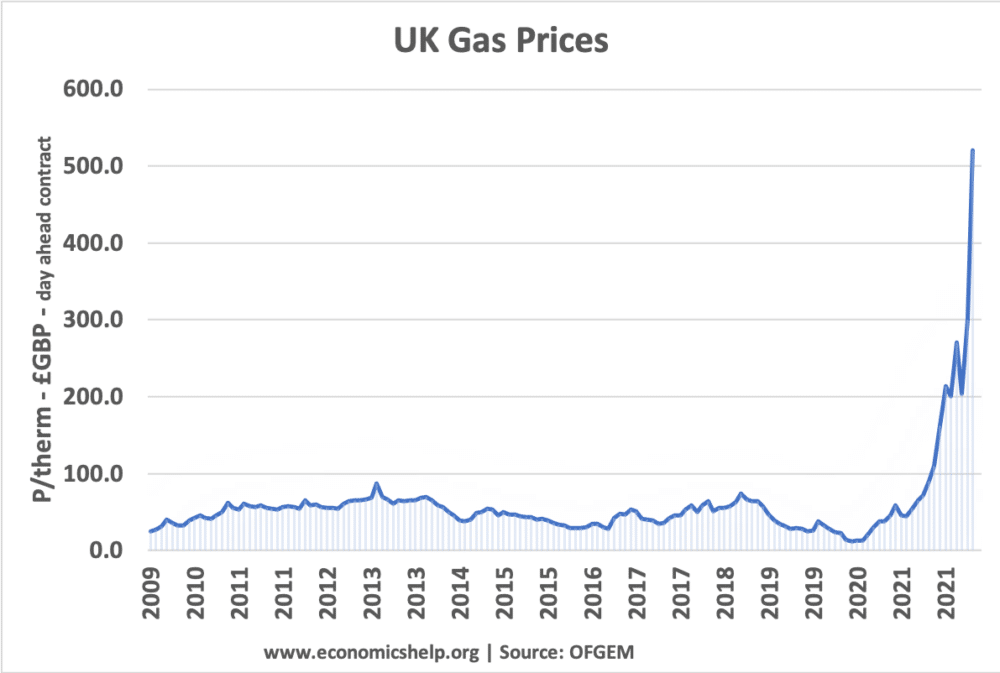
Unfortunately I think he’s going to more than offset that with higher subsidy costs. So the first thing is that gas is not expensive and really for 25 years we had very low and very stable gas prices. Gas was cheap, in fact the cheapness of gas was what enabled the energy transition to even begin. I wrote a report earlier in the year about the cost of renewables, if you do a chart that shows the wholesale price of gas, the wholesale price of electricity and then the domestic price of electricity what you find is that the wholesale gas price was low and stable until 2021.

The wholesale electricity price was basically the wholesale gas price plus a little bit which is what you’d expect and then the domestic price was the wholesale price of electricity plus a little bit. And again you’d expect that you buy a wholesale, you pay for it to be delivered to your house, you’ve got to pay the supplier some money for you know doing the admin for that, they want to take a bit of profit, there’s some taxes, that’s what you’d expect.
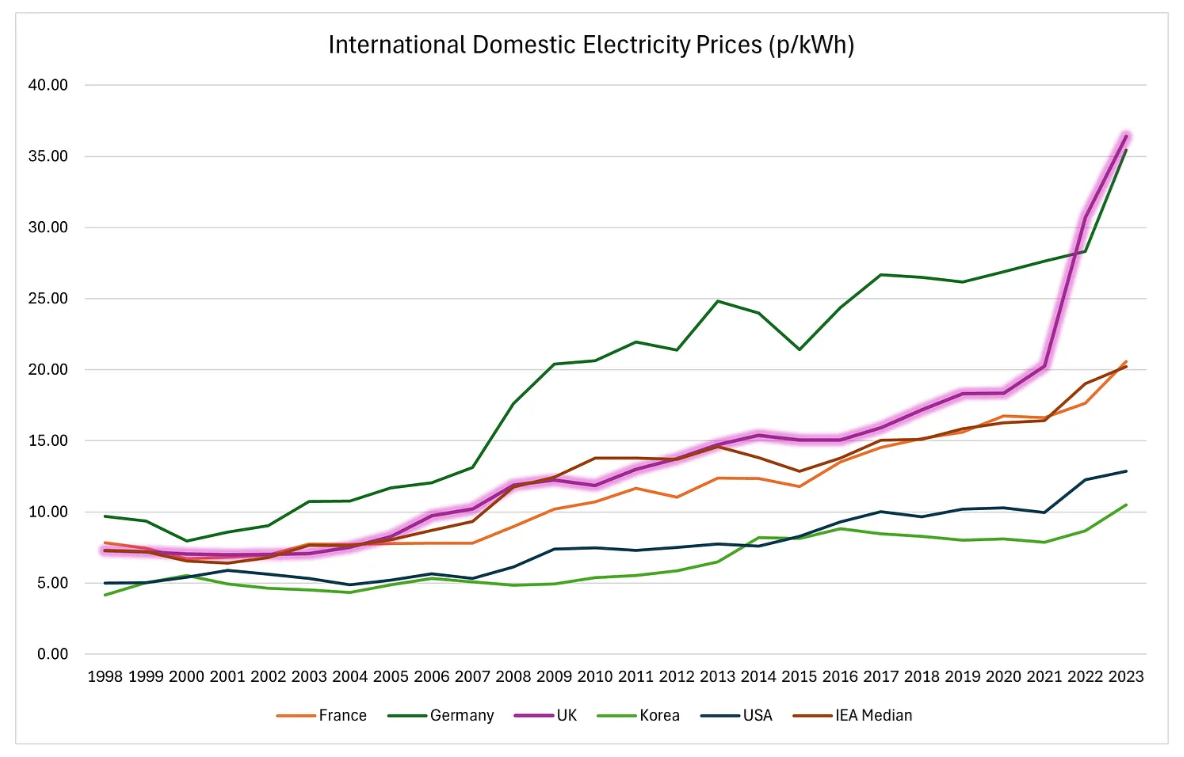
Figure 4 – International Domestic Electricity Prices (p per kWh). UK has the highest domestic electricity prices in the IEA.
But from 2006 this relationship started to break down and what we saw was a steep increase in what households were paying despite a flat trajectory for wholesale prices. Why was this? It was because we were adding on policy costs. We’re subsidizing renewables, we started using suppliers to do all sorts of other social programs, wealth redistribution, literally the warm homes discount is suppliers. They phone up the department for work and pensions and they find out which of their customers are eligible and then they calculate how much that discount is going to cost and then they add on an admin fee and then they spread that cost out across all our other customers.

They take money from one group of customers to give to another. This is wealth redistribution, it’s not the job of private companies. The energy company obligation, we’ve heard about that in the news this week where I think the National Audit Office has written a report saying how inefficient it is, how low quality the work is. Well guess what, energy companies are not experts in construction. They are being expected to engage in sub contracts to companies that will come in and install insulation and similar things in your home. They don’t know anything about this, this isn’t part of their core business.
Typically as wind and solar power share of supply increases, distribution and transmission costs rise sharply.
It’s a hugely inefficient thing to expect suppliers to do and the cost of all that is added to bills. The smart meter rollout, we’re the only country in the world that expects suppliers, retailers, to install network equipment in people’s homes. Everyone else got the network companies to do it, you know, duh. And what’s even worse is that the supply business was created within the Utility Act 2000. It was the final part of unbundling the energy system and almost immediately both the governments and the regulators started telling everyone that suppliers were greedy profiteers that couldn’t be trusted.
And then they expressed shock that nobody wants these greedy profiteers who can’t be trusted to install devices in their home that would give the greedy suppliers that can’t be trusted lots of information about how they’re using electricity and gas and potentially enable them to change your prices remotely, put you onto prepayment tariffs remotely and do all sorts of other stuff remotely, potentially without your permission. And they were just kind of shocked that people didn’t want to do that. So the whole market is completely dysfunctional.

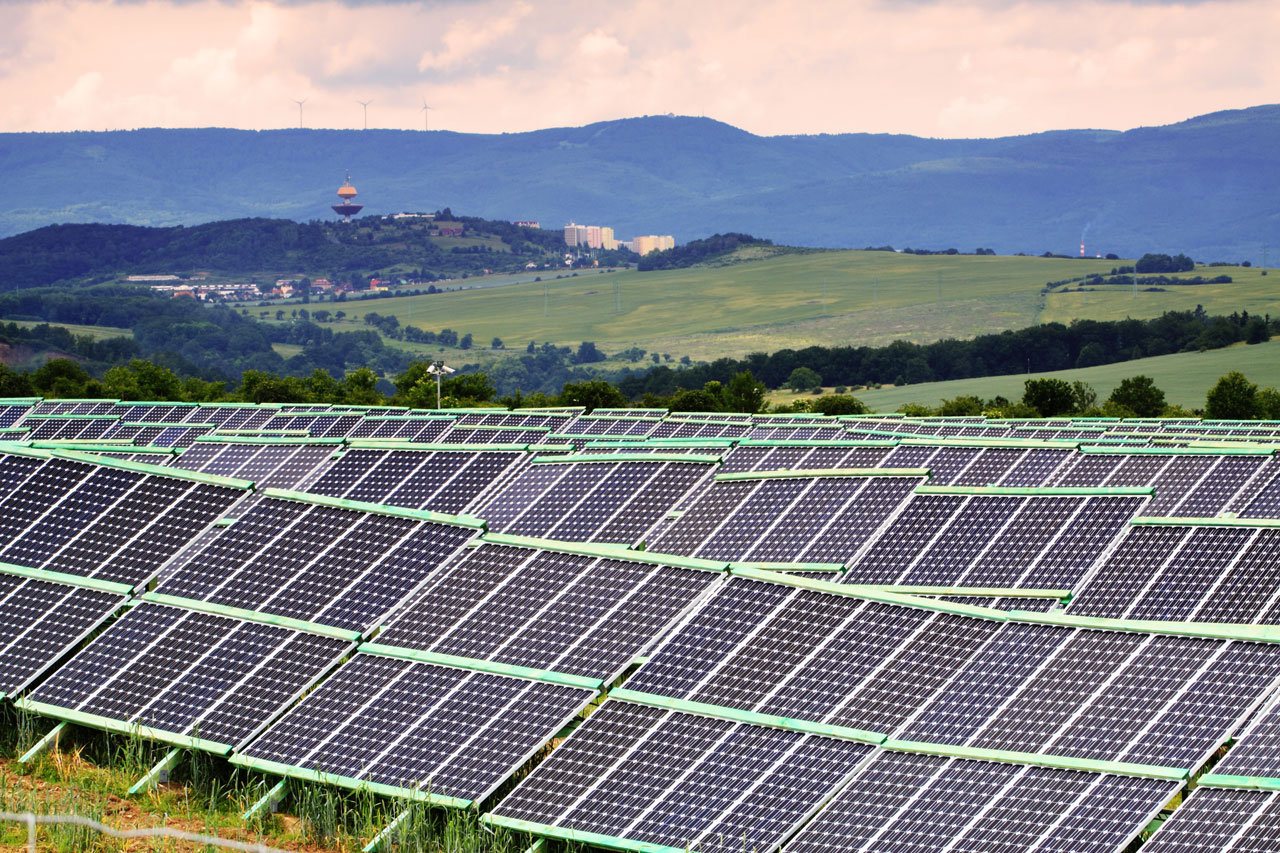
Now, when we come to the real costs and the real reasons that our bills are so high has to do with renewables. When we build renewable generation, we have to provide a big subsidy. Now, a lot of people think, well, the wind and the sun are free. And this is true. Wind energy and solar energy is free. But the equipment needed to turn that energy into electricity is not free. That’s actually pretty expensive.
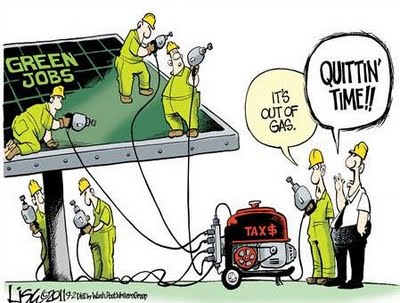
Now, imagine that we only had renewables on our grid. And when you’re setting prices, normally, the price at which you sell your goods is linked to your short run marginal operating cost, which for wind and solar is close to zero. Essentially, you’d be giving it away. How are you going to recover your capital costs for that expensive equipment if you have to give away your products? You’re never going to be able to do it. So basic economic theory will tell you that renewables will never be built without subsidies. They are always going to require subsidies because you will never be able to recover the capital costs to selling the electricity at the short run marginal operating cost of that electricity.

So we give subsidies to renewables. And that subsidy is higher than the cost of generating electricity with gas. So the argument about gas pushing your bills up is nonsense. These subsidies are higher than the cost of generating electricity with gas. And the way the new subsidies work is that the generators are guaranteed a fixed price, and they receive that by selling that electricity in the market. And then if that’s lower than this fixed price, they get a top up.
And it’s a one for one relationship. If you lower the wholesale price of electricity by one pound, you increase the subsidy cost by one pound. And the subsidies are added to our bills. They come straight out of our pockets. So when people say, oh, we’ve got to get off gas, we’ve got to stop marginal pricing. People talk about marginal pricing as if we’re some weird outlier in the world markets doing this strange marginal pricing thing, taking the most expensive form of generation to set the price.

Every deregulated power market in the world sets the electricity price through marginal pricing. In fact, most commodity markets do the same thing. This isn’t weird. It’s completely normal.
And if you decided to change price formation to lower the wholesale price, your bill will stay the same. You’re just moving money in different buckets around the bill. Now the bit that says wholesale price will go down, and the bit that says policy costs will go up. But the amount you pay will stay the same. And so this is the whole misinformation that we have.

The other issues with renewables are you’ve got to pay for backup. They have low energy density, so you need a lot more wires to connect them. A good sized gas power station, 800 megawatts. If you wanted an equivalent size wind farm, you need 60 turbines. So that’s 60 times more wires. But to get the same amount of electricity over the year, because your wind is only working about a third of the time compared with about 86% of the time for gas, you need something like 150 times the wires. You need 150 turbines.

All that gets added onto your bills. The cost of backup to make sure you’ve got generation available when it’s not windy and sunny, that goes straight onto the bill. And the real-time balancing cost, where you’re having to even out the impact of clouds and gusts of wind, all goes on the bill. And so this is why our bills are so high.


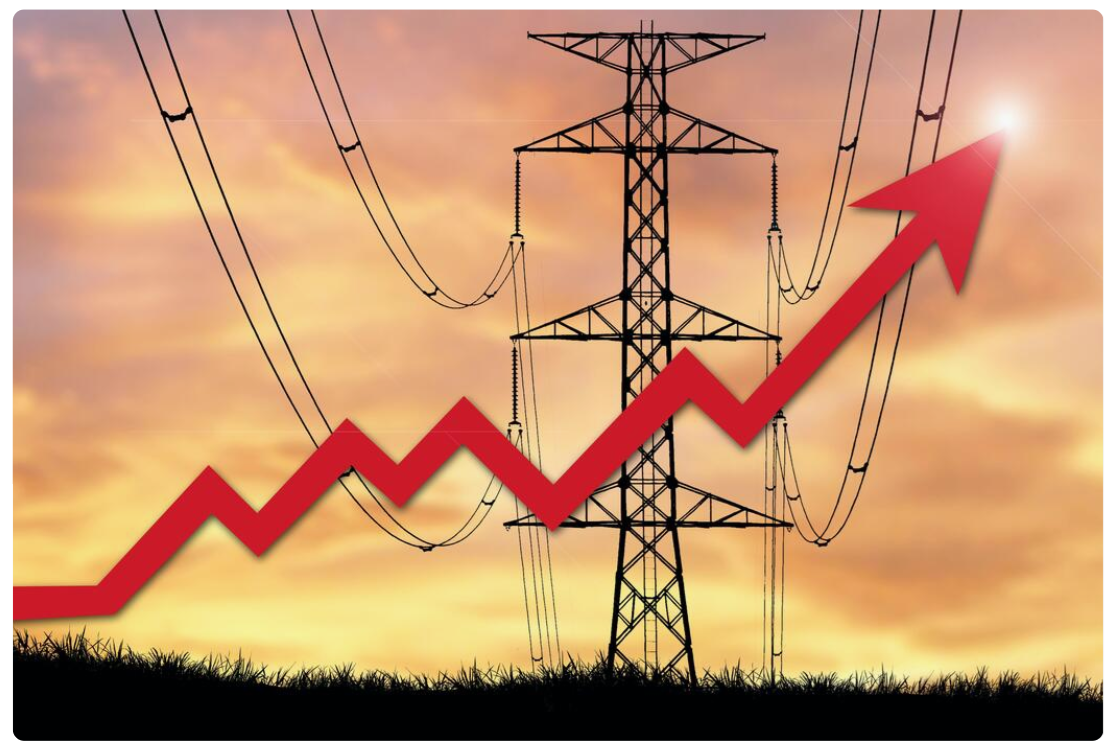


 The system is under strain even without electrification