The Climate Story (Illustrated)

The captions and most comments below come from Mike van Biezen in his recent essay published at the Daily Wire (here). To illustrate his points, I added images collected from various internet addresses. Michael van Biezen teaches physics and earth sciences at Loyola Marymount University, Los Angeles, and his many lectures are available on Youtube at his website (here).

Temperature records from around the world do not support the assumption that today’s temperatures are unusual.

giss-annual-temps4

Global Mean Temperature from land and ocean expressed in absolute degrees F.

Satellite temperature data do not support the assumption that temperatures are rising rapidly.

john-christy-climate-change-chart-0a201a1637955761

The world experienced a significant cooling trend between 1940 and 1980. CO2 levels do not correlate consistently with temperatures.

Urban heat island effect skews the temperature data of a significant number of weather stations.

There is a natural inverse relationship between global temperatures and atmospheric CO2 levels.

Higher temperatures increase atmospheric CO2 levels and lower temperatures decrease atmospheric CO2 levels, not the other way around.

The CO2 cannot, from a scientific perspective, be the cause of significant global temperature changes

The H2O molecule which is much more prevalent in the Earth’s atmosphere, and which is a bend molecule, has many more vibrational modes, and absorbs many more frequencies emitted by the Earth, including to some extent the radiation absorbed by CO2. It turns out that between water vapor and CO2, nearly all of the radiation that can be absorbed by CO2 is already being absorbed.

Many periods during our recent history show that a warmer climate was prevalent long before the industrial revolution.

Glaciers have been melting for more than 150 years.

“Data adjustment” is used to continue the perception of global warming.

The Moral of The Climate Story:

Global warming alarm is not supported by temperature data.

Pause Deniers Busted

Updates October 3 and 30 below

With Paris COP drawing near, the lack of warming this century is inconvenient and undermines the cause.

As Dr. Judith Curry said, “I have been expecting to start seeing papers on the ‘hiatus is over.’ Instead I am seeing papers on ‘the hiatus never happened.’”

One that was trumpeted came out of my Alma Mater, Stanford.  They garnered the expected headlines from the usual places:

Global Warming “Hiatus” Never Happened: Eos

There never was any global warming “pause.”:  Washington Post

The text is here: Debunking the climate hiatus

http://download.springer.com/static/pdf/969/art%253A10.1007%252Fs10584-015-1495-y.pdf?originUrl=http%3A%2F%2Flink.springer.com%2Farticle%2F10.1007

The write up has statistical razzle-dazzle and lots of opaque sentences, but let’s not get lost in the weeds.

Let’s not talk about the multiple tamperings to the land records they chose to study.  Let’s even overlook their including the bogus upward adjustments to the SSTs by Karl et al.  Bob Tisdale dissected that here: https://bobtisdale.wordpress.com/2015/06/04/noaancdcs-new-pause-buster-paper-a-laughable-attempt-to-create-warming-by-adjusting-past-data/

We don’t need to get into the technicalities of why they stopped with 2013 data, the suitability of the tests applied or their interpretations of the results.

Here’s what you need to know about this study:

They ignored the satellite records (RSS and UAH), the gold standard of temperature measurements, because the absence of warming there is undeniable.

For the land and ocean datasets they analyzed, they ignored the huge divergence between observations and the predictions (projections) from climate models.

Conclusion:

Natural variability in the climate system has neutralized any warming from increased CO2 this century, and also offset most, if not all of the secular rise in temperature since the Little Ice Age.  The models did not forecast this; they can only project warming, and do so at rates several times higher than observations.  The models fail for three reasons:  high sensitivity to CO2; positive feedback from water vapor; and lack of thermal inertia by the oceans.

For more on climate models and temperature projections:
https://rclutz.wordpress.com/2015/03/24/temperatures-according-to-climate-models/

The Stanford football team was impressive beating highly-rated Southern Cal on their home field last Saturday.  The work of the research team, however, looks like pandering rather than science.  They need to up their game: No cookies.

Update October 3

I found the time to look into the details of this paper and the statistical trick comes to light.

They took as the null hypothesis: “Temperatures are not rising.”  After applying several statistical tests, they conclude that the statement is not supported by the data, so we cannot say with certainty temperatures are not rising.

And what about the other null hypothesis: “Temperatures are rising.”  Silence.

I suspect they didn’t want to admit that the same statistical tests would also disprove that statement.

A reasonable person concludes: When you can not say for sure that temperatures are not rising, or that they are rising, that would surely indicate a plateau in temperatures.

Update October 30–Another classic from Josh

When is it Warming?–The Real Reason for the Pause

June 21 E.M. Smith made an intriguing comment on the occasion of Summer Solstice (NH) and Winter Solstice (SH):

“This is the time when the sun stops the apparent drift in the sky toward one pole, reverses, and heads toward the other. For about 2 more months, temperatures lag this change of trend. That is the total heat storage capacity of the planet. Heat is not stored beyond that point and there can not be any persistent warming as long as winter brings a return to cold.

I’d actually assert that there are only two measurements needed to show the existence or absence of global warming. Highs in the hottest month must get hotter and lows in the coldest month must get warmer. BOTH must happen, and no other months matter as they are just transitional.

I’m also pretty sure that the comparison of dates of peaks between locations could also be interesting. If one hemisphere is having a drift to, say, longer springs while the other is having longer falls, that’s more orbital mechanics than CO2 driven and ought to be reflected in different temperature trends / rates of drift.”

https://chiefio.wordpress.com/2015/06/21/summer-solstice-is-here/

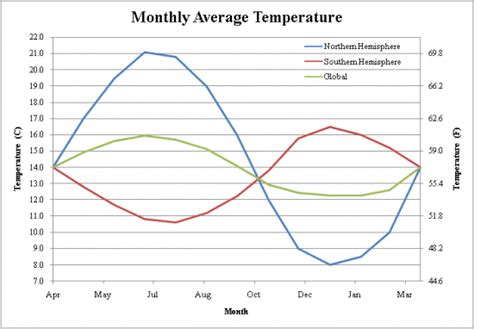
Notice that the global temperature tracks with the seasons of the NH. The reason for this is simple. The NH has twice as much land as the Southern Hemisphere (SH). Oceans have greater heat capacity and do not change temperatures as much as land does. So every year when there is almost a 4 °C swing in the temperature of the Earth, it follows the seasons of the NH. This is especially interesting because the Earth gets the most energy from the sun in January right now. That is because of the orbit of the Earth. The perihelion is when the Earth is closest to the sun and that currently takes place in January.

http://theinconvenientskeptic.com/2010/10/how-the-northern-hemisphere-drives-the-modern-climate/

Observations and Analysis:

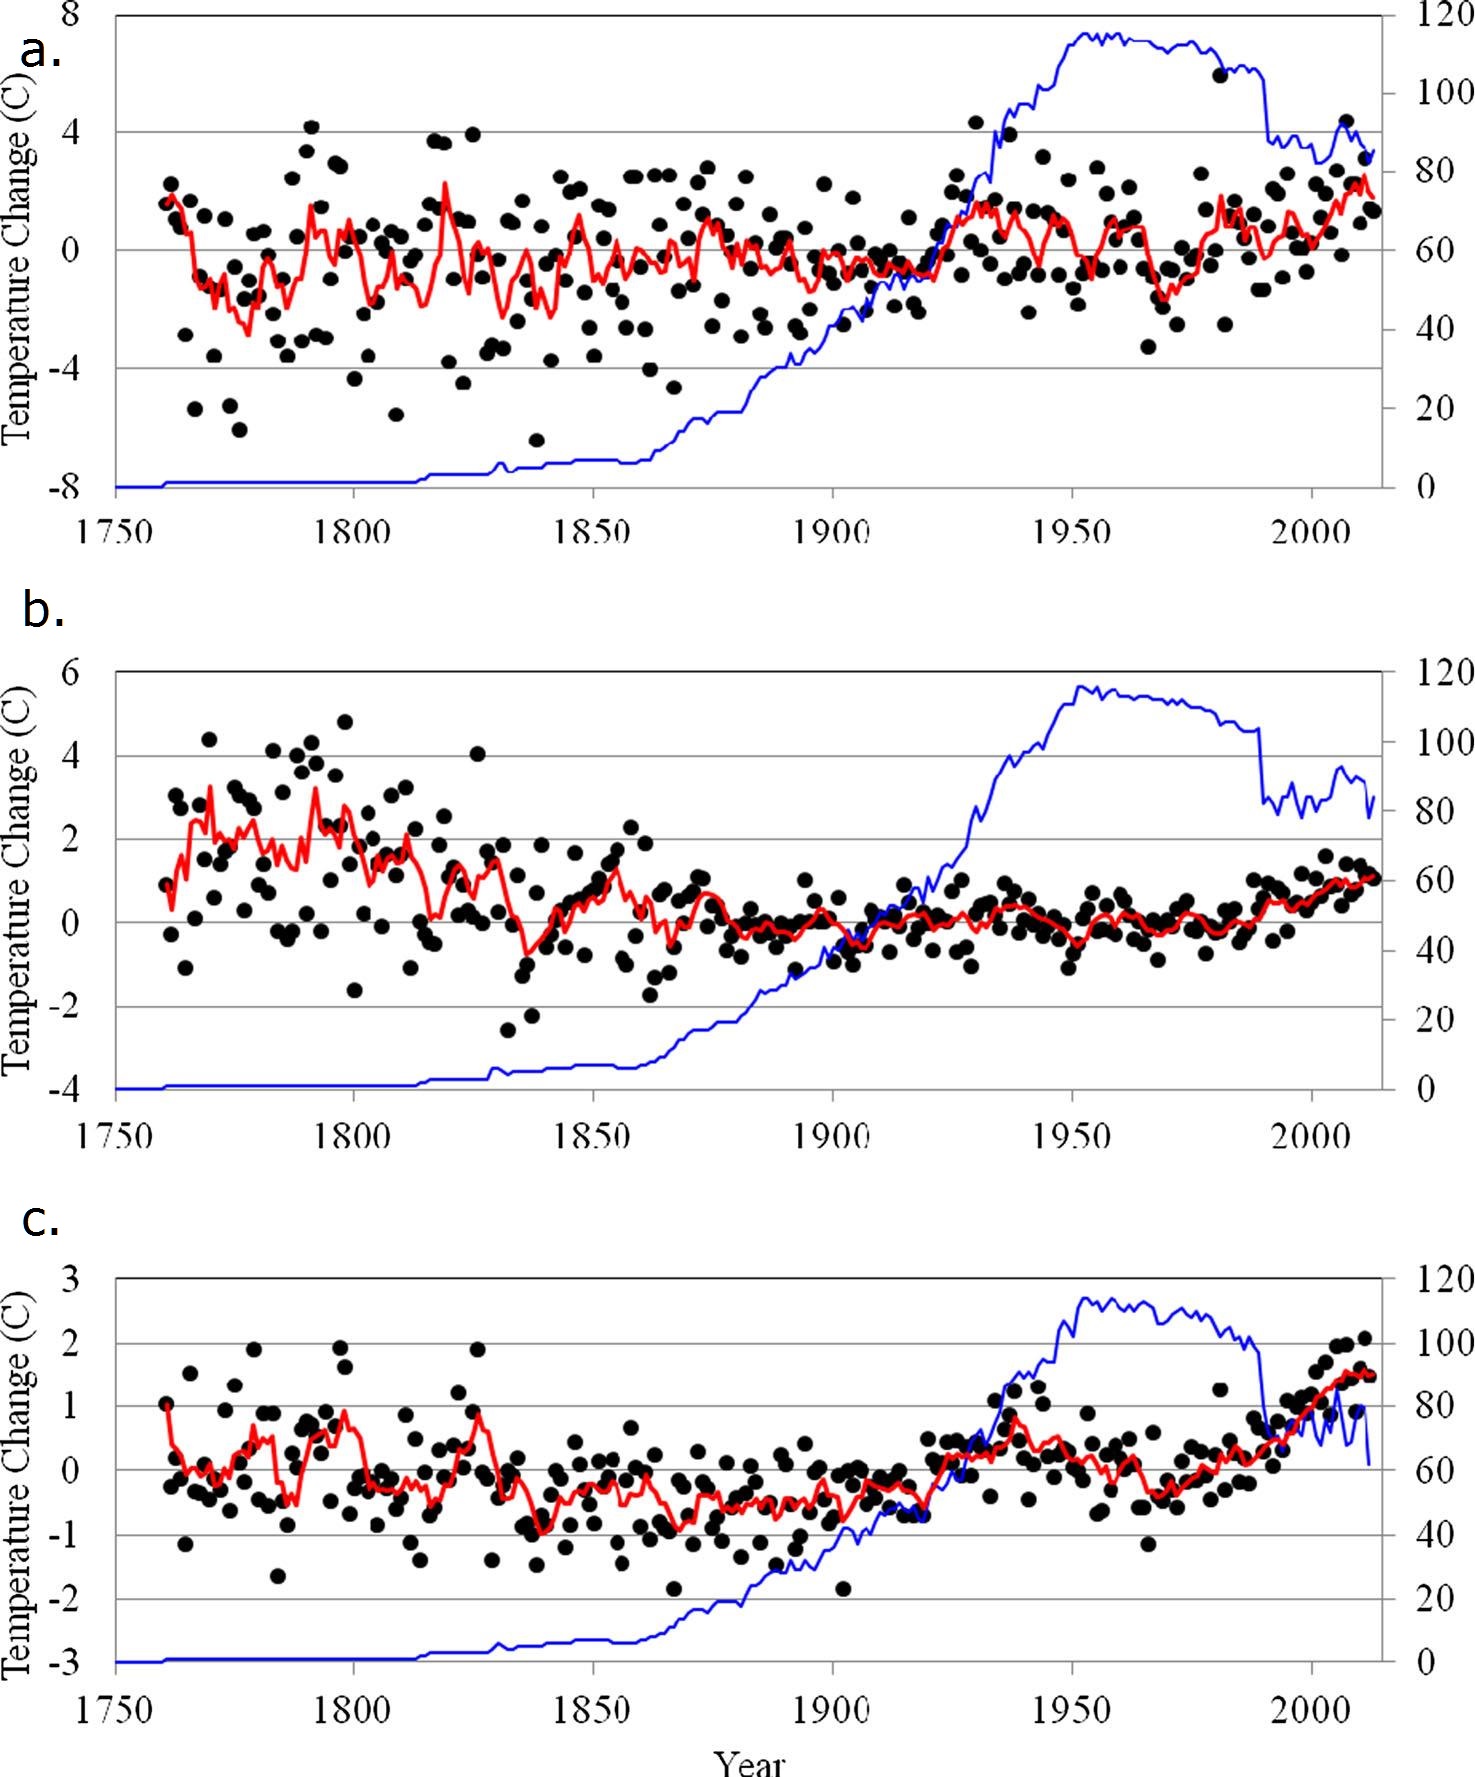
My curiosity piqued by Chiefio’s comment, I went looking for data to analyze to test his proposition. As it happens, Berkeley Earth provides data tables for monthly Tmax and Tmin by hemisphere (NH and SH), from land station records. Setting aside any concerns about adjustments or infilling I did the analysis taking the BEST data tables at face value. Since land surface temperatures are more variable than sea surface temps, it seems like a reasonable dataset to analyze for the mentioned patterns.

Tmax Records

NH and SH long-term trends are the same 0.07C/decade, and in both there was cooling before 1979 and above average warming since. However, since 1950 NH warmed more strongly, and mostly prior to 1998, while SH has warmed strongly since 1998. (Trends below are in C/yr.)

 Tmax Trends NH Tmax SH Tmax
All years 0.007 0.007
1998-2013 0.018 0.030
1979-1998 0.029 0.017
1950-1979 -0.003 -0.003
1950-2013 0.020 0.014

Summer Comparisons:

NH summer months are June, July, August, (6-8) and SH summer is December, January, February (12-2). The trends for each of those months were computed and the annual trends subtracted to show if summer months were warming more than the rest of the year (Trends below are in C/yr.).

Month less Annual NH
Tmax
NH Tmax NH Tmax SH Tmax SH Tmax SH Tmax
Summer Trends

6

7 8 12 1

2

All years -0.002 -0.004 -0.004 0.000 0.003 0.002
1998-2013 0.026 0.002 0.006 0.022 0.004 -0.029
1979-1998 0.003 -0.004 -0.003 -0.014 -0.029 0.001
1950-1979 -0.002 -0.002 -0.005 0.004 0.005 -0.005
1950-2013 -0.002 -0.003 -0.002 -0.002 -0.002 -0.002

NH summer months are cooler than average overall and since 1950. Warming does appear since 1998 with a large anomaly in June and also warming in August.SH shows no strong pattern of Tmax warming in summer months. A hot December trend since 1998 is offset by a cold February. Overall SH summers are just above average, and since 1950 have been slightly cooler.

Tmin Records

Both NH and SH show Tmin rising 0.12C/decade, much more strongly warming than Tmax. SH show that average warming persisting throughout the record, slightly higher prior to 1979. NH Tmin is more variable, showing a large jump 1979-1998, a rate of 0.25 C/decade (Trends below are in C/yr.).

 Trends NH Tmin SH Tmin
All years 0.012 0.012
1998-2013 0.010 0.010
1979-1998 0.025 0.011
1950-1979 0.006 0.014
1950-2013 0.022 0.014

Winter Comparisons:

SH winter months are June, July, August, (6-8) and NH winter is December, January, February (12-2). The trends for each of those months were computed and the annual trends subtracted to show if winter months were warming more than the rest of the year (Trends below are in C/yr.).

Month less Annual NH Tmin NH Tmin NH Tmin SH Tmin SH Tmin SH Tmin
Winter Trends

12

1 2 6 7

8

All years 0.007 0.008 0.007 0.005 0.003 0.004
1998-2013 -0.045 -0.035 -0.076 -0.043 -0.024 -0.019
1979-1998 -0.018 -0.005 0.024 0.034 0.008 -0.008
1950-1979 0.008 0.005 0.007 0.008 0.012 0.013
1950-2013 0.001 0.007 0.008 -0.001 -0.002 0.002

NH winter Tmin warming is stronger than SH Tmin trends, but shows quite strong cooling since 1998. An anomalously warm February is the exception in the period 1979-1998.Both NH and SH show higher Tmin warming in winter months, with some irregularities. Most of the SH Tmin warming was before 1979, with strong cooling since 1998. June was anomalously warming in the period 1979 to 1998.

Summary

Tmin did trend higher in winter months but not consistently. Mostly winter Tmin warmed 1950 to 1979, and was much cooler than other months since 1998.

Tmax has not warmed in summer more than in other months, with the exception of two anomalous months since 1998: NH June and SH December.

Conclusion:

I find no convincing pattern of summer Tmax warming carrying over into winter Tmin warming. In other words, summers are not adding warming more than other seasons. There is no support for concerns over summer heat waves increasing as a pattern.

It is interesting to note that the plateau in temperatures since the 1998 El Nino is matched by winter months cooler than average during that period, leading to my discovering the real reason for lack of warming recently.

The Real Reason for the Pause in Global Warming

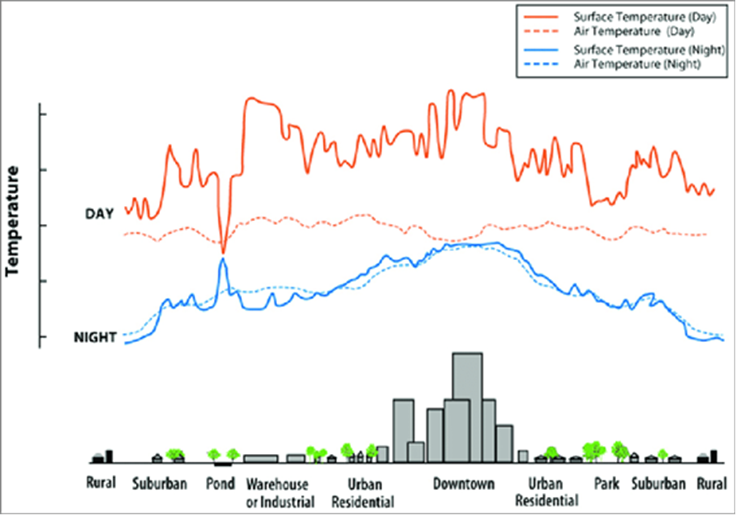
These data suggest warming trends are coming from less cold overnight temperatures as measured at land weather stations. Since stations exposed to urban heat sources typically show higher minimums overnight and in winter months, this pattern is likely an artifact of human settlement activity rather than CO2 from fossil fuels.

Thus the Pause (more correctly the Plateau) in global warming is caused by end of the century completion of urbanization around most surface stations. With no additional warming from additional urban heat sources, temperatures have remained flat for more than 15 years.


Data is here:
http://berkeleyearth.lbl.gov/regions/northern-hemisphere
http://berkeleyearth.lbl.gov/regions/southern-hemisphere

Auditing the Abuse of Temperature Records

What I don’t get is the disrespect of the adjusters for the reality of micro climates. BEST acknowledges that >30% of US records show a cooling trend over the last 100 years. Why can’t reported cooling be true?

I did a 2013 study of the CRN top rated US surface stations. Most remarkable about them is the extensive local climate diversity that appears when station sites are relatively free of urban heat sources. 35% (8 of 23) of the stations reported cooling over the century. Indeed, if we remove the 8 warmest records, the rate flips from +0.16°C to -0.14°C. In order to respect the intrinsic quality of temperatures, I calculated monthly slopes for each station, and combined them for station trends.

Recently I updated that study with 2014 data and compared adusted to unadjusted records. The analysis shows the effect of GHCN adjustments on each of the 23 stations in the sample. The average station was warmed by +0.58 C/Century, from +.18 to +.76, comparing adjusted to unadjusted records. 19 station records were warmed, 6 of them by more than +1 C/century. 4 stations were cooled, most of the total cooling coming at one station, Tallahassee.  So for this set of stations, the chance of adjustments producing warming is 19/23 or 83%.

In the Quest for the mythical GMST, these records have to be homogenized, and also weighted for grid coverage, resulting in cooling being removed as counter to the overall trend.

The pairwise homogenization technique assumes that two local climates move in tandem. Thus, if one of them diverges, it must be adjusted back in line.  But I question that premise. It’s obvious that a mountaintop site will typically show lower temps than a nearby sea level site. But it is wrong to assume that changes at one should be consistent with changes in the other. Not only are the absolute readings different, the patterns of changes are also different. Infilling does violence to the local climate realities. It is perfectly normal that one place can have a cooling trend at the same time another place is warming.

Weather stations measure the temperature of air in thermal contact with the underlying terrain. Each site has a different terrain, and for a host of landscape features documented by Pielke Sr., the temperature patterns will differ, even in nearby locations. However, if we have station histories (and we do), then trends from different stations can be compared to see similarities and differences..

In summary, temperatures from different stations should not be interchanged or averaged, since they come from different physical realities. The trends can be compiled to tell us about the direction, extent and scope of temperature changes.

What Paul Homewood, Steven Goddard, Booker and others are doing is a well-respected procedure in financial accounting. The Auditors must determine if the aggregate corporation reports are truly representative of the company’s financial condition. In order to test that, samples of component operations are selected and examined to see if the reported results are accurate compared to the facts on the ground.

Discrepancies such as those we’ve seen from NCDC call into question the validity of the entire situation as reported. The stakeholders must be informed that the numbers presented are misrepresenting the reality. The Auditor must say of NCDC something like: “We are of the opinion that NCDC statements of global surface temperatures do not give a true and fair view of the actual climate reported in all of the sites measured.”

The several GHCN samples analyzed so far show that older temperatures have been altered so that the figures are lower than the originals. In some cases, more recent temperatures have been altered to become higher than the originals. Alternatively, recent years of observations are simply deleted. The result is a spurious warming trend of 1-2F, the same magnitude as the claimed warming from rising CO2. How is this acceptable public accountability? More like “creative accounting.” Once a researcher believes that rising CO2 causes rising temperatures, and since CO2 keeps rising, then temperatures must continue to rise, cooling is not an option. In fact 2015 dare not be cooler than 2014.

We are learning from this that GHCN only supports the notion of global warming if you assume that older thermometers ran hot and today’s thermometers run cold. Otherwise the warming does not appear in the original records; they have to be processed, like tree proxies. Not only is the heat hiding in the oceans, even thermometers are hiding some.

Once you accept that facts and figures in the historical record are changeable, then you enter Alice’s Wonderland, or the Soviet Union, where it was said: “The future is certain; only the past keeps changing.” The apologists for NCDC confuse data and analysis. The temperature readings are facts, unchangeable. If someone wants to draw comparisons and interpret similarities and differences, that’s their analysis, and they must make their case from the data to their conclusions. Usually, when people change the record itself it’s because their case is weak.

My submission to the International Temperature Data Review project has gone to the panel.

https://rclutz.wordpress.com/2015/04/26/temperature-data-review-project-my-submission/