
June 21 E.M. Smith made an intriguing comment on the occasion of Summer Solstice (NH) and Winter Solstice (SH):
“This is the time when the sun stops the apparent drift in the sky toward one pole, reverses, and heads toward the other. For about 2 more months, temperatures lag this change of trend. That is the total heat storage capacity of the planet. Heat is not stored beyond that point and there can not be any persistent warming as long as winter brings a return to cold.
I’d actually assert that there are only two measurements needed to show the existence or absence of global warming. Highs in the hottest month must get hotter and lows in the coldest month must get warmer. BOTH must happen, and no other months matter as they are just transitional.
I’m also pretty sure that the comparison of dates of peaks between locations could also be interesting. If one hemisphere is having a drift to, say, longer springs while the other is having longer falls, that’s more orbital mechanics than CO2 driven and ought to be reflected in different temperature trends / rates of drift.”
https://chiefio.wordpress.com/2015/06/21/summer-solstice-is-here/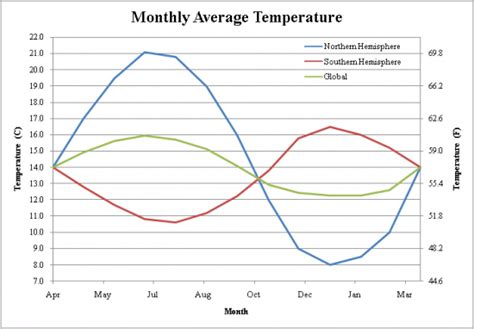
Notice that the global temperature tracks with the seasons of the NH. The reason for this is simple. The NH has twice as much land as the Southern Hemisphere (SH). Oceans have greater heat capacity and do not change temperatures as much as land does. So every year when there is almost a 4 °C swing in the temperature of the Earth, it follows the seasons of the NH. This is especially interesting because the Earth gets the most energy from the sun in January right now. That is because of the orbit of the Earth. The perihelion is when the Earth is closest to the sun and that currently takes place in January.
http://theinconvenientskeptic.com/2010/10/how-the-northern-hemisphere-drives-the-modern-climate/
Observations and Analysis:
My curiosity piqued by Chiefio’s comment, I went looking for data to analyze to test his proposition. As it happens, Berkeley Earth provides data tables for monthly Tmax and Tmin by hemisphere (NH and SH), from land station records. Setting aside any concerns about adjustments or infilling I did the analysis taking the BEST data tables at face value. Since land surface temperatures are more variable than sea surface temps, it seems like a reasonable dataset to analyze for the mentioned patterns.

Tmax Records
NH and SH long-term trends are the same 0.07C/decade, and in both there was cooling before 1979 and above average warming since. However, since 1950 NH warmed more strongly, and mostly prior to 1998, while SH has warmed strongly since 1998. (Trends below are in C/yr.)
| Tmax Trends | NH Tmax | SH Tmax |
| All years | 0.007 | 0.007 |
| 1998-2013 | 0.018 | 0.030 |
| 1979-1998 | 0.029 | 0.017 |
| 1950-1979 | -0.003 | -0.003 |
| 1950-2013 | 0.020 | 0.014 |
Summer Comparisons:
NH summer months are June, July, August, (6-8) and SH summer is December, January, February (12-2). The trends for each of those months were computed and the annual trends subtracted to show if summer months were warming more than the rest of the year (Trends below are in C/yr.).
| Month less Annual | NH Tmax |
NH Tmax | NH Tmax | SH Tmax | SH Tmax | SH Tmax |
| Summer Trends |
6 |
7 | 8 | 12 | 1 |
2 |
| All years | -0.002 | -0.004 | -0.004 | 0.000 | 0.003 | 0.002 |
| 1998-2013 | 0.026 | 0.002 | 0.006 | 0.022 | 0.004 | -0.029 |
| 1979-1998 | 0.003 | -0.004 | -0.003 | -0.014 | -0.029 | 0.001 |
| 1950-1979 | -0.002 | -0.002 | -0.005 | 0.004 | 0.005 | -0.005 |
| 1950-2013 | -0.002 | -0.003 | -0.002 | -0.002 | -0.002 | -0.002 |
NH summer months are cooler than average overall and since 1950. Warming does appear since 1998 with a large anomaly in June and also warming in August.SH shows no strong pattern of Tmax warming in summer months. A hot December trend since 1998 is offset by a cold February. Overall SH summers are just above average, and since 1950 have been slightly cooler.
Tmin Records
Both NH and SH show Tmin rising 0.12C/decade, much more strongly warming than Tmax. SH show that average warming persisting throughout the record, slightly higher prior to 1979. NH Tmin is more variable, showing a large jump 1979-1998, a rate of 0.25 C/decade (Trends below are in C/yr.).
| Trends | NH Tmin | SH Tmin |
| All years | 0.012 | 0.012 |
| 1998-2013 | 0.010 | 0.010 |
| 1979-1998 | 0.025 | 0.011 |
| 1950-1979 | 0.006 | 0.014 |
| 1950-2013 | 0.022 | 0.014 |
Winter Comparisons:
SH winter months are June, July, August, (6-8) and NH winter is December, January, February (12-2). The trends for each of those months were computed and the annual trends subtracted to show if winter months were warming more than the rest of the year (Trends below are in C/yr.).
| Month less Annual | NH Tmin | NH Tmin | NH Tmin | SH Tmin | SH Tmin | SH Tmin |
| Winter Trends |
12 |
1 | 2 | 6 | 7 |
8 |
| All years | 0.007 | 0.008 | 0.007 | 0.005 | 0.003 | 0.004 |
| 1998-2013 | -0.045 | -0.035 | -0.076 | -0.043 | -0.024 | -0.019 |
| 1979-1998 | -0.018 | -0.005 | 0.024 | 0.034 | 0.008 | -0.008 |
| 1950-1979 | 0.008 | 0.005 | 0.007 | 0.008 | 0.012 | 0.013 |
| 1950-2013 | 0.001 | 0.007 | 0.008 | -0.001 | -0.002 | 0.002 |
NH winter Tmin warming is stronger than SH Tmin trends, but shows quite strong cooling since 1998. An anomalously warm February is the exception in the period 1979-1998.Both NH and SH show higher Tmin warming in winter months, with some irregularities. Most of the SH Tmin warming was before 1979, with strong cooling since 1998. June was anomalously warming in the period 1979 to 1998.
Summary
Tmin did trend higher in winter months but not consistently. Mostly winter Tmin warmed 1950 to 1979, and was much cooler than other months since 1998.
Tmax has not warmed in summer more than in other months, with the exception of two anomalous months since 1998: NH June and SH December.
Conclusion:
I find no convincing pattern of summer Tmax warming carrying over into winter Tmin warming. In other words, summers are not adding warming more than other seasons. There is no support for concerns over summer heat waves increasing as a pattern.
It is interesting to note that the plateau in temperatures since the 1998 El Nino is matched by winter months cooler than average during that period, leading to my discovering the real reason for lack of warming recently.
The Real Reason for the Pause in Global Warming
These data suggest warming trends are coming from less cold overnight temperatures as measured at land weather stations. Since stations exposed to urban heat sources typically show higher minimums overnight and in winter months, this pattern is likely an artifact of human settlement activity rather than CO2 from fossil fuels.
Thus the Pause (more correctly the Plateau) in global warming is caused by end of the century completion of urbanization around most surface stations. With no additional warming from additional urban heat sources, temperatures have remained flat for more than 15 years.

Data is here:
http://berkeleyearth.lbl.gov/regions/northern-hemisphere
http://berkeleyearth.lbl.gov/regions/southern-hemisphere

Ron Clutz, my compliments to you for taking the initiative to delve into that BEST data and showing this amazing fact that there is no real global warming of any concern and I know your analysis is correct. You most likely just measured the UHI influence, warmer nights, slightly cooler days. I know you are correct because I also delved into the BEST data a couple of years ago but from a completely different direction, but I like your approach better, way to go.
I took the hard way and first wrote a program (in C/C++ intentionally for easy compiling across all machines, all have a C/C++ compiler) that first collapsed the some 18 gigabytes of BEST ascii data down to a fast and more manageable 600 megabytes of binary for analysis. If you should need such a program for any deeper analysis I will freely give it, no strings, for scientific use, you can call it your own. With that you can analyse the entire database, all entries, in seconds, not an hour since many machines do not have 20 gigabytes of addressable physical memory.
I will also guess that if you would do your own analysis using the some 150+ flags in the BEST database you will find that by excluding all but the actual measurements your analysis will show even less nighttime trend but some will always remain, it is real and it is the UHI influence. Looks like Watts would jump all over that being what he has been emphasizing too. You will find the opposite response and I will be amazed if that is not what hppens to you also.
The sad part is that my analysis showed much the same pattern from completely a different direction and my attempt to get it recognized and picked up on wuwt was totally shunned, in fact, I then began to get harsh responses to anything I would comment there from that time forward by the principle characters there and I then I finally knew what kind of site wuwt really is. I hope you better luck in getting this information spread to the widespread public and those in science that will listen but my guess is that wuwt is not the site that will allow that with its heavy traffic and you too will be shunned. Maybe E.M. who seems a kind and open person will give you a wider exposure.
Oh wait… I failed to read your last paragraphs before writing this, you do already realize that this is the UHI influence… sorry, please ignore that laced within my comment, I simply don’t have the time to completely rewrite and reword this one right now.
LikeLiked by 2 people
Thanks for commenting Wayne. It is good to know you independently reached a similar conclusion. I am limited to my notebook computer and spreadsheet skills. So I will pass on your offer of a powerful software beyond my capacities.
The main advantage of my approach is that spreadsheets are utterly transparent, no black box process allowed.
BTW E.M. Smith just responded with a “nicely done”.
LikeLiked by 1 person
Nicely done.
Glad I could inspire a “Dig Here!” moment. 🙂
LikeLiked by 1 person
Thank you!!! Very nicely done!
LikeLike
Very interesting and looking forward to it getting the airplay and serious (non-political, Non Ad Hom) critic it deserves. Thanks to NALOPKT for pointing this out.
LikeLike
Although in full agreement: nicely done; a bit reservation remain. Completion of urbanization as possible reason for a pause in global warming (Conclusion), is presumably excluding too many facets of steering regional and global air temperatures. For example: In Northern Europe it seems evident that air and water temperature increased more than elsewhere in recent decades. A logical assumption brings ocean use in coastal waters, but particularly in the North- and Baltic Sea, into play, which is addressed at, http://climate-ocean.com/2015/K-m2.html and prepared for a ppt-presentation in a few days’ time: http://climate-ocean.com/2015/K-Lo.html
titled: “Offshore Wind-parks and mild Winters. Contribution from Ships, Fishery, Wind parks etc “, concluding:
__” The facts are conclusive. “Global Climate Change” cannot cause a special rise in temperatures in Northern Europe, neither in the North Sea nor the Baltic or beyond. Any use of the oceans by mankind has an influence on thermo-haline structures within the water column from a few cm to 10m and more. Noticeable warmer winters in Europe are the logical consequence.”
LikeLike
Arnd, thanks for the comment. The way I see it, urbanization during the last half of the 20th century added a monotonic warming signal into the land station record, on top of the natural variability that is driven by the oceans. People confused that signal with the monotonic rise in CO2 concentrations. Of course, as you are pointing out, the oceans are continuing to change the climates in various regions on multi-decadal scales, while the urbanization process of warming is depleted.
LikeLike
Speaking of BEST, you might want to look at what Frank Lansner has to say. Frank went to the effort of getting the actual raw data. He has the original notebooks in some cases.
The Original Temperatures Project
In other words the data set you are looking at is not only an adjusted data set, but it is a data set that reflects ocean temperatures and not actual land temperatures.
Frank’s comment @
http://wattsupwiththat.com/2014/01/06/the-original-temperatures-project/#comment-1526732
is well worth reading especially since Karl added adjustments “…to as high as 2C [time of observations in Karl and Williams (1987)]…”
MORE: http://www.hidethedecline.eu/
LikeLike
Thanks Gail. I also have issues with BEST. I also think they are in denial about UHI.
But for this analysis, their dataset, warts and all, shows that the warming is driven by Tmin rising, and that the Tmin stopped warming coincident with the plateau.
LikeLike
Ron,
As I said over at Stevengoddard’s I would really like to see you and Frank put both ideas together and look at Tmin/Tmax summer/winter for the ocean affected temperature data vs the inland sheltered (LAND) data.
Since the oceans warm more based on the higher wavelengths of sunshine:
And since we just went through a Solar Grand Maximum, I think the data would help prove the sun and not CO2 was the cause of the recent warming. Also data seems to show the earth’s temperature lags solar activity by ~ 15 years. That also maybe visible in the data. The inland sheltered data would show cooling much sooner than the ocean affected data.
Selected European inland sheltered temperatures show no warming ” from around 1940.”
LikeLike
Reblogged this on JunkScience.com.
LikeLike
Some interesting work. The effect of urban stations creating higher minimums, especially overnight is an important dimension and needs further investigation. What I have seen in the Canadian data is completely in line with this, i.e. the urban centres show warming on average that can be attributed entirely to their daily minimums being higher. The more urbanized the station in question, the greater the effect. However, there is no sign of higher daily maximums. In fact, the trend, if any could be downward.
LikeLike
Thanks David. I was first alerted to this years ago by J. Richard Wakefield who did studies of Ontario stations that clearly showed long term trends of Tmax declining while Tmin increased strongly, resulting in a warming trend. In fact, extreme temperatures, both hot and cold are less frequent now.
Wakefield’s work can be accessed here: https://cdnsurfacetemps.wordpress.com/videos/
(It says “videos” but the link goes to downloadable papers.)
LikeLike
Is it ironic that the minimum global average monthly temperature occurs when the Earth gets the most energy from the sun in January: during the time of the perihelion [when the earth id closest to the sun]; and conversely the maximum global average monthly temperature occurs when the Earth gets the least energy from the sun in July: during the time of the aphelion [when the earth is furthest to the sun]?
In any way, I am not sure if it is wise to talk about such small temperature variations based on data collected from a very small number of weather stations [which monitor air temperatures, and not surface temperatures] located only in about 30% of the area of our planet: In my opinion, the accuracy of the data most likely is about + /- a tenth of a degree [Celsius]; however the warming trends are expressed in hundredths of a degree [Celsius] per year or in tenths of a degree per decade.
It is not clear what is the implication of the statement “Oceans do not change temperatures in the same manner that land does”: does it mean that ocean temperatures fluctuate less than surface temperatures? It is noted that oceans by default tend to cool down by evaporative cooling, and I surely neither fully know nor fully understand how to analyze the thermal balance ensuing by the warming-up of the oceans by the incoming solar radiation and cooling due to evaporation as well as radiation being emitted by the water.
LikeLike
Thanks Ben. I think the point about the oceans is the huge heat capacity of the water compared to the air. So ocean temperatures are much slower to react to changes in solar energy, such as those caused by changes in the LOD (length of day). See this post for more: https://rclutz.wordpress.com/2015/04/21/the-climate-water-wheel/
LikeLike
Me three. Have observed the same thing in stations from 49 N (Grand Forks, BC) to 82 North (Alert, Nunavit). Could be many things from clouds, to GHG, to the bipolar earth to …. Not sure how much UHI there is in Alert and Eureka and many other fairly rural sites I looked at but the same affect is there.
Example: https://www.dropbox.com/s/97o461le8n5v78e/AlertJanTrend.tiff?dl=0
LikeLike
Hi Wayne, I know you are on top of this. As you also know, attempts to get at UHI by classifying stations as “rural” or “urban” do not get at the issue. Antarctica is not urban, but there tend to be human settlements where the thermometers are. It’s the growth of the surrounding settlement that adds warming into the record. As we have gotten smarter about siting weather stations, the records lose this source of warming, resulting in a plateau.
LikeLike
Reblogged this on Climate Collections and commented:
Ron Clutz provides a good analysis of Tmax and Tmin using BEST data. Consistent with “traditional” pre-CAGW meteorological thought.
Clutz’s study reminds me of the correct way to do a university homework assignment which I didn’t get right the first time. My prof (Leonard O. Myrup) critiqued my work and suggested I get smart on his 1969 paper on numerically modeling UHI (http://journals.ametsoc.org/doi/abs/10.1175/1520-0450%281969%29008%3C0908%3AANMOTU%3E2.0.CO%3B2).
At the time we were concerned about the coming Ice Age, and my answer to the assigned work understated the cooling trend through the late 1970s because I had used mostly urban stations in my analysis.
At the time ca. 1980, CO2 was dismissed as a meaningful contributor to the long-term planetary energy budget by each and every prof I had in the Atmos Sci and Physics departments. They had better and real things to research.
LikeLike
Cool. :-). Thanks for the historical context, and the reminder that some of us have been through more than one climate scare.
LikeLike
Reblogged this on Centinel2012 and commented:
There is no doubt there is a pause but there could be other reason like the AMO.
LikeLike
Could be lots of reasons, but the plateau of Tmin, and especially in wintertime begs to be explained.
LikeLike
Reblogged this on 4timesayear's Blog.
LikeLike