It’s official–This leap year February is complete and we can now look at the annual Arctic Ice Extent situation at day 60 with two months in the books.
The Resurgence of Arctic ice is continuing in MASIE, the most accurate dataset, but in SII, the remote sensing dataset, not so much.
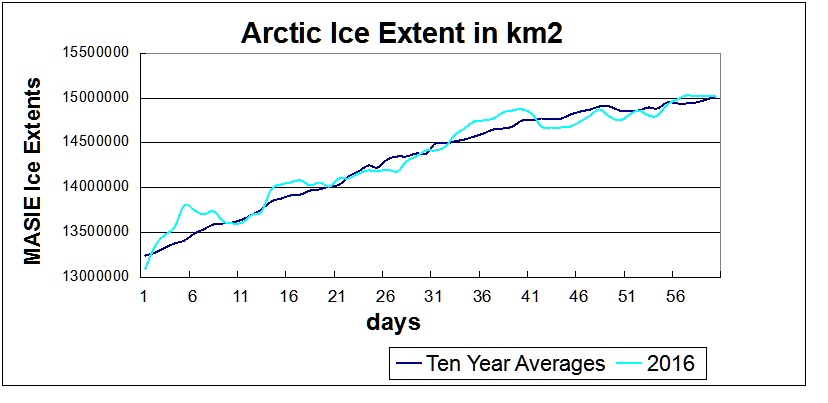
The MASIE graph shows an extent matching the ten-year average. At 15.02 M km2, 2016 exceeds 2015 annual maximum of 14.91 recorded on day 62, and this year’s peak ice may well go higher.
This table shows comparisons between MASIE and SII
| Months | MASIE 2016 |
SII 2016 |
MASIE 2016-2015 |
SII 2016-2015 |
SII – MASIE |
| Jan | 13.922 | 13.472 | -0.019 | -0.131 | -0.450 |
| Feb | 14.804 | 14.210 | 0.121 | -0.199 | -0.593 |
It is readily shown that SII is severely underestimating this year’s growth of ice compared both to SII 2015 and to MASIE. A monthly differential of nearly 600k km2 has opened up due to SII showing a large decline while MASIE shows a gain compared to last year.
Below is a comparison from MASIE regarding the NH seas comprising the NH statistics.
| Ice Extents | Ice Extent | ||
| Region | 2015060 | 2016060 | km2 Diff. |
| (0) Northern_Hemisphere | 14856201 | 15018131 | 161930 |
| (1) Beaufort_Sea | 1070445 | 1070445 | 0 |
| (2) Chukchi_Sea | 966006 | 965989 | -17 |
| (3) East_Siberian_Sea | 1087137 | 1087120 | -17 |
| (4) Laptev_Sea | 897845 | 897809 | -36 |
| (5) Kara_Sea | 935023 | 933890 | -1133 |
| (6) Barents_Sea | 701064 | 529545 | -171519 |
| (7) Greenland_Sea | 677415 | 582658 | -94757 |
| (8) Baffin_Bay_Gulf_of_St._Lawrence | 1828321 | 1588399 | -239922 |
| (9) Canadian_Archipelago | 853214 | 853178 | -36 |
| (10) Hudson_Bay | 1260903 | 1260854 | -49 |
| (11) Central_Arctic | 3246891 | 3208216 | -38675 |
| (12) Bering_Sea | 508062 | 623647 | 115585 |
| (13) Baltic_Sea | 22187 | 86770 | 64583 |
| (14) Sea_of_Okhotsk | 768839 | 1308697 | 539858 |
| (15) Yellow_Sea | 0 | 14137 | 14137 |
| (16) Cook_Inlet | 5303 | 3505 | -1798 |
In the table 2016 shows two seas on the Atlantic side lower than this date last year, Barents and Greenland Seas, while the Baltic is much higher, though a smaller size sea. Barents had grown to almost 600k km2 by day 20, then lost 150k up to day 55, but has now regained half of that loss.
Baffin Bay is down some, but not a large %, while CAA is the same extent.
On the Pacific side, Okhotsk which was the lowest in the last 10 years in 2015 has much more ice now, nearly the highest in 10 years. Bering is also up, so it may be a case of “Goodbye Blob, Hello Normal.”
So is the Winter ending and stopping the ice growth?
Here is my local observation:
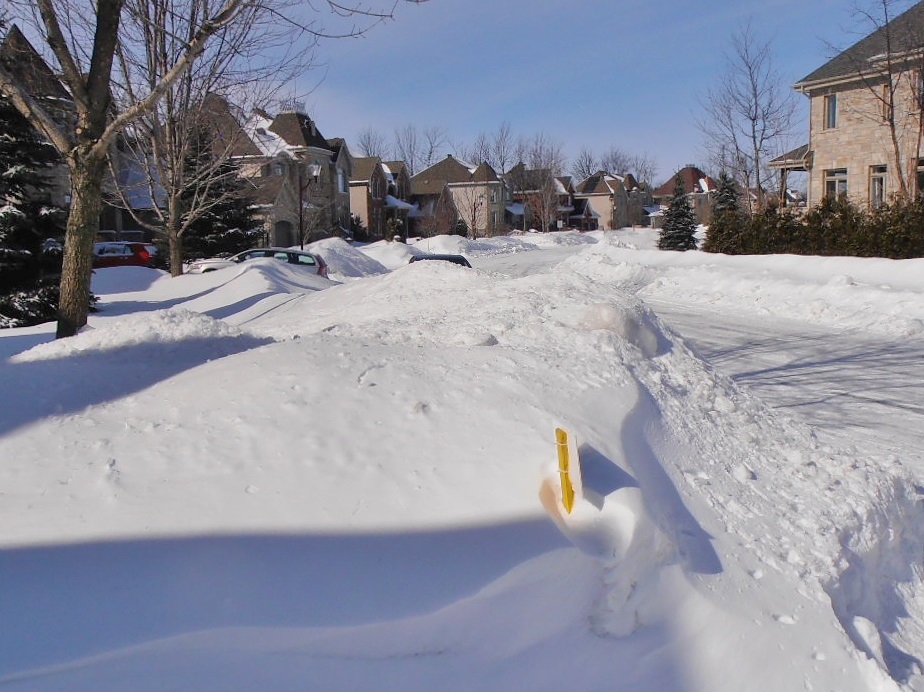
Montreal Suburb Street on March 1, 2016
That’s the snowpack on our street seen from my driveway. And I went cross-country skiing today, an activity normally precluded in March by lack of snow cover and temperatures above freezing. With fresh snowfall last night and -13C this morning, it was one of the best days this season. With a blizzard warning and more snow expected tonight, I’m likely to be back out later this week.
So the report from here: The Siberian Express is on time and going strong.
What’s happening with Arctic ice?
It depends on whose measurements you look at. Before you decide, make sure you have read NOAA is Losing Arctic Ice.

Reblogged this on TheFlippinTruth.
LikeLike
Reblogged this on Climatism and commented:
97% of all Climate experts and global warming sympathetic MSM media told us the exact opposite should be occurring.
The Arctic ice scam – yet another dud prediction.
LikeLike