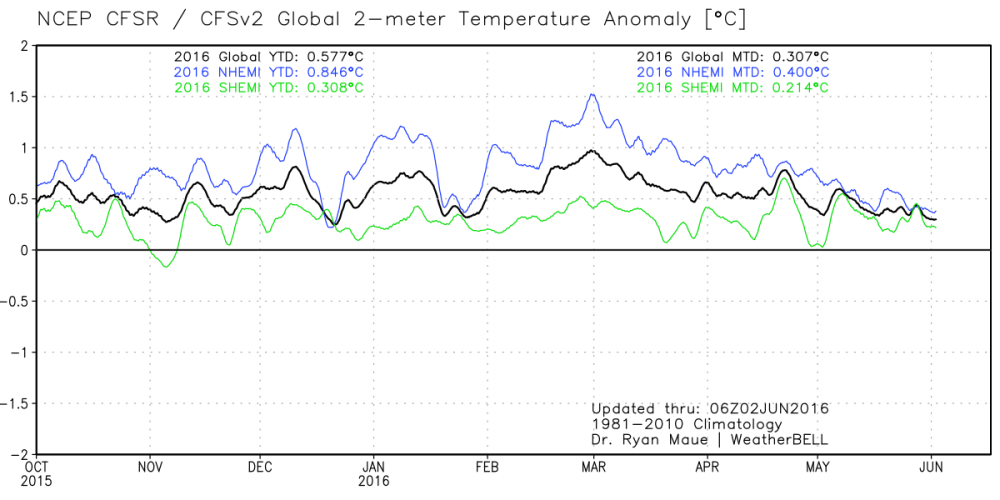
 Here is a great view of how the 2015-16 El Nino caused higher surface temperatures last year and this, displayed in 2-meter temp anomalies (weather station height). The satellites’ data show the uptick began in earnest October 2015 and returned to neutral in May 2016. SSTs are now firmly in neutral.
h/t Joe Bastardi
Summary
The temperature variations portrayed above were 100% Natural, no additives were involved. Keep your popcorn handy as we await temperature measurements for the second half of 2016.
Source: Weatherbell

Reblogged this on TheFlippinTruth.
LikeLike