
In a legal proceeding, a witness can only testify to what he or she personally experienced. Anything reported to them by others is dismissed as “hearsay”, not evidence by direct observation, but rather an opinion offered by someone else.
In the current public commotion over global warming, almost all the discourse is composed of hearsay. Ross McKitrick explains that the alleged changes in temperatures are so small that no one can possibly notice. Thus, their concern over global warming can only come from repeating hearsay in the form of charts and graphs published by people with an axe to grind. His article in the Financial Post is Hold the panic: Canada just warmed 1.7 degrees and … thrived. Excerpts below in italics with my bolds.
A recent report, commissioned by Environment and Climate Change Canada (also known as the federal Department of the Environment), sparked a feverish bout of media coverage. Much of it keyed off the headline statement that Canada warmed “twice as fast” as the entire planet since 1948. If that is self-evidently a bad thing, what to make of the finding that the Canada’s Atlantic region warmed twice as fast as the Prairies? Or that Canadian winters warmed twice as fast as summers?
Saying Canada warmed twice as fast as the whole planet doesn’t prove anything
I’ll bet you didn’t know that the Maritimes warmed twice as fast as the Prairies. But now that I’ve told you, you might tell yourself it makes sense based on what you’ve seen or heard — that’s called confirmation bias. In fact, I was lying. It’s the other way around. The Prairies warmed almost three times faster than the Maritimes.
Would you have known either way? One of the psychological effects of a report like this, and the attendant media hype, is that it puts ideas in peoples’ heads. Tell everyone over and over that the climate is changing, and soon they will see proof of change everywhere. Rain, snow, wind, floods or dry spells; it will all seem to eerily confirm the theory, even though we have always had these things.
Most of what people are noticing, of course, are just natural weather events. Underneath, there are slow trends, both natural and (likely) human-caused. But they are small and hard to separate out without careful statistical analysis. A few years ago, climatologist Lennart Bengtsson remarked:
“The warming we have had over the last 100 years is so small that if we didn’t have meteorologists and climatologists to measure it we wouldn’t have noticed it at all.”
And so we get reports with charts and graphs to tell us about the changes we didn’t notice. Remember last summer when the media hyped a report from the Intergovernmental Panel on Climate Change warning that warming 1.5 degrees Celsius (compared to preindustrial times) was a disaster threshold we must avoid crossing at all costs? Now we learn that Canada warmed 1.7 degrees Celsius since 1948. Far from leaving the country a smoking ruin, we got wealthier and healthier, our population soared, and life improved by almost any measure of welfare you can imagine. If only every so-called catastrophe was like this.
We deal with lots of changes over time. Go back to Bengtsson’s thought experiment. Today’s 80-year-olds entered their teens in 1950. Ask them what changes they experienced over their lives and they will have plenty to say. Then ask if, where they live, the fall warmed more than spring did. Without peeking at the answer, most will have no idea. Yet, according to the federal government’s latest report, depending on the province, one likely warmed twice as fast as the other. Which one?
If you can’t tell without looking it up, that’s the point.
Alarming news headlines are always part of the ritual (though you’d have thought journalists would be a bit jaded by now, after all the hyperventilating Only-Ten-Years-Left blockbuster claims over the past 30 years). Saying Canada warmed twice as fast as the whole planet doesn’t prove anything. Pretty much any large country warmed faster than the global average, because countries are on land. Oceans cover 70 per cent of the Earth, and the way the system works, during a warming trend the land warms faster than the oceans. So the scary headline only confirms that we are on land.
The best antidote, if you find yourself alarmed by the press coverage, is to turn to chapter four of the Department of the Environment’s report and start reading. The section on the observed changes in 1948 is factual, data-focused and decidedly non-alarmist. But there are some points I would quibble about: 2016 was a strong El Niño year, so the end point of the data is artificially high.
Some of the report’s bright-red heat maps would probably look different if they stopped in, say, 2014. And most of the report’s comparisons start in 1948 to maximize data availability, but this boosts the warming rate compared to starting in the 1930s, which was a hot decade. When the authors talk about attributing changes to greenhouse gases versus natural variability, they don’t explain the deep uncertainties in such calculations. And they make projections about the century ahead without discussing how well — or how poorly — their models can long-term forecast.
If you want to learn about changes to the Canadian climate, read the report. But if you need to look at the report to know what changes you lived through, that tells you how much — or rather, how little — they mattered to you at the time.
Ross McKitrick is a professor of economics at the University of Guelph and senior fellow at the Fraser Institute.
Postscript: No one under 20 years old has experienced a trend of warming temperatures. Yet they are in the streets instead of classrooms demanding action (anything) to stop something they have never known. Think about it.
I’ve lived in Eastern NC, New Orleans, SW Michigan and Virginia, so if you ask me if it is warmer than it was x years ago, I could say yes or no. If you ask me about recently I have a picture of a dogwood in full bloom from 4/10/11. The same, larger, dogwood went to full bloom this year on 4/14. The portents say “Winter is coming.”
LikeLike
I hear you Bob. I have a seriously confused magnolia bush in the back yard,
LikeLike
Reblogged this on Tallbloke's Talkshop and commented:
As the forces of climate alarm degenerate ever further into synthetic hysteria and absurdity, Ross McKitrick tries to restore some perspective.
LikeLike
And succeeds very well.
LikeLike
Reblogged this on Climate Collections.
LikeLiked by 1 person
Thanks for posting … and love that postscript.
LikeLike
You have to distinguish the circulation in the atmosphere from the temperature at the equatorial Pacific. This is particularly true of periods of very low solar wind activity.
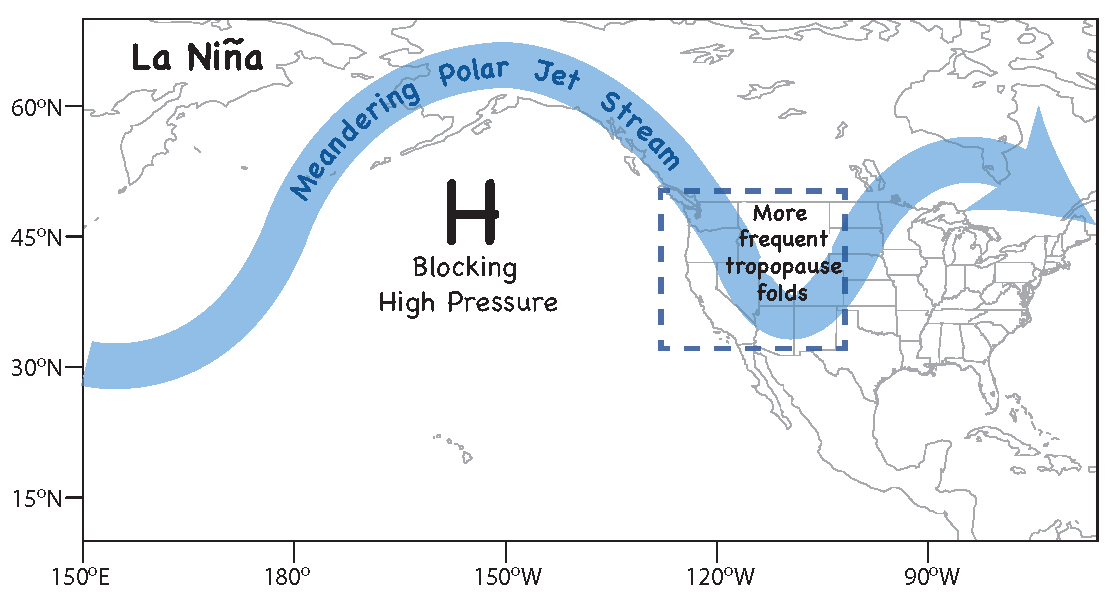
Researchers found that when the jet stream meanders over the western US, as occurs after a strong La Nia winter, more frequent high ozone days are expected at the western US surface in the following spring. Using lidar and balloon observations alongside a global chemistry-climate model, the researchers trace the cause of these poor air quality days to ozone plunging down to the ground from high in the upper atmosphere in dynamical events called “tropopause folds.” The tropopause is the boundary between the lowest layer of the atmosphere (the troposphere, from the surface to about 10-15 kilometers) and the ozone-rich stratosphere (which extends from the tropopause to about 50 kilometers high).
LikeLike
Geomagnetic cutoff rigidity shows the influence of the geomagnetic field on the circulation in the upper atmosphere.

http://sol.spacenvironment.net/raps_ops/current_files/Cutoff.html
The blockade of the high above the Pacific is due to the high temperature in the lower stratosphere over the Bering Strait.
LikeLike
Another one low it is already developing in the south west of the US.
https://www.tropicaltidbits.com/sat/satlooper.php?region=us&product=wv-mid
LikeLike
This means that the jet stream during periods of low solar activity is similar to the strong La Nina.
LikeLike
Thanks ren for showing images and explaining what they mean. You note a similarity between solar activity and strong La Nina but do not go as far as causation. Has anyone looked into that?
LikeLike
Look at the high-pressure system in the Northeast Pacific.

https://earth.nullschool.net/#2019/04/22/1800Z/wind/isobaric/500hPa/overlay=mean_sea_level_pressure/orthographic=-119.04,28.31,448/loc=-135.754,34.885
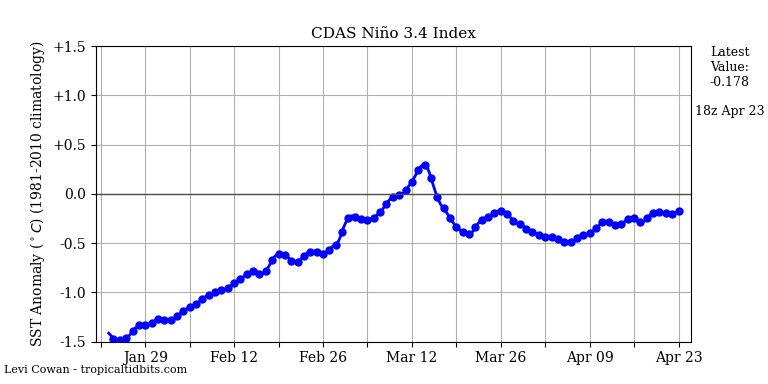
See also the temperature in the area of El Nino 3,4.
The jetstream in the North Pacific does not respond to the high temperature of the equatorial Pacific. A similar jetstream occurred in the winter months.
LikeLike
Such a circulation can lead to a great flood on the Mississippi River, when the snow melts in the north of the US.
LikeLike
Drier weather will gradually filter into the southern Plains on Thursday as the storm focuses on the lower Mississippi Valley.
“The storm can bring flooding downpours and locally damaging thunderstorms from Arkansas and Louisiana into Mississippi,” Sojda stated.
LikeLike
It will be a very hard night for residents of Louisiana and Arkansas. Thunderstorms attack.
LikeLike
The effect of stratospheric circulation on the tropospheric circulation is clearly visible.

https://www.cpc.ncep.noaa.gov/products/stratosphere/strat_int/
LikeLike
Circulation over North America does not change.
Repeating downpours will put the south-central United States at risk for flash flooding and travel disruptions as April ends and May begins.
LikeLike
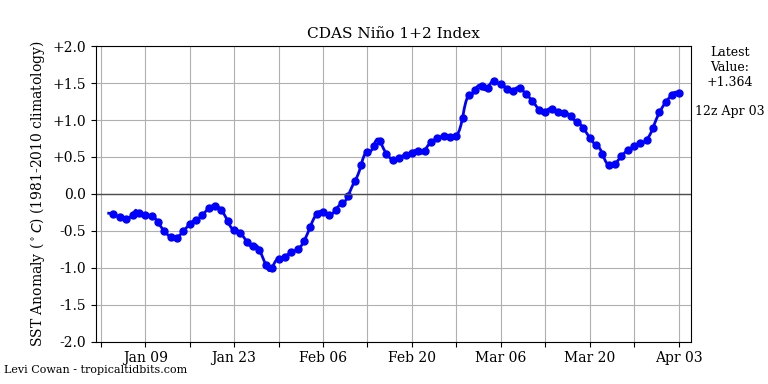
Getting less chance of El Niño. The frost returns to all of Canada.

LikeLike