Mid February is about a month away from the annual maximum Arctic ice extent, and measurements continue to seesaw in the two dynamic places where freezing and drifting cause gains and losses in sea ice. In each region, the gains and losses teeter-totter between two basins.
Here is the Atlantic seesaw with Barents and Baffin.
And here is the Pacific seesaw with Bering and Okhotsk.

While the seesaws are tilting back and forth on the margins, the bulk of the Arctic is frozen solid. And with limited places where more extent can be added, the pace of overall growth has slowed.
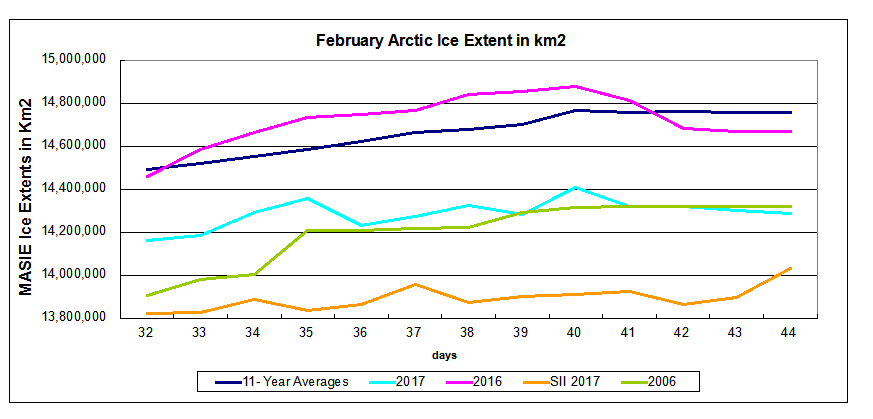
The graph shows that 2017 and 2006 are virtually tied at this date. It shows both years are below average by about 450k km2, and SII adds a further deficit by showing 2017 averaging in February ~400k km2 lower than MASIE.

The table below shows ice extents in the seas comprising the Arctic, comparing day 044 2017 with the same day average over the last 11 years and with 2006.
| Region | 2017044 | Day 044 Average |
2017-Ave. | 2006044 | 2017-2006 |
| (0) Northern_Hemisphere | 14287848 | 14759423 | -471575 | 14318694 | -30846 |
| (1) Beaufort_Sea | 1070445 | 1070111 | 334 | 1069711 | 734 |
| (2) Chukchi_Sea | 966006 | 965614 | 392 | 966006 | 0 |
| (3) East_Siberian_Sea | 1087137 | 1087131 | 6 | 1087103 | 35 |
| (4) Laptev_Sea | 897845 | 897835 | 10 | 897773 | 71 |
| (5) Kara_Sea | 908380 | 908367 | 12 | 932924 | -24545 |
| (6) Barents_Sea | 363927 | 581052 | -217125 | 507771 | -143844 |
| (7) Greenland_Sea | 565090 | 633257 | -68167 | 592221 | -27131 |
| (8) Baffin_Bay_Gulf_of_St._Lawrence | 1564353 | 1451561 | 112792 | 1209203 | 355150 |
| (9) Canadian_Archipelago | 853214 | 852984 | 230 | 852715 | 499 |
| (10) Hudson_Bay | 1260903 | 1260476 | 427 | 1257433 | 3470 |
| (11) Central_Arctic | 3209792 | 3215238 | -5446 | 3178718 | 31074 |
| (12) Bering_Sea | 564241 | 759583 | -195342 | 889465 | -325224 |
| (13) Baltic_Sea | 59994 | 105815 | -45822 | 68543 | -8549 |
| (14) Sea_of_Okhotsk | 834828 | 895634 | -60806 | 720201 | 114628 |
| (15) Yellow_Sea | 17654 | 31061 | -13407 | 20909 | -3255 |
| (16) Cook_Inlet | 9131 | 12083 | -2952 | 9530 | -399 |
The table indicates some differences in locations of ice surpluses and deficits. Bering Sea has been the largest deficit this year, while Barents is now matching it by losing ~100k in the last week. Greenland Sea is also down slightly compared to average and to 2006. Baffin Bay is the largest surplus to average and to 2006. Okhotsk lost more than 200k km2 in recent days, but still exceeds 2006 by 115k.
The second half of February will be interesting. The average year in the last eleven gained about 200k km2 from now to month end. But the variability ranged from 2006 losing 170K to 2012 gaining 590k km2. What will the ice do this year?
The polar bears have a Valentine Day’s wish for Arctic Ice.

And Arctic Ice loves them back, returning every year so the bears can roam and hunt for seals.

Footnote:
Seesaw accurately describes Arctic ice in another sense: The ice we see now is not the same ice we saw previously. It is better to think of the Arctic as an ice blender than as an ice cap, explained in the post The Great Arctic Ice Exchange.

In the archaeological work I did on St. Lawrence Island in the Bering Straight, one could detect the regular variation in sea ice extent in the pattern of human occupation of the island. I used this data set in correlation with climate records to refine the chronology of human occupation of the Bering Straight region.
Back and forth, in and out, up and down… a sea-saw consisting of climate, marine mammals and humans.
LikeLike
Thanks for that Michael. I have lots of respect for you doing field in such conditions. The closest I came was doing community development work in the Cree community of Great Whale River at the top of James Bay.
LikeLike