
MASIE ice extents reported March 8 through 31, 2017.
This time of year the heart of the Arctic is frozen solid, and the only changes occur in the marginal seas. Above shows the Atlantic basins, especially Kara, Barents, Greenland Sea and Baffin Bay. All of them seesawed during the month, with some fall off at the end, especially noticeable in Gulf of St. Lawrence (counted with Baffin Bay).
Meanwhile on the Pacific side, Bering fluctuated, while Okhotsk lost extent steadily toward month end.
Context
The monthly ice extent average for March provides indication of any year’s annual maximum, prior to melting down to the September annual minimum. Sometimes a lower March extent yields a lower September extent, but not always: 2012 had both the highest maximum and lowest minimum in the last 11 years. That was the year of the Great Arctic Cyclone, and an outlier in the record.
Looking at the 11-year averages in the MASIE data set, the pattern in round numbers is:
Maximum: 15.0 M km2
Minimum: 4.8 M km2
Loss: 10.2 M km2
Loss: 68.0 % of maximum
So about 2/3 of the maximum extent is lost, varying from 66 to 70%. Obviously, all the factors affecting ice extents are in play: (Water, Wind and Weather) with the September outcome uncertain, but likely to be in the range observed.
March 2017 in Comparison
As has been reported, ice formation this year has been sluggish compared to other years. The graph below shows March 2017 compared with the 11 year average, and with 2006 and 2016, as well as SII (Sea Ice Index).
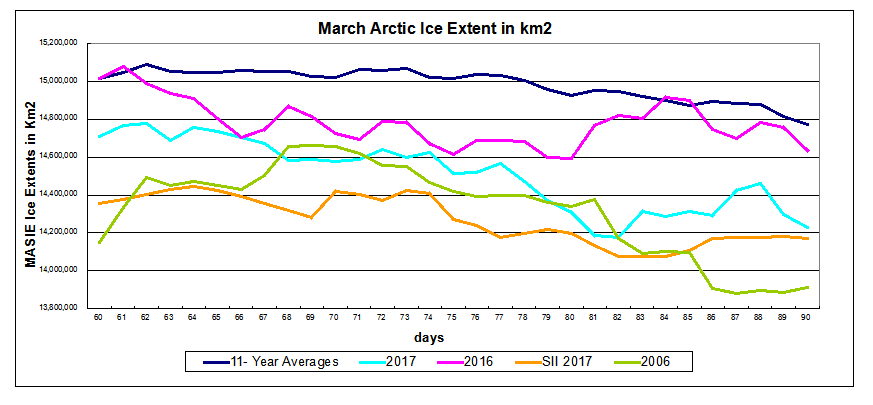
This March started below average, lost sllghtly until the third week, then recovered some before dropping off at the end. 2006 dropped off more rapidly than 2017, while 2016 ended near average. SII showed lower extents all month but drew close at the end.
The Table below shows Day 90 extents across the Arctic Seas compared to averages and 2006, the lowest recent year.
| Region | 2017090 | Day 090 Average |
2017-Ave. | 2006090 | 2017-2006 |
| (0) Northern_Hemisphere | 14228992 | 14791162 | -562170 | 13913402 | 315590 |
| (1) Beaufort_Sea | 1070445 | 1070018 | 427 | 1068683 | 1762 |
| (2) Chukchi_Sea | 966006 | 965297 | 709 | 959091 | 6915 |
| (3) East_Siberian_Sea | 1086168 | 1085794 | 374 | 1084627 | 1541 |
| (4) Laptev_Sea | 897845 | 896573 | 1272 | 897773 | 71 |
| (5) Kara_Sea | 831189 | 924617 | -93428 | 922164 | -90974 |
| (6) Barents_Sea | 525362 | 656247 | -130885 | 623912 | -98550 |
| (7) Greenland_Sea | 705581 | 661500 | 44081 | 604935 | 100645 |
| (8) Baffin_Bay_Gulf_of_St._Lawrence | 1467334 | 1426694 | 40641 | 1026934 | 440401 |
| (9) Canadian_Archipelago | 853214 | 852652 | 562 | 851691 | 1523 |
| (10) Hudson_Bay | 1260903 | 1251383 | 9521 | 1240389 | 20514 |
| (11) Central_Arctic | 3247995 | 3235035 | 12960 | 3241074 | 6921 |
| (12) Bering_Sea | 702504 | 847340 | -144836 | 662863 | 39640 |
| (13) Baltic_Sea | 29767 | 75051 | -45284 | 129348 | -99580 |
| (14) Sea_of_Okhotsk | 575084 | 830273 | -255189 | 588167 | -13083 |
| (15) Yellow_Sea | 0 | 99 | -99 | 1067 | -1067 |
| (16) Cook_Inlet | 7318 | 5460 | 1858 | 5462 | 1856 |
The marginal seas in the Atlantic and Pacific make the 2017 deficits to average: especially Barents, Kara, Bering and Okhotsk. Those seas usually lose all their ice by September. 2017 Surpluses in Greenland Sea and Baffin Bay are smaller, but make most of the difference with 2006.
2017 Outlook
March this year averaged 14.509 M Km2 compared to the 11 year average of 14.986 M km2, a deficit of 478k km2 or 3.2% down. That suggests that a typical melt later this year would result in a minimum of about 4.5 or 4.6 M km2, slightly down from the 11 year average of 4.8M km2.
Sea Ice Index (SII) typically shows less ice than MASIE, and SII reports a 2017 March average ice extent of 14.273 M km2 compared to SII 11 year March average of 14.842, a drop of 569k km2 or 3.8%. Folks relying on SII may be expecting a lower September minimum, perhaps even breaking the present plateau of ice extents since 2007. That remains to be seen.
