
The MASIE image shows Arctic Ocean ice is resilient and the numbers below will show how well 2017 compares to the decadal average. The only place where ice is below normal is outside the Arctic Ocean, namely Bering and Okhotsk Seas in the Pacific. Claims of disappearing ice pertain not to the Arctic itself, but to marginal Pacific seas that will melt out anyway by September.
I noticed the pattern this April when it became obvious that including Bering and Okhotsk in the Arctic totals gives a misleading picture. For sure they are part of Northern Hemisphere (NH) total sea ice, but currently the Pacific is going its own way, not indicative of the sea ice in the Central and Atlantic Arctic.
The graph below shows ice extents in the Arctic seas, excluding Bering and Okhotsk in the Pacific. Over the last 25 days 2017 Arctic ice has gone from average to a surplus of 400k km2 and is maintaining that advantage in May. As of May 8, ice in 2007 was 600k km2 behind and 2016 was lower by 700k km2.
While the Arctic ocean ice is persisting, Bering and Okhotsk extents have retreated ahead of schedule, as the graph below shows. The gap has persisted at 50% of decadal average over the last 3 weeks, going from 600k km2 on day 109 to 500k km2 on day 120, and presently Bering and Okhotsk combined are down by 400k km2. Of course, eventually both seas will be ice free by September.
“Freedom’s just another word for nothing left to lose.”
Kris Kristofferson song (Me and Bobby McGee)
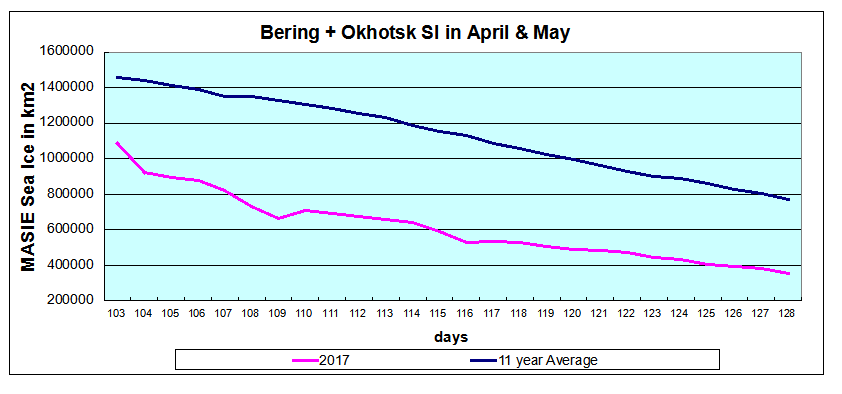
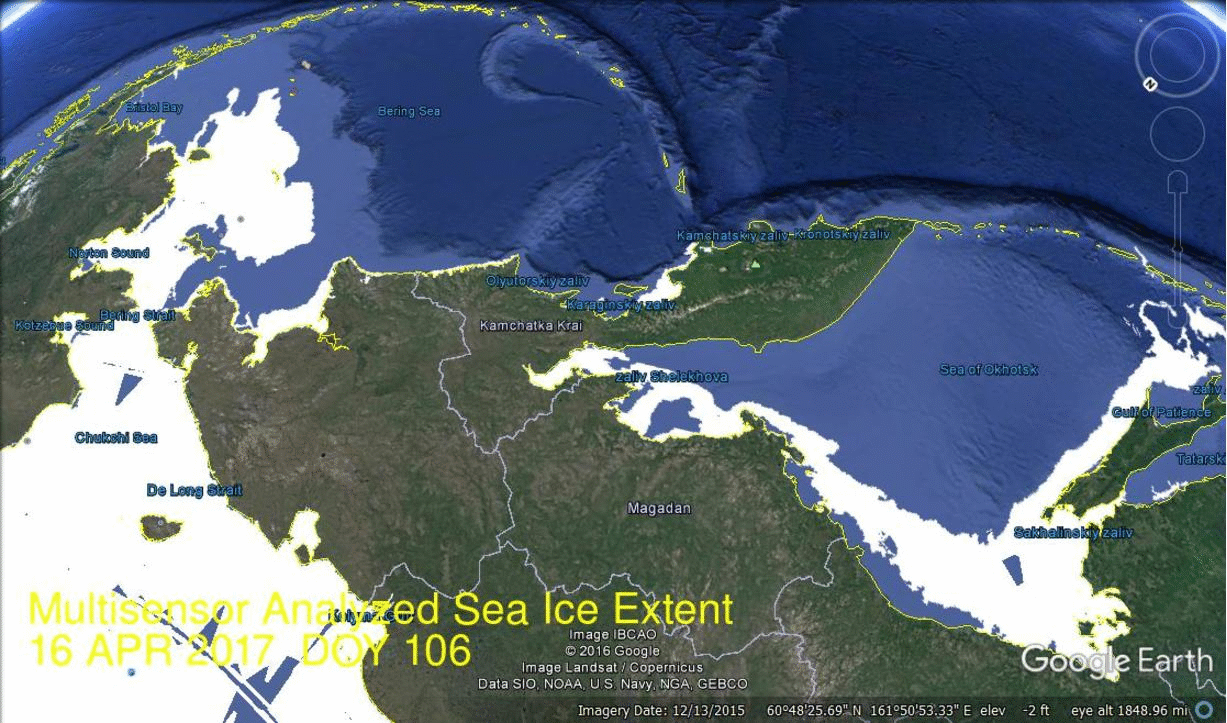
The distinctive Pacific pattern is evident in the images of changing ice extents. First, see how ice in Bering and Okhotsk seas has retreated the last 3 weeks..
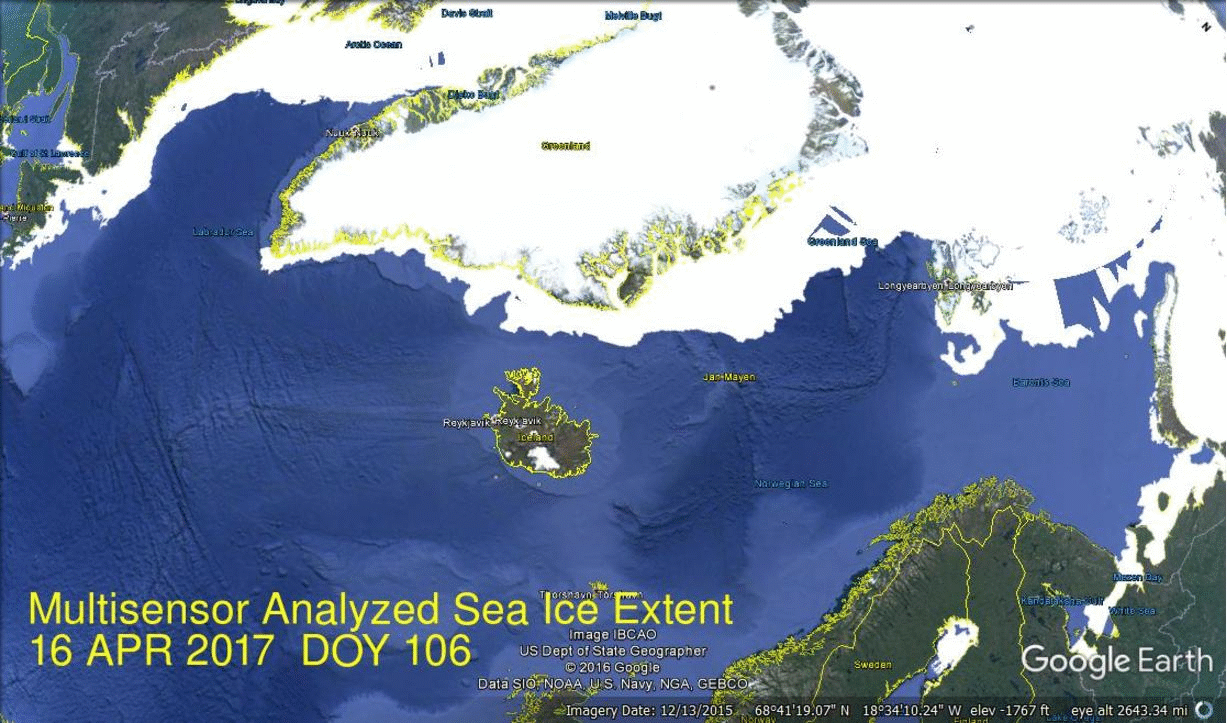
Meanwhile, on the Atlantic side ice has grown steadily. Note Newfoundland on the upper left has been blocked by ice only now retreating, while Svalbard on the middle right.continues to be encased.
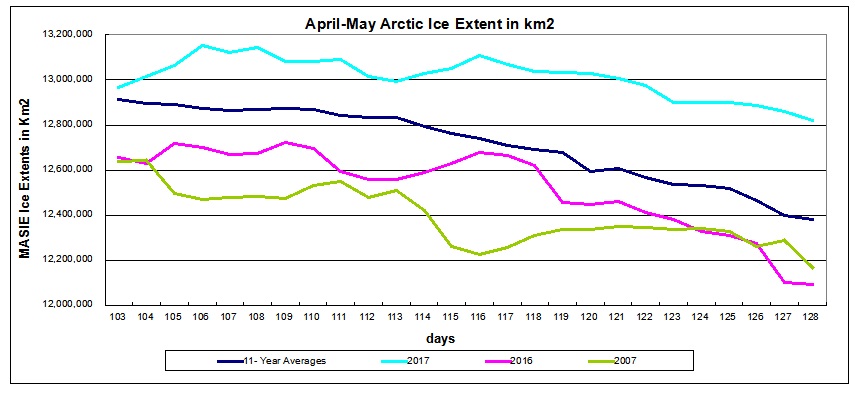
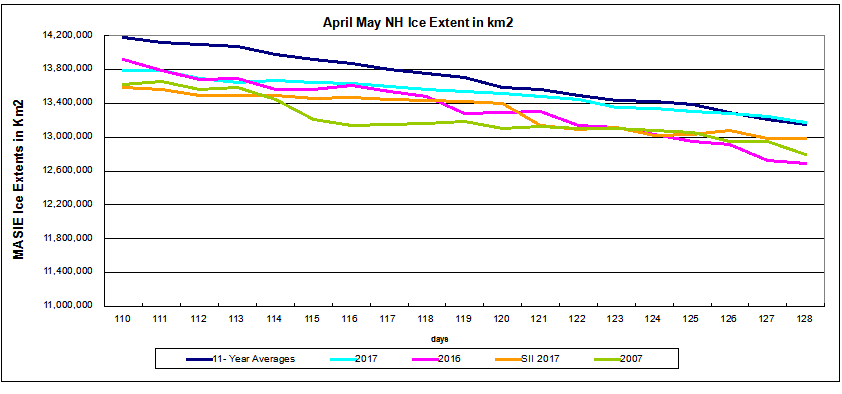
The Chart below shows the traditional view of NH ice extents, which includes the Pacific seas together with the Arctic seas. 2017 started this period 400k km2 below average, then caught up and is now tracking slightly above the decadal average.This is despite a deficit of 400k km2 in Bering and Okhotsk, which obscures the ice surpluses elsewhere. By comparison 2007 and 2016 are lagging behind by 400k km2..
The table below provides a more detailed description of NH ice by showing extents measured in the various seas on May 8, day 128 of the year.
| Region | 2017128 | Day 128 Average |
2017-Ave. | 2007128 | 2017-2007 |
| (0) Northern_Hemisphere | 13171174 | 13149118 | 22056 | 12792742 | 378432 |
| (1) Beaufort_Sea | 1061622 | 1056204 | 5418 | 1042771 | 18852 |
| (2) Chukchi_Sea | 957567 | 957220 | 348 | 939928 | 17640 |
| (3) East_Siberian_Sea | 1087137 | 1085117 | 2020 | 1081533 | 5605 |
| (4) Laptev_Sea | 897845 | 890721 | 7124 | 874837 | 23008 |
| (5) Kara_Sea | 920985 | 902466 | 18519 | 880185 | 40800 |
| (6) Barents_Sea | 487526 | 449413 | 38113 | 418974 | 68552 |
| (7) Greenland_Sea | 705745 | 613061 | 92684 | 605824 | 99921 |
| (8) Baffin_Bay_Gulf_of_St._Lawrence | 1340708 | 1139240 | 201467 | 1035447 | 305260 |
| (9) Canadian_Archipelago | 850635 | 842522 | 8113 | 834959 | 15676 |
| (10) Hudson_Bay | 1248694 | 1205894 | 42800 | 1199786 | 48908 |
| (11) Central_Arctic | 3247448 | 3220316 | 27132 | 3238105 | 9344 |
| (12) Bering_Sea | 191284 | 484937 | -293653 | 392119 | -200836 |
| (13) Baltic_Sea | 11485 | 13590 | -2105 | 10416 | 1070 |
| (14) Sea_of_Okhotsk | 160681 | 285356 | -124675 | 233588 | -72907 |
Clearly 2017 is above average everywhere, including Barents and Kara seas, with quite large surpluses in Greenland Sea and Baffin Bay. The deficits in the Pacific are also obvious, with Bering sea down the most.

Summary
The details are important to form a proper perception of any natural process, including dynamics of sea ice waxing and waning. On closer inspection, the appearance of declining Arctic sea ice is actually another after effect of the recent El Nino and Blob phenomena, and quite restricted to the Pacific marginal seas.
Meanwhile, on the Atlantic side of the Arctic, we have sightings and reports of ice surges along the coast of Newfoundland, such amounts not seen since the 1980s. Below is a NASA satellite photo of Newfoundland Sea Ice, May 5, 2017 Source: Newsfoundsander


If, if you are right then one would expect a reasonably slow decline this melt season all other things being equal.
There might be a bit more hot water in from the pacific to reduce this effect?
Hope you are right, fingers crossed.
Would love to see JCH reaction and Jim Hunt.
Would also suggest a late spike in piomas anomaly in 3 months, same reason.
LikeLike
A slower melt would also be consistent with reports of greater ice thickness this year in the central arctic. Pacific warming is the wild card, though most of the warmer water enters the arctic through the Atlantic.
LikeLike