
In April, Arctic ice extent showed typical losses, with two exceptions. Bering Sea has melted out ahead of schedule, while Barents Sea Ice is remarkably high this Spring. The image above shows Barents ice extents on day 120 from 2012 to 2018 (yesterday). Note how both shelf ice and central ice are greater this year and last. The graph below shows 2018 exceeds even 2014, the previous decadal high, stubbornly holding onto 700k km2.

The graph below shows how the Arctic extent has faired in April compared to the 11 year average and to some years of interest.
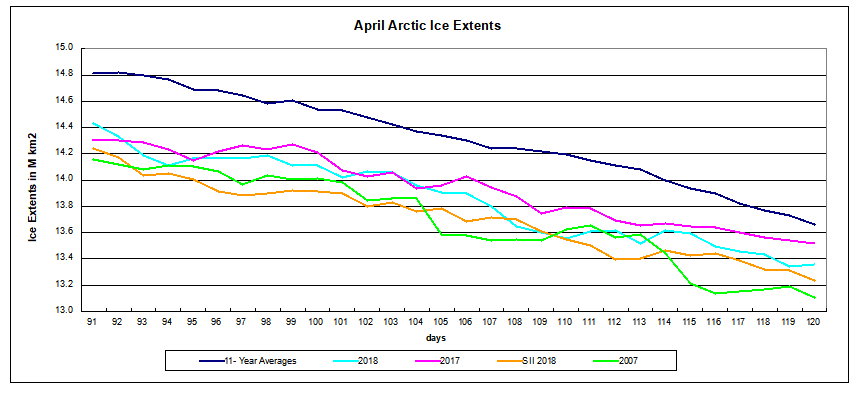 Note that 2018 is close to 2017 and slightly below the 11-year average. SII 2018 tracks about 200k km2 lower, while 2007 is another 200k behind. The table below shows ice extents by regions comparing 2018 with 11-year average (2007 to 2017 inclusive) and 2017.

| Region | 2018120 | Day 120 Average |
2018-Ave. | 2017120 | 2018-2017 |
| (0) Northern_Hemisphere | 13360026 | 13650051 | -290025 | 13519865 | -159839 |
| (1) Beaufort_Sea | 1069887 | 1067233 | 2654 | 1070445 | -558 |
| (2) Chukchi_Sea | 897588 | 962679 | -65091 | 960509 | -62921 |
| (3) East_Siberian_Sea | 1084975 | 1085634 | -659 | 1083984 | 991 |
| (4) Laptev_Sea | 895710 | 891029 | 4680 | 897556 | -1846 |
| (5) Kara_Sea | 934470 | 908342 | 26128 | 933484 | 986 |
| (6) Barents_Sea | 710238 | 526176 | 184062 | 570066 | 140172 |
| (7) Greenland_Sea | 589041 | 657057 | -68015 | 678737 | -89696 |
| (8) Baffin_Bay_Gulf_of_St._Lawrence | 1249752 | 1242545 | 7206 | 1452133 | -202382 |
| (9) Canadian_Archipelago | 853109 | 845536 | 7573 | 853214 | -106 |
| (10) Hudson_Bay | 1258712 | 1239854 | 18857 | 1260903 | -2192 |
| (11) Central_Arctic | 3219128 | 3237929 | -18801 | 3248013 | -28885 |
| (12) Bering_Sea | 58432 | 556317 | -497885 | 256470 | -198037 |
| (13) Baltic_Sea | 35281 | 21596 | 13685 | 18836 | 16446 |
| (14) Sea_of_Okhotsk | 501401 | 404448 | 96953 | 232763 | 268638 |
2018 is 290k km2 below average (2%) and 160k below last year. The deficits are entirely due to Bering Sea, which is down 500k km2 to average and 200k to 2017. OTOH both Okhotsk and Barents are showing large surpluses. The graph below show April 2018 is on average once Bering and Okhotsk are removed form the calculations


The latest diesel-electric Ilya Muromets icebreaker of the Northern fleet began trials in the ice of the eastern Barents Sea. It approached the ice edge of average thickness, the Northern fleet said. “The ice is from 50 to 100 centimeters thick in the area. Ice compaction is 9-10 points. Thus, trial conditions are favorable and correspond to the technical capabilities of the icebreaker. The trials are to continue until the end of the month and the icebreaker will return to Murmansk after them,” it said. From http://www.navyrecognition.com

Reblogged this on Climate Collections.
LikeLike
Thank you for another excellent overview, Ron. It alerted me to the fact most of the “missing” sea-ice is in the Bering Sea.
When I lurk on Alarmist sites I note Alarmists invest a lot of hope in the open water south of Bering Strait. The hope seems to be that those waters will be warmed by sunshine, due to less reflective sea-ice, and then those warmed waters will then north of Bering Strait and melt the ice-edge on the Pacific side of the Pole.
We’ll see about that. I entertain some doubts, because the NOAA SST anomaly maps show the waters right in the strait are below normal. The above-normal waters lie further south towards the Aleutian Islands, and just south of the Aleutians a sprinkling of below-normal waters extends to California and then curves back to Hawaii. This backwards “C” of below-normal waters is the signature of a “cold” PDO. I watch the PDO like a hawk, because (although I don’t understand why) a “cold” PDO is indicative of sea-ice that resists melting, north of Bering Strait.
It is interesting to watch the NOAA SST anomally map, because small changes in temperature can cause dramatic changes in the color-coding. Water a quarter-degree above normal dropping a half-degree becomes water a quarter-degree below normal, and this involves color shifting from vivid yellow to pale blue. And a dramatic change in coloring doesn’t even have to involve any actual cooling. Because the map is an “anomaly map”, if the water warms more slowly than than normal it can go from being above-normal to below-normal. From all appearances it goes from sunny yellow to chilling blue, even though it is in fact warming.
It is fascinating to watch as summer comes on, partly for objective and scientific reasons, and partly because people can utterly freak out, and flip out when a large area of water that was sunny yellow one week turns to chilly blue the next. There will be a chorus of cries of “conspiracy!” And it is all about a half-degree!
By the way, I note that your excellent work has drawn the ire of certain Alarmists. Congratulations! That is a sure sign your work is good. You only draw flak when you are over the target.
I linked to this post in my own arctic overview here:
https://sunriseswansong.wordpress.com/2018/05/04/arctic-sea-ice-mayday-mutterings/
LikeLike
Caleb, thanks for the encouraging words. I had read your mayday muttering yesterday. As usual, it shows you have been at this a long time and are familiar with a range of observational sources. Too bad about the buoys.
My own preoccupation with Arctic is more recent, triggered by warnings that MASIE reports would be discontinued (still a possibillity). So I keep using that great tool as long as it survives. Lately I am trying to better understand how the wind factors in. For example. last month when Bering was melting while Okhotsk ice was growing, nullschool was clearly showing the gyre sitting over Bering pulling up warmer southern air, while the Kamchatka peninsula blocked southern winds into Okhotsk. Now in May the gyre has moved and is pulling Arctic air through the Strait. Were it not for the Strait itself, ice would probably be flushed out.
https://earth.nullschool.net/#current/wind/surface/level/orthographic=-188.95,51.31,606/loc=143.378,43.684
Because of the blocking land mass, 90% of ocean water entering the Arctic comes from the Atlantic through Barents Sea, only 10% from the Pacific side. So it remains to be seen what will be the effect of early melting in Bering.
LikeLiked by 1 person