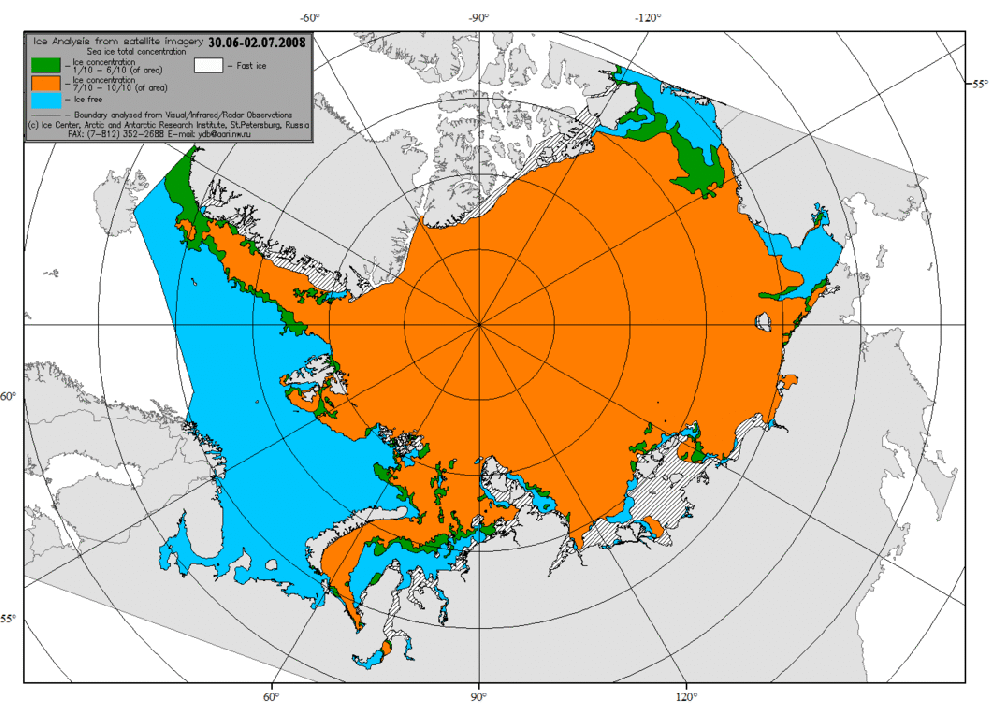
In June 2018, Arctic ice extent held up against previous years despite the Pacific basins of Bering and Okhotsk being ice-free. Now in July when ice extent typically declines, 2018 extents were flat, and now declining slowly. The Arctic core is showing little change, perhaps due to increased thickness (volume) as reported by DMI. The image above from AARI shows ice extents first week of July for years 2008 through 2018. (Image format was different for previous years. In 2018, water is showing typically in Chukchi in July, a bit more than usual in Laptev and less in Beaufort.
The graph below shows how the Arctic extent has faired from mid June to July 7 (yesterday) compared to the 11 year average and to some years of interest.
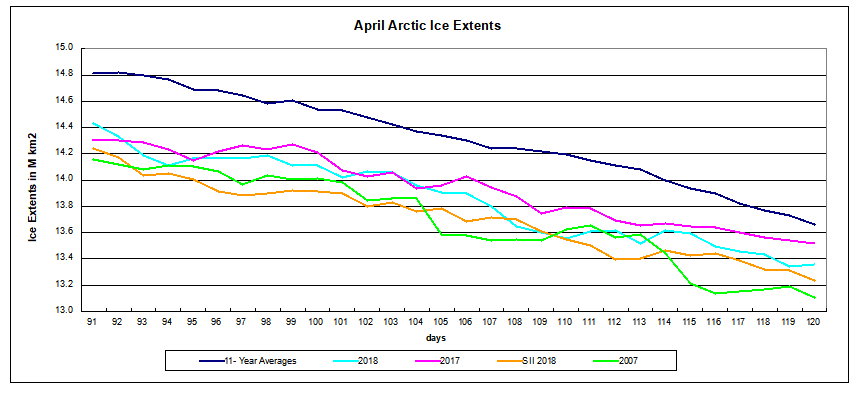 Note that 2018 was on average and comparable to other years from Mid June on. Then recently ice extents have held steady just below 10M km2, while averages and other years declined. 2018 is now 288k km2 above the 11 year average, 400k km2 higher than 2017, and 624k km2 greater than 2007 at this date. SII 2018 was tracking the same as MASIE in June but is now showing 335k km2 lower.

The table below shows ice extents by regions comparing 2018 with 11-year average (2007 to 2017 inclusive) and 2017 as of day 179.
| Region | 2018188 | Day 179 Average |
2018-Ave. | 2007188 | 2018-2007 |
| (0) Northern_Hemisphere | 9465018 | 9181173 | 283844 | 8841116 | 623902 |
| (1) Beaufort_Sea | 977561 | 863028 | 114533 | 871601 | 105960 |
| (2) Chukchi_Sea | 635350 | 682991 | -47641 | 622583 | 12767 |
| (3) East_Siberian_Sea | 1037340 | 996766 | 40574 | 855273 | 182067 |
| (4) Laptev_Sea | 545304 | 684244 | -138941 | 644539 | -99236 |
| (5) Kara_Sea | 568399 | 477164 | 91236 | 523575 | 44824 |
| (6) Barents_Sea | 54547 | 88754 | -34206 | 91567 | -37020 |
| (7) Greenland_Sea | 353292 | 477433 | -124141 | 506546 | -153254 |
| (8) Baffin_Bay_Gulf_of_St._Lawrence | 592755 | 393419 | 199336 | 411743 | 181013 |
| (9) Canadian_Archipelago | 778940 | 756496 | 22444 | 752103 | 26837 |
| (10) Hudson_Bay | 791754 | 543956 | 247798 | 354253 | 437502 |
| (11) Central_Arctic | 3128568 | 3203921 | -75353 | 3202400 | -73832 |
2018 is above the 11 year average, with BCE (Beaufort, Chukchi, East Siberian) higher, Laptev and Kara offsetting. Barents and Greenland Sea are down, but Baffin and Hudson Bays have larger surpluses.
Footnote:
Arctic extents are shaped by the three Ws: Water, Wind and Weather. This video shows how a massive cyclone in 2012 broke up the ice, moved it around and flushed much of it out through the Fram strait.The ice has recovered since then and is now quite thick.
