 This post is about the SEAFRAME network measuring sea levels in the Pacific, and about the difficulty to discern multi-decadal trends of rising or accelerating sea levels as evidence of climate change.
Update July 9, 2018
Asked a question today about sea levels and Pacific islands, I referred to this article. Realizing it was posted 2 years ago, it seemed important to check the most recent project report. Thus at the bottom there are now results through May 2018.
Update May 10 below, regarding recent Solomon Islands news
Pacific Sea Level Monitoring Network
The PSLM project was established in response to concerns voiced by Pacific Island countries about the potential effects of climate change. The project aims to provide an accurate long-term record of sea levels in the area for partner countries and the international scientific community, and enable the former to make informed decisions about managing their coastal environments and resources.
In 1991, the National Tidal Facility (NTF) of the Flinders University of South Australia was awarded the contract to undertake the management of the project. Between July 1991 and December 2000 sea level and meteorological monitoring stations were installed at 11 sites. Between 2001 and 2005 another station was established in the Federated States of Micronesia and continuous global positioning systems (CGPS) were installed in numerous locations to monitor the islands’ vertical movements.
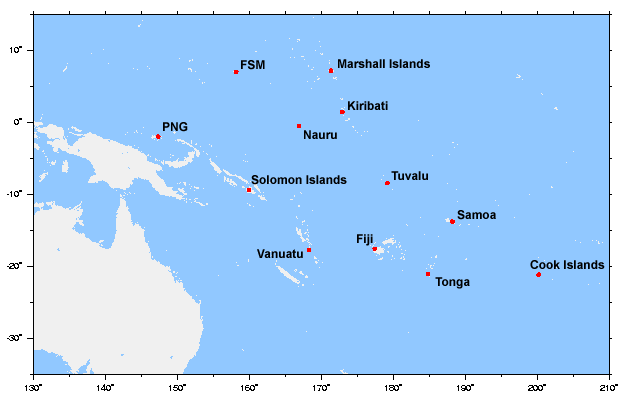
The 14 Pacific Island countries now participating in the project provide a wide coverage across the Pacific Basin: the Cook Islands, Federated States of Micronesia, Fiji, Kiribati, Marshall Islands, Nauru, Niue, Palau, Papua New Guinea, Samoa, Solomon Islands, Tonga, Tuvalu and Vanuatu.
Each of these SEA Level Fine Resolution Acoustic Measuring Equipment (SEAFRAME) stations in the Pacific region are continuously monitoring the Sea Level, Wind Speed and Direction, Wind Gust, Air and Water Temperatures and Atmospheric Pressure.
In addition to its system of tide gauge facilities, the Pacific Sea-Level Monitoring Network also includes a network of earth monitoring stations for geodetic observations, implemented and maintained by Geoscience Australia. The earth monitoring installations provide Global Navigation Satellite System (GNSS) measurements to allow absolute determination of the vertical height of the tide gauges that measure sea level.
Sea Level Datasets from PSLM
Data and reports are here.
Monthly reports are detailed and informative. At each station water levels are measured every six minutes in order to calculate daily maxs, mins and means, as a basis for monthly averages. So the daily mean sea level value is averaged from 240 readings, and the daily min and max are single readings taken from the 240.
A typical monthly graph appears above. It shows how tides for these stations range between 1 to 3 meters daily, as well variations during the month.
According to the calibrations, measurement errors are in the range of +/- 1 mm. Vertical movement of the land is monitored relative to a GPS benchmark. So far, land movement at these stations has also been within the +/- 1 mm range (with one exception related to an earthquake).
The PSLM Record
In the Monthly reports are graphs showing results of six minute observations, indicating tidal movements daily over the course of a month.The chart above shows how sea level varied in each location during March 2016 compared to long term March results. Since many stations were installed in 1993, long term means about 22 years of history.
This dataset for Pacific Sea Level Monitoring provides a realistic context for interpreting studies claiming sea level trends and/or acceleration of such trends. Of course, one can draw a line through any scatter of datapoints and assert the existence of a trend. And the error ranges above allow for annual changes of a few mm to be meaningful. Here is a table produced in just that way.
| Location | Installation date | Sea-level trend (mm/yr) |
| Cook Islands | Feb 2003 | +5.5 |
| Federated States of Micronesia | Dec 2001 | +17.7 |
| Fiji | Oct 1992 | +2.9 |
| Kiribati | Dec 1992 | +2.9 |
| Marshall Islands | May 1993 | +5.2 |
| Nauru | Jul 1993 | +3.6 |
| Papua New Guinea | Sept 1994 | +8.0 |
| Samoa | Feb 1993 | +6.9 |
| Solomon Islands | Jul 1994 | +7.7 |
| Tonga | Jan 1993 | +8.6 |
| Tuvalu | Mar 1993 | +4.1 |
| Vanuatu | Jan 1993 | +5.3 |
The rising trends range from 2.9 to 8.6 mm/year (FSM is too short to be meaningful).
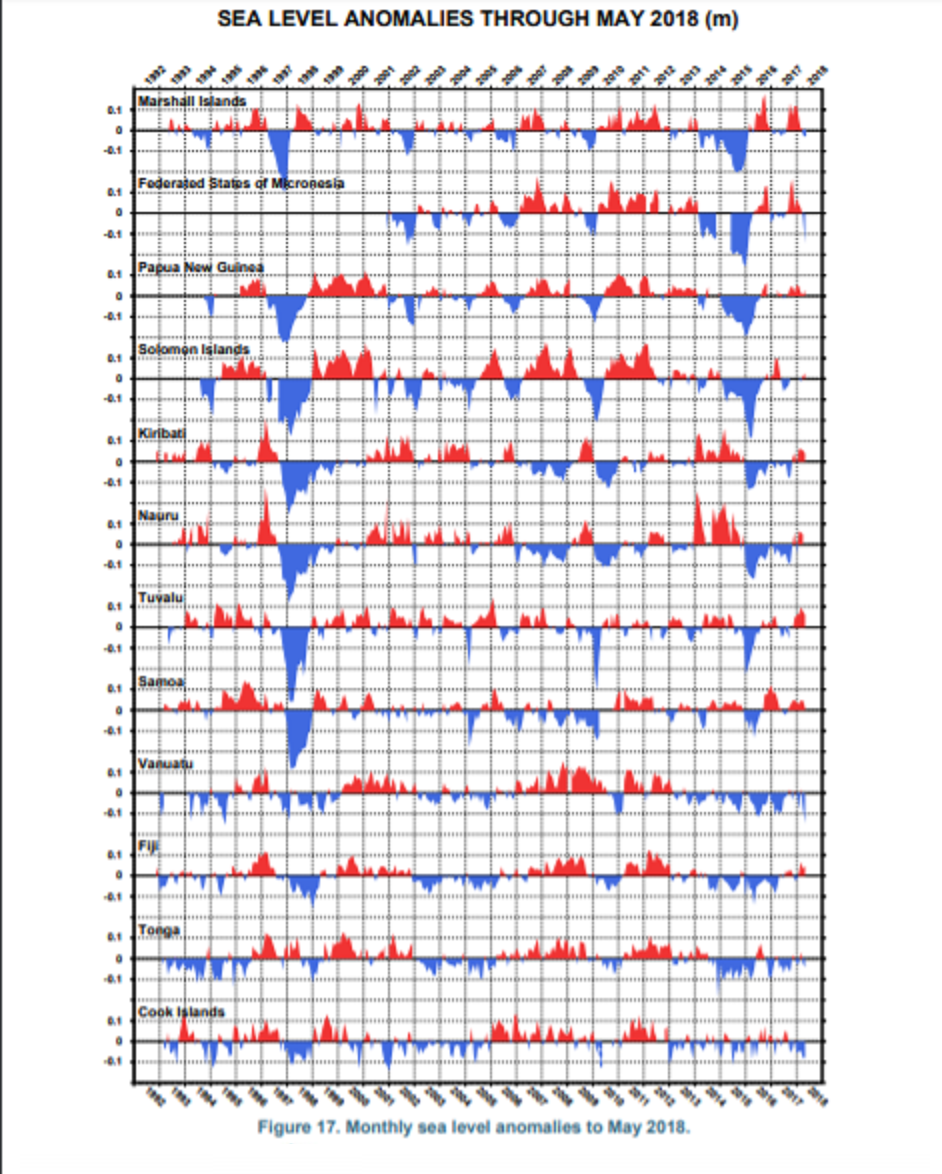
Looking into the details of the monthly anomalies, it is clear that sea level changes at the mm level are swamped by volatility of movements greater by orders of magnitude. And there are obvious effects from ENSO events. The 1997-98 El Nino shows up in a dramatic fall of sea levels almost everywhere, and that event alone creates most of the rising trends in the table above. The 2014-2016 El Nino is also causing sea levels to fall, but is too recent to affect the long term trend.
Here are the sea level records updated to May 2018.

The records are dominated by two Major El Nino events in 1997-8 and 2015-6. When Westerly winds pick up, warm surface water is pushed from western (Asian) Pacific toward eastern (American) Pacific. Thus sea levels decline temporarily during those periods, as seen in the blue deficits in the charts above. Below the updated sea level trends.

Summary
Sea Level Rise is another metric for climate change that demonstrates the difficulty discerning a small change of a few millimeters in a dataset where tides vary thousands of millimeters every day. And the record is also subject to irregular fluctuations from storms, currents and oceanic oscillations, such as the ENSO.
On page 8 of its monthly reports (here), PSLM project provides this caution regarding the measurements:
The overall rates of movement are updated every month by calculating the linear slope during the tidal analysis of all the data available at individual stations. The rates are relative to the SEAFRAME sensor benchmark, whose movement relative to inland benchmarks is monitored by Geosciences Australia.
Please exercise caution in interpreting the overall rates of movement of sea level – the records are too short to be inferring long-term trends.
A longer record will bring more insight, but even then sea level trends are a very weak signal inside a noisy dataset. Even with state-of-the-art equipment, it is a fool’s errand to discern any acceleration in sea levels, in order to link it to CO2. Such changes are in fractions of millimeters when the measurement error is +/- 1 mm.
For more on the worldwide network of tidal gauges, as well as satellite systems attempting to measure sea level, sea Dave Burton’s excellent website.
May 10 update Regarding recent news about Solomon Islands.
As the charts above show, there is negligible sea level rise in the West Pacific, and receding a bit lately at Solomon Islands. So it was curious that the media was declaring those islands inundating because of climate change.
Now the real story is coming out (but don’t wait for the retractions)
A new study published in Environmental Research Letters shows that some low-lying reef islands in the Solomon Islands are being gobbled up by “extreme events, seawalls and inappropriate development, rather than sea level rise alone.” Despite headlines claiming that man-made climate change has caused five Islands (out of nearly a thousand) to disappear from rising sea levels, a closer inspection of the study reveals the true cause is natural, and the report’s lead author says many of the headlines have been ‘exaggerated’ to ill-effect.


“No amount of experimentation can ever prove me right; a single experiment can prove me wrong.” Albert Einstein
TFK_bams09 pg5/14
“At the surface, the outgoing radiation was computed for blackbody emission at 15°C using the Stefan–Boltzmann law R = εσT4, (1) where the emissivity ε was set to 1.”
As my modest experiment demonstrates, the contiguous participating molecules of the atmosphere make such BB emission impossible.
https://www.linkedin.com/feed/update/urn:li:activity:6394226874976919552
No GHG energy loop + No RGHE = Carbon dioxide and mankind play no role in the behavior of the climate.
Remember, science does not care.
LikeLike
nick, I understand your position and do not disagree. But in the future please comment on the topic of the post.
LikeLike
“Despite headlines claiming that !!! man-made climate change !!!! has caused five Islands….”
Off topic?????
LikeLike
Reblogged this on Climate Collections.
LikeLike