Update July 20, 2018
No one knows how long this divergence of surplus ice will persist, but for now 2018 Arctic ice extent resembles a hockey stick. OK, the blade angle is drooping, but the gap over previous years is increasing. At day 200 ice extent this year is 572k km2 above 11 year average (2007 to 2017 inclusive), an addition of ~50k km2 in the last two days. 2018 solidified its lead of 1M km2 greater than 2007. The gap over 2007 has more than doubled in the past five days. More detailed report from July 14 below.
In June 2018, Arctic ice extent held up against previous years despite the Pacific basins of Bering and Okhotsk being ice-free. The Arctic core is showing little change, perhaps due to increased thickness (volume) as reported by DMI.
The image above shows ice extents on day 195 (July 14) for years 2007, 2012, 2017 and 2018. Note this year ice is strong on both Russian and N. American sides. Beaufort Sea and Canadian Archipelago are solid. E. Siberian and Chukchi Seas are also solid, despite early melting in Bering Sea. Hudson and Baffin bays still have considerable ice compared to other years.
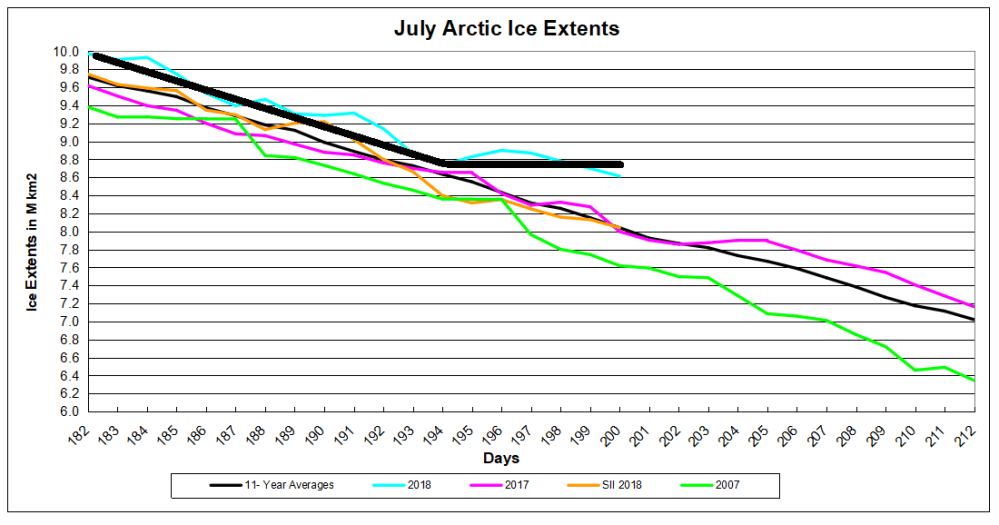
The graph below shows how the Arctic extent has faired in July compared to the 11 year average and to some years of interest.
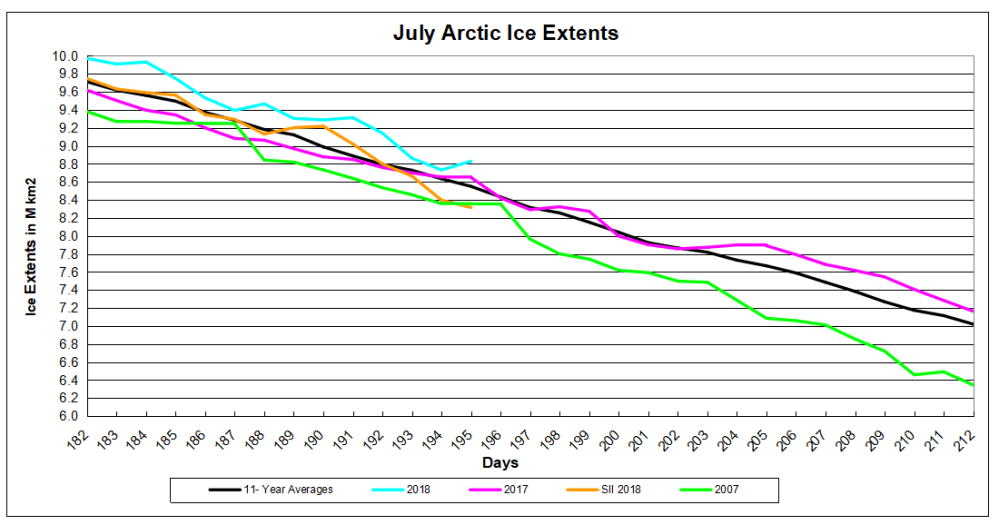
Note that 2018 started July well above the 11 year average and other recent years. As of day 195 (yesterday) ice extent is still greater than average and the years 2007 and 2017. SII 2018 is tracking well below MASIE this month, a gap of 500k km2 at this point.

The table below shows ice extents by regions comparing 2018 with 11-year average (2007 to 2017 inclusive) and 2017.
| Region | 2018195 | Day 195 Average |
2018-Ave. | 2007195 | 2018-2007 |
| (0) Northern_Hemisphere | 8828959 | 8549517 | 279442 | 8355280 | 473679 |
| (1) Beaufort_Sea | 993219 | 826109 | 167110 | 845973 | 147246 |
| (2) Chukchi_Sea | 644989 | 636401 | 8588 | 576079 | 68911 |
| (3) East_Siberian_Sea | 1024284 | 950636 | 73648 | 788128 | 236156 |
| (4) Laptev_Sea | 492172 | 633149 | -140977 | 575520 | -83347 |
| (5) Kara_Sea | 438240 | 399007 | 39233 | 483785 | -45545 |
| (6) Barents_Sea | 30629 | 64124 | -33495 | 75731 | -45101 |
| (7) Greenland_Sea | 285428 | 443318 | -157890 | 472890 | -187462 |
| (8) Baffin_Bay_Gulf_of_St._Lawrence | 489193 | 305230 | 183963 | 343396 | 145797 |
| (9) Canadian_Archipelago | 747737 | 719112 | 28626 | 730629 | 17109 |
| (10) Hudson_Bay | 619471 | 381783 | 237688 | 248785 | 370686 |
| (11) Central_Arctic | 3062425 | 3185383 | -122959 | 3211275 | -148850 |
2018 is 280k km2 above average, mostly due to Hudson and Baffin bays having surplus ice. Laptev, Greenland Sea and Central Arctic are down, more than offset by surpluses elsewhere. Since the two bays will melt out soon, the eventual annual minimum remains to be seen.

Reblogged this on Climate Collections.
LikeLike
Why does the history only go back 11 years?
Does the data set used only go back 11 years?
While I glad for the signs of a possible recovery and possible reversal of natural variation cycle the 11 year cutoff suggests cherry picking.
LikeLike
SW, NSIDC made the dataset available saying, “In June 2014, we decided to make the MASIE product available back to 2006. This was done in response to user requests, and because the IMS product output, upon which MASIE is based, appeared to be reasonably consistent.” Since 2007 was the low point after 2 previous decades of decline, the record since then shows no further decline, a kind of plateau. As I mentioned in my post https://rclutz.wordpress.com/2017/01/30/support-masie-arctic-ice-dataset/, reasearchers in the past had access to MASIE older records but not the public.
LikeLike