Update July 22, 2018
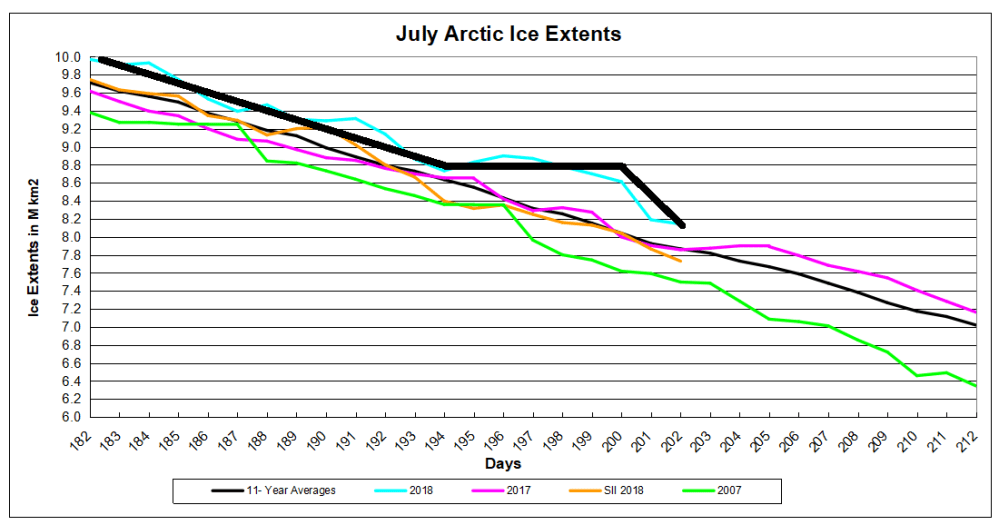
No one knew how long this divergence of surplus ice would persist, but 2018 Arctic ice extent resembled a hockey stick until two days ago. Through day 200 the gap over 11 year average and 2007 was increasing, but then more than 400k km2 disappeared overnight. Despite the bent blade, presently the ice is 525k km2 above 11 year average (2007 to 2017 inclusive) and 640k km2 greater than 2007.
Note that 2018 started July well above the 11 year average and other recent years. and remains higher. SII 2018 was tracking close to MASIE last month, but in July SII shows lower extents, a gap of 400k km2 at this point.
The image above shows ice extents on day 202 (July 21) for years 2007, 2012, 2017 and 2018. Note this year ice is strong on both Russian and N. American sides. Beaufort Sea and Canadian Archipelago show limited water. E. Siberian and Chukchi Seas are also solid, despite early melting in Bering Sea. Open water has increased in Laptev, Kara and Greenland seas in recent days. Hudson and Baffin bays still have considerable ice compared to other years, but less than a few days ago.

The table below shows ice extents by regions comparing 2018 with 11-year average (2007 to 2017 inclusive) and 2017.
| Region | 2018202 | Day 202 Average |
2018-Ave. | 2007202 | 2018-2007 |
| (0) Northern_Hemisphere | 8142139 | 7866163 | 275976 | 7497932 | 644207 |
| (1) Beaufort_Sea | 984569 | 794601 | 189968 | 795440 | 189129 |
| (2) Chukchi_Sea | 603534 | 592924 | 10610 | 471400 | 132134 |
| (3) East_Siberian_Sea | 1000229 | 901222 | 99007 | 707427 | 292802 |
| (4) Laptev_Sea | 394293 | 562570 | -168276 | 447964 | -53670 |
| (5) Kara_Sea | 274538 | 286359 | -11822 | 347266 | -72728 |
| (6) Barents_Sea | 8339 | 47186 | -38847 | 49639 | -41300 |
| (7) Greenland_Sea | 224531 | 375231 | -150700 | 366856 | -142325 |
| (8) Baffin_Bay_Gulf_of_St._Lawrence | 382837 | 221949 | 160888 | 275856 | 106980 |
| (9) Canadian_Archipelago | 677670 | 664853 | 12817 | 672482 | 5188 |
| (10) Hudson_Bay | 516787 | 238389 | 278398 | 145395 | 371392 |
| (11) Central_Arctic | 3073623 | 3178081 | -104458 | 3216865 | -143243 |
2018 is 276k km2 above average (3.5%), mostly due to Hudson and Baffin bays having surplus ice. Laptev, Greenland Sea and Central Arctic are down, more than offset by surpluses elsewhere, especially Beaufort and East Siberian seas. Since the two bays will melt out soon, the eventual annual minimum remains to be seen.
Footnote:
Most readers know of the Mann-made Crooked Hockey Stick, which duped IPCC and Al Gore for awhile. That story is told in the post Rise and Fall of the Modern Warming Spike


Reblogged this on Climate Collections.
LikeLike