
For ice extent in the Arctic, the bar is set at 15M km2. The average in the last 12 years occurs on day 62 at 15.07M before descending. Most years are able to clear 15M, but in the five previous years only 2014 and 2016 ice extents cleared the bar at 15M km2; the others came up short.
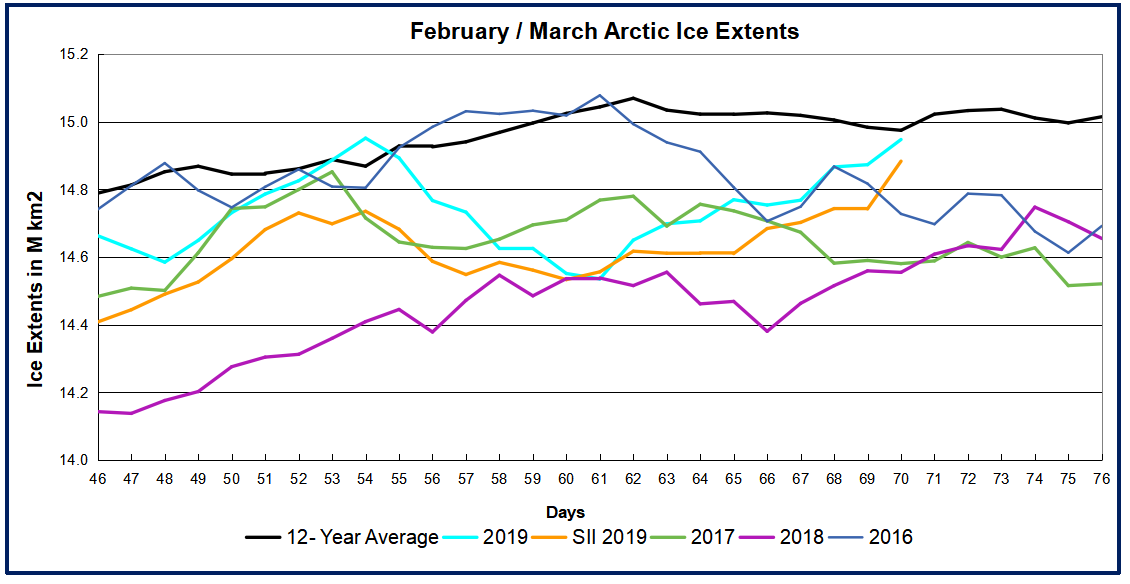
On day 61, March 2, 2016 peaked well above 15M, and did not reach that level again. The graph shows 2017 peaked early and then descended into the Spring melt. 2018 started much lower, gained steadily before peaking on day 74, 250k km2 below average. 2019 has been exceptional, surging early to surpass average on day 54, then declined for a week, before re-surging to virtually tie the average extent on day 70. One final push in the next few days could go over the top.
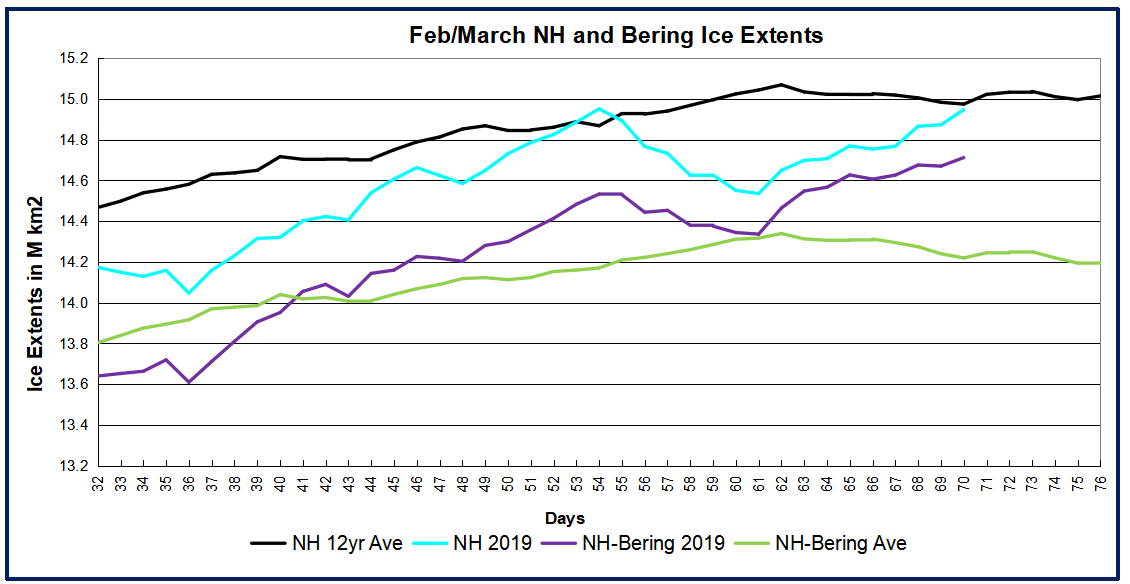
As reported previously, Bering Sea is a big part of the story this year. The graph above shows NH ice extents from mid-February to mid-March with and without Bering ice. The gap between black and green lines shows that Bering contributed about 700k km2 to the NH average, increasing to 800k km2 by the end of this period. However, 2019 started with about 500k km2 from Bering. The gap between the cyan and purple lines shows Bering ice declined down to 140k km2, before adding back 100k km2 in the last 3 days. Meanwhile, Okhotsk Sea next door gained steadily and is now holding above average ice extents. Except for Bering, 2019 ice extents are well above the 12 year average (2007 to 2018 inclusive).
Typically, Arctic ice extent loses 67 to 70% of the March maximum by mid September, before recovering the ice in building toward the next March.
What will the ice do this year? Where will 2019 rank in the annual Arctic Ice High Jump competition?

Drift ice in Okhotsk Sea at sunrise.


Reblogged this on Climate Collections.
LikeLike