Carbon Tax Dubious Economics

How could 3508 economists be wrong? Let us count the ways.

Michael Davis writes at Regulation Magazine The signatories of the recent “Economists’ Statement on Carbon Dividends” must address some important issues. Excerpts in italics with my bolds.

Economists are disagreeable people. And it’s good that they are. Most important economic questions are complex, multi-dimensional puzzles with no obvious, simple answers. But debate and disagreement advance our understanding of the world, and so good economists debate and disagree.

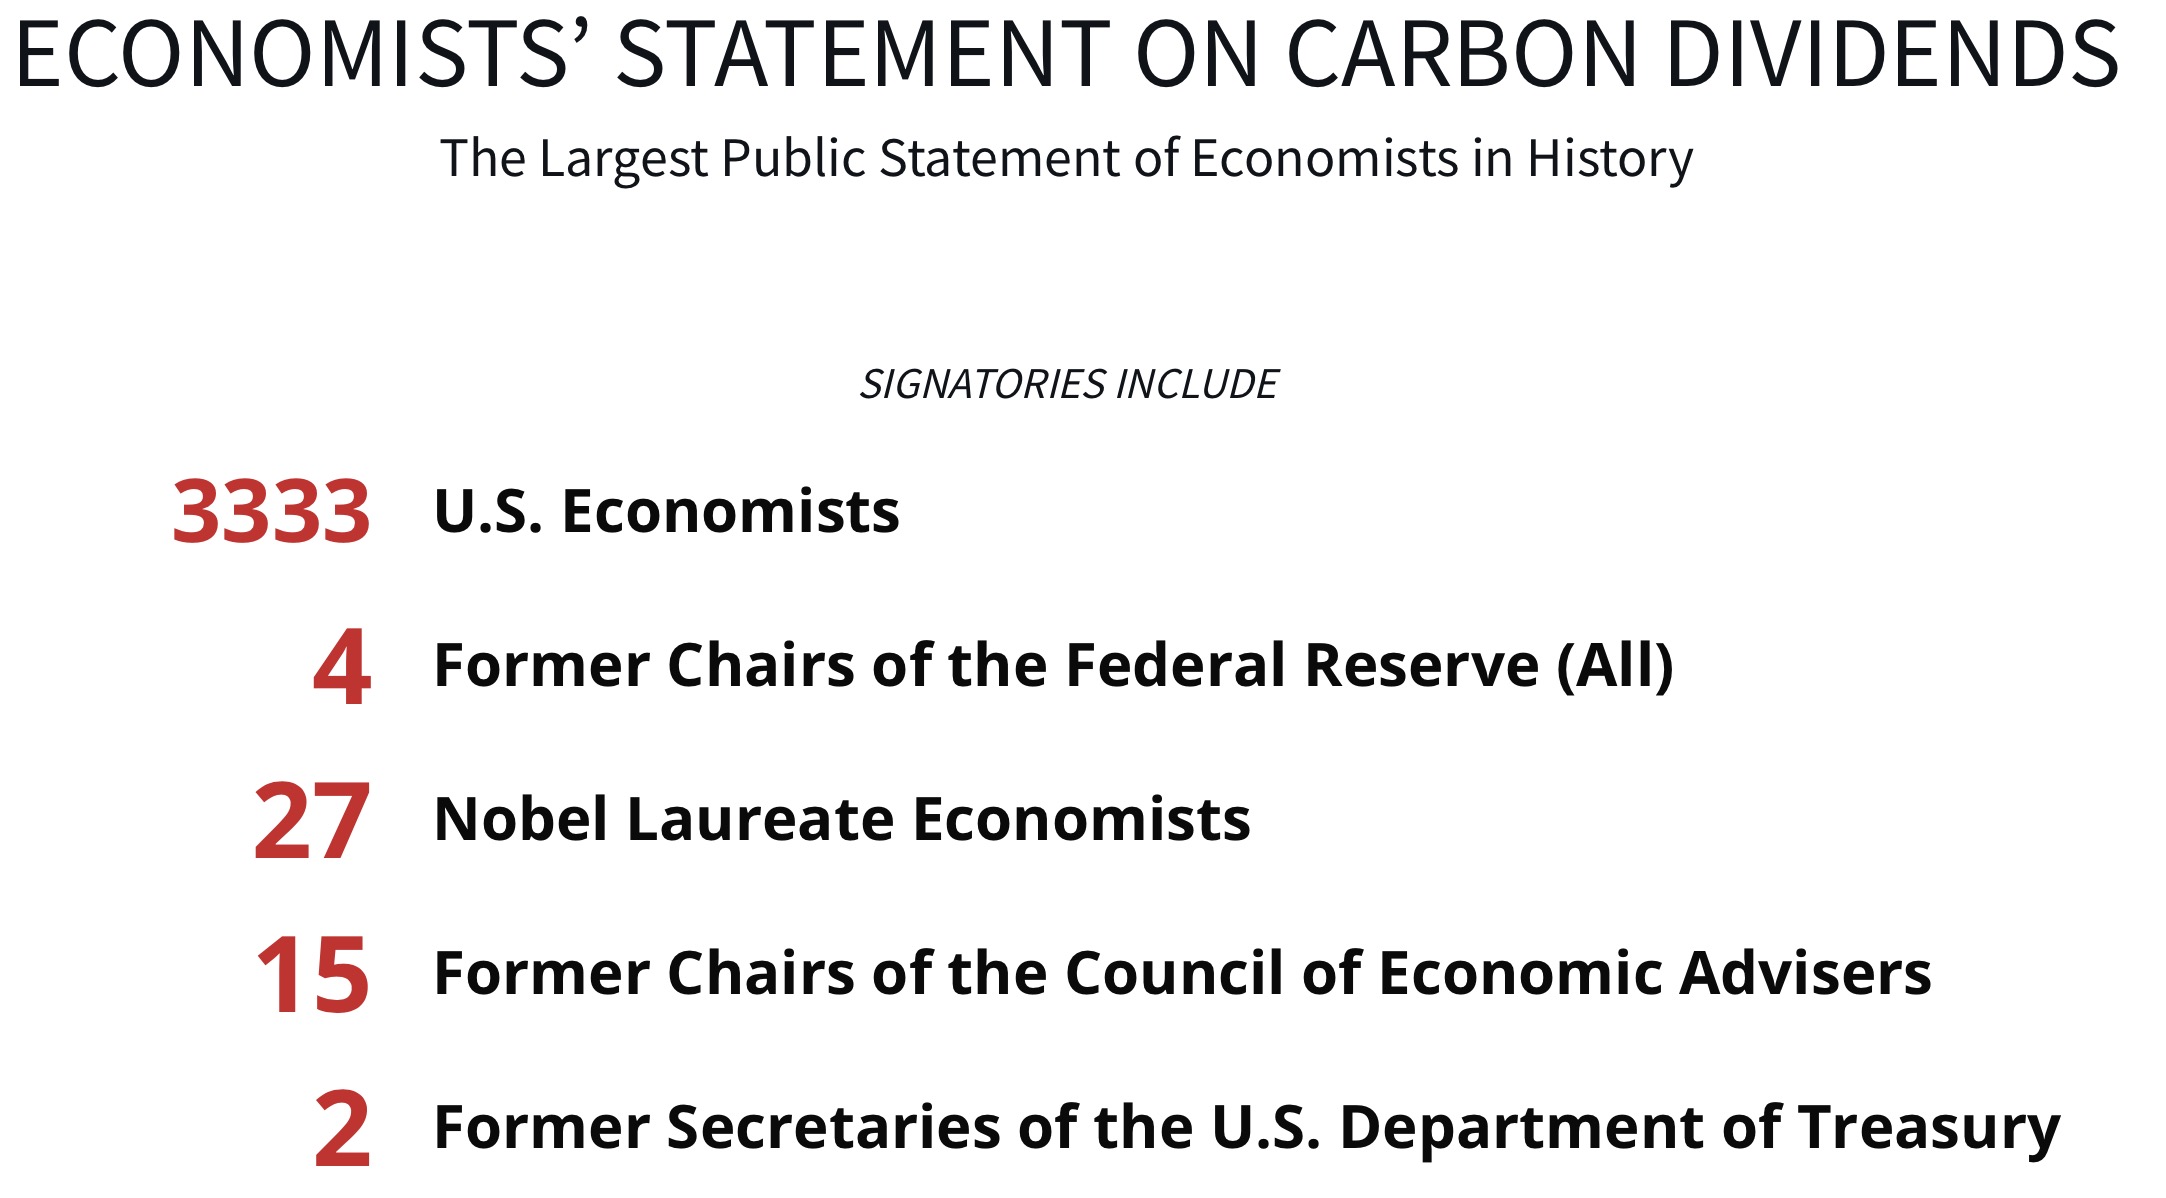
If you heard that thousands of the very best economists actually did agree on something, you’d probably think that it was something glaringly obvious—maybe they issued a joint statement condemning the designated hitter rule or calling for a total ban on Super Bowl halftime shows. But those aren’t the subject of the recent “Economists’ Statement on Carbon Dividends,” signed by 3,508 economists and released by the Climate Leadership Council. The statement supports the creation of a Pigouvian tax on U.S. carbon emissions on the grounds that “global climate change is a serious problem calling for immediate national action,” and that “a carbon tax offers the most cost-effective lever to reduce carbon emissions at the scale and speed that is necessary.”

This agreement is remarkable! The environment and the economy are both complex systems. Intelligent people can agree on a few things involving them—of course, manmade global warming is real—but there is vast uncertainty about how the complex climate system interacts with the complex economic system to shape the human condition in the distant future. More importantly, core questions about climate change engage fundamental moral values about intergenerational equity. How to deal with climate change is the very epitome of a “wicked problem.”

[Note: Intelligent people also note that in the world (as opposed to models) manmade global warming has yet to be detected separately from natural global warming. I understand the author is not questioning the science or the impacts (later on), but is raising serious issues about the policy proposal.]

This is a serious proposal advanced by serious people to deal with a serious problem. But it is also a radical proposal. According to a joint study by Columbia University’s Center on Global Energy Policy and the Urban Institute–Brookings Institution Tax Policy Center, in the first year the tax would amount to about $2,000 for a family of four. No matter what is done with the tax revenues, this proposal would have far-reaching economic consequences.

And so, before we get too far along, we need a proper argument over this proposal’s merits. Here, then, are five important questions about the plan. Let’s hope these questions lead to some disagreeable, but fruitful, discussions.

QUESTION 1: What if these economists are right about the principle but wrong about the tax rate?

The principle behind the carbon tax makes perfect economic sense. The market price of any good reflects at least some of the costs of making that good. The price of a gallon of gas, for example, needs to be high enough to compensate all those who worked to get the gas into your car. But some goods—and gasoline is one of them—impose costs on others that are not reflected in the price. Economists call these costs “negative externalities.” If burning a gallon of gas causes damage to coastal property, drivers are not paying the full price of their consumption and that distorts their consumption choices. That’s unfair and inefficient.

The obvious solution is to levy a Pigouvian tax equal to the harm caused, forcing consumers to shoulder the externality cost of their consumption and, perhaps, change their consumption pattern. But we have very little idea of the magnitude of the actual harm from a ton of CO2 emissions and so we don’t really know how high this carbon tax should be. Estimates of the “Social Cost of Carbon” published by the U.S. Environmental Protection Agency indicate that a ton of CO2-equivalent released in 2020 could cause harm of as little as $5 or as much as $123. (This roughly translates to a range of between 4¢ and $1 of damage from the burning of a gallon of gas.) The $40-per-ton tax suggested by the Statement signatories is a kind of average of several disparate estimates. As such, it is almost certainly the wrong number.

These economists will, no doubt, point out that the current carbon tax of zero is also wrong. But that observation, alone, is not enough to justify the proposed tax because setting the rate in excess of the actual external harm would cause real economic damage.

The economic argument in favor of carbon taxes needs to be coupled with a clear understanding that cheap, abundant energy has been an essential part of recent human progress. Fossil fuels provide food, shelter, health care, education, the arts, and countless other goods. They are not some vile poison, and consuming fossil fuels is not a shameful sin. When something is taxed, less is consumed. If, as seems likely, we consume too much energy from carbon-based resources, a tax can help to moderate that consumption appropriately. But if the tax is too high, we will consume too little. If we consume too little, we will miss out on some of the benefits that come from fossil fuels.

Here’s another problem related to the practical question of the appropriate carbon tax rate: Many fossil fuels are already heavily taxed. For example, the average tax on motor fuels is now about 48¢ per gallon, the equivalent to a tax of $54 per ton of carbon. These taxes exist mostly to raise revenue for transportation infrastructure, not control some other externality. Should the proposed new carbon tax be in addition to those existing taxes?

QUESTION 2: Should the United States impose carbon taxes even if the rest of the world does not?

In 2019 the world will produce a bit more than 35 gigatons of CO2-equivalent emissions. The United States will contribute about 5 gigatons to that total. The U.S. Department of Energy forecasts that, in 2040, world emissions will increase to 43 gigatons while U.S. emissions will drop by a small amount. A 2018 report by the Center on Global Energy Policy at Columbia University forecasts that if we impose a tax of $50 per ton of carbon in 2020 and increase that tax by 2% per year, annual U.S. emissions will fall by 13%–29% by 2030. But by 2030, U.S. emissions will be less than 15% of the world total. Even under the best-case scenario, our carbon tax would reduce global emissions by less than 5% and climate change will continue.

If the rest of the world doesn’t join us, the U.S. carbon tax won’t matter. This leads to a related problem. If the United States levies a carbon tax, it becomes more expensive for U.S. firms to make and transport goods. That means a U.S. carbon tax will reward those countries that don’t do anything to reduce their emissions by giving those places a competitive advantage. Exploiting that advantage will likely be too much of a temptation for others—especially developing countries with desperately poor people—to ignore. It is even possible that by pushing energy-intensive production to places with no controls on carbon emissions, this policy will make global emissions worse.

QUESTION 3: Doesn’t the “border-adjustment tax” that has to be part of the plan present enormous practical and political problems?

This carbon tax should not just apply to U.S. emissions, but to foreign emissions resulting from goods imported into the United States. Assessing a border-adjustment tax on these goods would be difficult from both an economic and political perspective. For example, almost 5% of the world’s carbon emissions result from the production of cement. But different production technologies for cement and different modes of transportation result in vastly different emissions. Even though two different shipments of cement may be practically identical, they won’t have similar carbon footprints. How would U.S. authorities determine which bags of cement face what tax rates?

The political problems are also tough. First of all, to the rest of the world a border-adjustment tax would seem like a tariff. How would we impose this tax without violating treaty obligations and without inviting retaliation? Second, how would we keep the crony capitalists away from the treats? The temptation to game the system for competitive advantage would be enormous.

QUESTION 4: What about adaptation?

All but the most apocalyptic of the potential harms from global warming can be managed through some type of adaptation to the changing climate. Building practices, for example, can be changed to deal with the threat of rising sea levels. There is also the possibility of some sort of geo-engineering solution. Remember that atmospheric CO2 is an otherwise harmless substance and that the burning of fossil fuels is enormously valuable. This means that if it is less costly to adapt to the effects of a ton of CO2 emissions than it is to eliminate the carbon, we should adapt. But to the extent that the carbon tax actually works to reduce CO2 emissions, it creates disincentives to adapt.

The proponents of a tax might say that the estimates of the Social Cost of Carbon already balance adaptation costs. The problem with that argument, though, is that the most effective adaptation solutions probably haven’t been created. New technologies to deal with climate change—altering agriculture practices, geo-engineering solutions, and other initiatives we can’t currently imagine— may well prove extraordinarily effective and efficient. An effective carbon tax reduces the incentive to find those solutions that allow us to enjoy the benefits of fossil fuel use without much cost.

QUESTION 5: Isn’t economic growth much more important than lowering CO2?

Every four years, a distinguished group of analysts delivers to Congress the “National Climate Assessment.” The latest version came out last November and was full of sobering projections. Anyone who chooses to ignore the threat of global warming should read what it has to say. Among the direst warnings was a graphic showing that if the worst-case scenario played out, by 2100 the effects of global warming would reduce U.S. gross domestic product by about 15% from current projections. To put that number in perspective, during the 2008 recession GDP fell by about 1%. That was accompanied by huge increases in unemployment and economic dislocation. Between 1929 and 1933, the worst years of the Great Depression, GDP fell by about 34%. That led to tremendous misery and, arguably, a world war. Remember, too, that the potential decline of 15% of GDP in 2100 isn’t just a short-term event. As bad as the Great Depression was, the economy recovered. The scary scenario is that by failing to address global warming, we will cause future generations to suffer a huge permanent decline in GDP.

But there’s another thing to keep in mind: if the United States could boost annual GDP growth rates between now and 2100 by an additional 0.2 percentage points, by the year 2100 U.S. GDP would be more than 17% larger than is currently projected. Think about it this way: Suppose that you had to pick between two tax policies. The first would reduce U.S. carbon emissions and maybe prevent the potential loss of 15% of GDP by 2100. The second would increase annual growth rates by 0.2 percentage points, increasing GDP by 17% by 2100.

As you’re picking between the choices, keep in mind that even if the carbon policy controls U.S. emissions, it is uncertain whether the rest of the world will go along and climate change will stop. Remember, too, that there is huge uncertainty about the specifics of global warming. The carbon emissions policies target the worst-case scenario. The GDP growth policy, on the other hand, doesn’t depend on the rest of the world and the benefits are guaranteed by the simple mathematics of compound growth.

Don’t try to waive off this choice by saying you want to do it all. We all want many things, but what we can have is bounded by our scarce resources. This particular group of distinguished economists has—quite deservedly—an impressive stock of political capital and prestige. But political capital and prestige are two such scarce resources. Why target carbon taxes rather than growth-enhancing tax reform?

Climate lemmings sticking together.

CONCLUSION

Let’s end where we started, with a call for a conversation. These five questions aren’t intended as some snarky put-down of a silly economic proposal. No good economist—and certainly none of the 3,508 who signed the Statement—should feel disrespectfully challenged by these questions. There are intelligent responses to each of these questions. And at the end of the discussion, we should all have a better idea about whether the answers are good enough to go ahead with the tax.

Trump Just Cured Health Care (No One Noticed)

The Editorial Board of Issues and Insights tells the story ignored by others in their article Trump Just Revolutionized Health Care — And Nobody Noticed. Excerpts in italics with my bolds.

Few have ever heard of “Health Reimbursement Accounts,” but they could fundamentally change the nation’s health care system — for the better — and destroy the Democrats’ case for socialized health care.

Late last week, the Trump administration finalized rules that will let companies put money into tax-exempt HRAs that their employees could then use to buy an individual insurance plan on their own. Seems like no big deal, right? Except it will start to unravel a 77-year-old policy mistake that is largely responsible for many of the problems the health care system suffers today.

Back in 1942, the Roosevelt administration imposed wage and price controls on the economy. But it exempted employer-provided benefits like health insurance, and the IRS later decreed that these benefits wouldn’t be taxed as income.

The result was to massively tilt the health insurance playing field toward employer-provided insurance. Today 88% of those with private insurance get it at work.

The massive tax subsidy — now valued at more than $300 billion — also encouraged overly generous health plans, because any health care paid by insurers was tax exempt, while out of pocket spending had to come from after-tax dollars.

So not only did this Roosevelt-era mistake create an employer-dominated health insurance market, it made consumers largely indifferent to the cost of care, since the vast bulk of it was picked up by a third party.

But while health care experts across the political spectrum recognize this mistake, Democrats’ response has been to get the government even more involved in health care, with the latest proposal a total government takeover under the guise of “Medicare for All.”

Republicans, to their credit, have been pushing in the opposite direction. The introduction of Health Savings Accounts — a GOP reform idea Democrats fiercely opposed — 14 years ago helped to remedy one of the tax distortions, by allowing some people to pay out of pocket costs with pre-tax money.

Even with all the restrictions Congress put on HSAs, the market for high-deductible HSA plans exploded — climbing from nothing in 2005 to nearly 30% of the employer market today. By the end of last years, consumers had saved up $10 billion in these accounts.

The rise in these “consumer directed” plans was at least partially responsible for the slow-down in health spending in recent years, according to official government reports, as consumers increasingly started shopping around.

Trump’s HRA rules will have a far more profound impact.

Under the plan, employers will be able to fund tax-free Health Reimbursement Accounts for their workers, who can then use the money to buy an individual insurance plan — thereby taking another step toward fixing the 77-year-old tax distortion. The rule also lets employers fund a different account to buy cheaper “short-term” plans.

This subtle, technical tweak has the potential to revolutionize the private health insurance market,” wrote Avik Roy, one of the smartest health care experts around, in the Washington Post.

The administration figures that 800,000 employers will eventually move to HRA plans, and 11 million workers will get their benefits this way.

At the same time, Trump also loosened the federal rules that had needlessly impeded “association health plans.” These are plans that let members of various groups band together to buy insurance. The result will be more competition, and more affordable choices for millions of people.

The Democrats’ response? Attack these changes as another attempt by Trump to “sabotage” Obamacare. What they really fear, however, is that the two new rules will destroy their case for socialized medicine.

As Roy put: “Together, over time, these changes would give workers more transparency into — and more control over — the health-care dollars that are now spent by other people on their behalf. That transparency and control, in turn, would create a powerful market incentive for health-care payers and providers to lower prices and increase quality.”

Once that happens, the last thing these millions of newly empowered health care shoppers will want is to be shuffled into a one-size-fits-all government plan designed for the masses by socialists like Bernie Sanders.

H20 the Gorilla Climate Molecule

In climate discussions, someone is bound to say: Climate is a lot more than temperatures. And of course, they are right. So let’s consider the other major determinant of climate, precipitation.

The chart above is actually a screen capture of real-time measurements of precipitable water in the atmosphere.  The 24-hour animation can be accessed at MIMIC-TPW ver.2 .  H/T Ireneusz Palmowski, who commented:  “I do not understand why scientists deal with anthropogenic CO2, although the entire convection in the troposphere is driven by water vapor (and ozone in high latitudes).”

These images show that H2O is driving the heat engine through its phase changes (liquid to vapor to liquid (and sometimes ice crystals as well).  And as far as radiative heat transfer is concerned, 95% of it is done by water molecules.  Below is an essay going into the dynamics of precipitation, its variability over the earth’s surface, and its role in determining regional, and even microclimates.  The post was originally titled “Here Comes the Rain Again, inspired by the Eurythmics classic song

The global story on rain is straightforward:

“Precipitation is a major component of the water cycle, and is responsible for depositing the fresh water on the planet. Approximately 505,000 cubic kilometres (121,000 cu mi) of water falls as precipitation each year; 398,000 cubic kilometres (95,000 cu mi) of it over the oceans. Given the Earth’s surface area, that means the globally averaged annual precipitation is 990 millimetres (39 in). Climate classification systems such as the Köppen climate classification system use average annual rainfall to help differentiate between differing climate regimes.

http://en.wikipedia.org/wiki/Precipitation_(meteorology)

Globally, average precipitation can vary from +/-5% yearly, but there is no particular trend in the history of observations. But rain is one of those things where averages don’t tell you much. For starters, look at where it’s coming down:

So about 1 meter a year is the nominal average of all rain over all surfaces. Some places get up to 10 meters of rain (about 400 inches ) and others get near none. 47% of the earth is considered dryland, defined as anyplace where the rate of evaporation/transpiration exceeds the rate of precipitation. A desert is defined as a dryland with less than 25 cm of precipitation. In the image above, polar deserts are remarkably defined. It just does not have much hope of precipitation as there is little heat to move the water. More heat in, more water movement. Less heat in, less water movement.

Then there’s the seasonal patterns. The band of maximum rains moves with the sun: More north in June, more south in December. More sun, more heating, more rain. Movement in sync with the sun, little time delay. Equatorial max solar heat has max rains. Polar zones minimal heating, minimal precipitation. It’s a very tightly coupled system with low time lags.

The other obvious thing is how central land areas get dry desert conditions if they are not in the equatorial band nor near a warm water current. Brazil, in particular, benefits from warm coastal waters and near equatorial rains. The Gulf Stream rescues Europe from a much drier climate, but I fear the Gulf Stream shifting of zones also puts parts of Saharan Africa out of the equatorial wet. (In some times during history it DOES get a load of water, though…)
From E.M. Smith
https://chiefio.wordpress.com/2011/11/01/what-does-precipitation-say-about-heat-flow/

How do Oceans Make Rain

Here I am taking direction from A. M Makarieva and her colleagues. She explains:

“Water vapor originating by evaporation sustained by solar radiation represents a source of ordered potential energy that is available for generation of atmospheric circulation, including the biotic pump. We will further consider details of this process.

As we can see, early in its life the cloud expands in all directions, meanwhile the air continues to converge towards the (growing) condensation area. This process is at the core of condensation-induced dynamics: as condensation occurs and local pressure drops, this initiates convergence and ascent. They, in their turn, feedback positively on condensation intensity, such that the air pressure lowers further, convergence becomes more extensive and so on — as long as there is enough water vapor around to feed the process.

And where does the water vapor come from? Ocean evaporation, 87%, Plant transpiration 10% , Other evaporation, lakes, rivers, etc. 3%.

Air circulation without condensation (A) and with condensation (B). Gray squares are the air volumes, which in case (B) contain water vapor shown by small blue squares inside gray ones. White squares indicate those air volumes that have lost their water vapor owing to condensation. Blue arrows at the Earth’s surface represent evaporation that replenishes the store of water vapor in the circulating air.

On Fig. B we can see a circulation accompanied by water vapor condensation (water vapor is shown by blue squares). At a certain height water vapor condenses leaving the gaseous phase, while the remaining air continues to circulate deprived of water vapor (this depletion is shown by empty white squares): it first rises and then descends. As one can see, in such a circulation total mass of the rising air would be larger than total mass of the descending air (cf. an escalator transporting people up). The motor driving such a circulation would not only have to compensate the friction losses, but also have to work against gravity that is acting on the ascending air.

One can see from Fig. B that the difference between the cumulative masses of the ascending and descending air parcels grows with increasing height where condensation occurs. This difference also grows with increasing amount of water vapor in the air (i.e. with increasing size of the blue squares). The dynamic power of condensation, on the other hand, is also proportional to the amount of water vapor, but it is practically independent of condensation height.

Condensation height (a proxy for precipitation pathlength) grows with increasing temperature of the Earth’s surface. It is shown in the paper that power losses associated with precipitation of condensate particles become equal to the total dynamic power of condensation at surface temperatures around 50 degrees Celsius. Since the observed power of condensation-driven winds is equal to the total dynamic power of condensation (the “motor”) minus the power spent on compensating precipitation, at such temperatures the observed circulation power becomes zero and the circulation must stop. For commonly observed values of surface temperature these losses do no exceed 40% of condensation power and cannot arrest the condensation-induced circulation. Over 60% of condensation power is spent on friction at the Earth’s surface.

Why Some Places Get More Rain Than Others

This figure shows the “tug-of-war” between the forest and the ocean for the right to become a predominant condensation zone. In Fig. a: on average the Amazon and Congo forests win this war: annual precipitation over forests is two to three times larger than the precipitation over the Atlantic Ocean at the same latitude. Note the logarithmic scale on the vertical axis: “1” means that the land/ocean precipitation ratio is equal to e = 2.718, “2” means it is equal to e2 ≈ 7.4; “0” means that this ratio is unity (equal precipitation on land and the ocean); “-1” means this ratio is 1/e ≈ 0.4; and so on.

In Fig. b: the Eurasian biotic pump. In winter the forest sleeps, so the ocean wins, and all moisture remains over the ocean and precipitates there. In summer, when trees are active, moisture is taken from the ocean and distributed regularly over seven thousand kilometers. The forest wins! (compare the red and black lines) As a result, precipitation over the ocean in summer is lower than it is in winter, despite the temperature in summer is higher.

Finally, in panel (c): an unforested Australia. One can often hear that Australia is so dry because it is situated in the descending branch of the Hadley cell. But this figure shows that such an interpretation does not hold. Both in wet and dry seasons precipitation over Australia is four to six times lower than over the ocean. There is no biotic pump there. Being unforested, oceanic moisture cannot penetrate to the Australian continent irrespective of how much moisture there is over the ocean; during the wet season it precipitates in the coastal zones causing floods. Gradually restoring natural forests in Australia from coast to interior will recover the hydrological cycle on the continent.

http://www.bioticregulation.ru/pump/pump9.php

biotic pump

The Biotic Pump A. M Makarieva et al

Water cycle on land owes itself to the atmospheric moisture transport from the ocean. Properties of the aerial rivers that ensure the “run-in” of water vapor inland to compensate for the gravitational “run-off” of liquid water from land to the ocean are of direct relevance for the regional water availability. The biotic pump concept clarifies why the moist aerial rivers flow readily from ocean to land when the latter gives home to a large forest — and why they are reluctant to do so when the forest is absent.

While it is increasingly common to blame global change for any regional water cycle disruption, the biotic pump evidence suggests that the burden of responsibility rather rests with the regional land use practices. On large areas on both sides of the Atlantic Ocean, temperate and boreal forests are intensely harvested for timber and biofuel. These forests are artificially maintained in the early successional stages and are never allowed to recover to the natural climax state. The water regulation potential of such forests is low, while their susceptibility to fires and pests is high.

https://2s3c.wordpress.com/2012/04/22/taac/

Conclusion

So the oceans make rain, and together with the forests the land receives its necessary fresh water. There is a threat from human activity, but it has nothing to do with CO2. Land use practices leading to deforestation have the potential to disrupt this process. Without trees attracting the moist air from the ocean there is desert.

Ironically, modern societies burn fossil fuels instead of burning the forests as in the past.

For more on climate science related to H2O, see Bill Gray: H20 is Climate Control Knob, not CO2

When did global warming start?

Here is the answer provided by Steve Maley on Quora. The response is in italics with my bolds and images.

Fig. 10. The 105 year time series of filtered monthly average temperatures (ºC) for the Des Moines, IA station plotted a) versus time in months (years also added) b) first derivative of temperature (ºC mo-1) versus temperature (ºC) c), and d) as power spectra, with the ordinate displaying the relative magnitude or power of the Fourier and wavelet coefficients, respectively, and the abscissa displaying the period of each cycle in years. In addition, the 95% confidence level against the white noise background continuum is shown by the dashed line.

Global Warming began in Muncie, Indiana on June 17, 1953 at 2:30 in the afternoon. It was a Tuesday.

Up until that time, weather was “average” all the time.

That is, except for the Dust Bowl, the Little Ice Age, Medieval Warm Period, etc.

Up until then, people had ideal, sustainable lifestyles. 90% of men spent all day in the fields looking at the backsides of two mules. Their spare time was spent chopping wood in hopes they could make it through another winter.

Women stayed at home and had babies. They had to have 8–10 because 2 or 3 of them wouldn’t live to see their 10th birthday.

Farm to Table was a thing. Since nobody had any money, it was a choice between raising your own food or starving.

Yes, it was an idyllic lifestyle. Damn fossil fuels screwed it all up.

How? By changing the atmosphere. Gases other than CO2 used to be 99.97% of the air we breathe. Now it’s 99.96%.

The horror.

Fort Lauderdale Repels Climate Pirates

This just in from Erin Mundahl writing at Energy In Depth Fort Lauderdale Deals Another Blow to Climate Litigation Campaign. The article will appear below in italics with my bolds. But first some background.

Background on Climate Piracy

Those paying attention have noticed for some years now a new type of pirate has emerged: Climate Lawyers. Taking their game plan from the Tobacco Pirates, they are now targeting a different set of deep pockets: Big Oil Companies. Since 30+ Billion US dollars were extracted from tobacco companies (including contingency fees to lawyers), a comparable, if not larger payday is sought by these new corporate raiders. Unlike Somali pirates who attacked the tankers themselves, Climate Lawyers are using the courts to sue Big Oil for damages their products cause consumers. In order to succeed in these lawsuits, they recruit jurisdictions like states or cities to claim they have been victimized by having fossil fuel products imposed upon them.

[Full Disclosure: The photo above symbolically depicts Climate Lawyers in the boat confronting an oil tanker, when in fact they won’t get their suits wet. The original image was a Greenpeace zodiac]

Fort Lauderdale Stands Up Against Pressure from Climate Lawyers

It’s a bright day for Fort Lauderdale. Despite a full-court press by climate activists, city officials have decided not to pursue a climate liability lawsuit. This is a blow for climate activists, who are hoping to expand their litigation campaign into Florida.

Over the past six months, lawyers and environmental groups have devoted considerable time and effort to persuading cities in the Sunshine State to join their quixotic climate litigation campaign. Despite their efforts, Fort Lauderdale was not convinced.

EarthRights International hides behind NGO to lobby city officials.

Released emails show that EarthRights International, the Rockefeller-funded organization representing the City and County of Boulder and San Miguel County in their climate change lawsuit, and the Institute for Governance and Sustainable Development (IGSD) coordinated to lobby Fort Lauderdale city officials throughout 2018.

In June, Mayor Dean Trantalis and his chief of staff, Scott Wyman, received emails from a Miami Beach lobbyist, Seth Platt. Platt was hired to represent IGSD, which runs the Center for Climate Integrity, a project that “supports meritorious climate cases aimed at holding fossil fuel companies and other climate polluters liable for the damages they have caused.” The emails show that Platt was eager to introduce Trantalis and Wyman to EarthRights International (ERI) and their agent, Jorge Musuli, who Platt said was working with the City of Miami to file a climate nuisance lawsuit:

“I have invited Jorge Mursuli to the meeting as his group, [ERI], is working with the City of Miami to file a lawsuit. We are trying to collaborate on advocacy in Broward.”

Sher Edling joins EarthRights International in their pursuit

In a surprising twist of fate, ERI added another plaintiffs’ attorney firm involved in climate litigation, Sher Edling, as co-counsel in their pursuit of the city. By July, Seth Platt had arranged for Vic Sher and Matt Edling, who represent more than a dozen cities in climate cases, to join ERI for a meeting with Fort Lauderdale City Attorney Alain Boileau. After the meeting, Boileau followed up with the mayor, telling his boss about the “positive meeting” he had had with Sher, Edling, Marco Simons (general counsel for ERI), and Mursuli, all thanks to Platt.

Records show that Platt conducted all of these meetings on behalf of the Institute for Governance & Sustainable Development – not ERI. When pressed on this by local reporters, Platt did not respond.

IGSD finds itself at the center of the climate litigation campaign…. again

Platt’s lobbying affiliation highlights the well-coordinated network of climate activism aimed at taking down fossil fuels by any means necessary. IGSD is a key player in a carefully organized media campaign that rehashes a stale, repeatedly debunked story for the sake of silencing dissent . Richard Wiles, who serves as the ringleader for their climate litigation campaign, produced the IGSD-funded podcast Drilled and published Climate Liability News, an activist site designed to promote climate litigation.

ERI fails to impress the City Commission

In October ERI General Counsel Marco Simons gave a presentation to Trantalis and the Fort Lauderdale City Commission. The meeting was a full court press that emphasized how climate change could hurt city finances and how wealthy anti-fossil fuel foundations were willing to foot the bill for the lawsuit. Simons explained their strategy during the pitch:

At the litigation stage it would be necessary to join together with co-counsel from private firms. They would be interested in pursuing this on a contingency fee-basis… And it would be a combination of our pro-bono representation and a private firm, contingent fee representation, again with no up-front cost to the city and that’s the model that’s been done in all of these cases so far.”

Thankfully, Fort Lauderdale decided to resist the pressure. Despite the focus Simons put on how the lawsuit could financially benefit the city, it would tie the city up in litigation for months or years, taking attention away from much needed resiliency projects. So far, none of the plaintiffs – or the cities – pursuing climate litigation across the country have seen a dime. Meanwhile, the major green donors financing the pro bono legal work are using the lawsuits to promote their own climate agenda, both in the courtroom and the court of public opinion.

Local voices also reject lawsuits

Over the past several months, op-ed pieces in papers around Florida have emphasized that suing energy companies distracts attention from the harms of climate change and discourages cooperation between industry and government. In a Naples Daily News op-ed this spring, Sal Nuzzo of the Tallahassee-based James Madison Institute, criticized using lawsuits to develop state policy, instead pushing for cooperation between businesses and government for environmental issues:

“For policies to succeed, public officials must work with business…Florida’s unemployment rate is low and our economy is growing at a faster pace than the U.S. economy overall in part because our tax and regulatory burdens are lower than many other states. A hostile approach toward manufacturers would ill serve our state and hinder efforts to address environmental issues.”

Not only does litigation waste taxpayer money, it also distracts from state-level policies that are making meaningful improvements to Florida’s environment. Florida Governor Ron DeSantis (R) “went green” in the words of political columnist Barney Bishop, who wrote in the Sunshine State News to praise the governor for his plan to invest heavily in resiliency efforts and Everglades restoration and water cleanup, an approach he contrasted with that of “public officials working hand in hand with activists”:

“The reality is that real-life actions like the ones being taken by Gov. Ron DeSantis are the best way to help our environment. Lawsuits such as these offer no real benefit and only serve to threaten American companies and American jobs.”

It’s a good thing Fort Lauderdale saw through the scam.

See also US State Attorneys Push Back on Climate Lawsuits

See also Is Global Warming A Public Nuisance?

Climate Models on Fire!

They are at it again: Our future will be filled with death and destruction according to climate models. The latest doomsday scenario is that every summer in the future will be hotter than the one before, brought to you by CNN: “All the Fear All the Time.”

Future summers will ‘smash’ temperature records every year says CNN. Excerpts in italics with my bolds.

If you think it’s hot now, you haven’t seen anything yet. A new study predicts that parts of the world will “smash” temperature records every year in the coming century due to climate change, “pushing ecosystems and communities beyond their ability to cope.”

The scientists who authored the study, published in the journal Nature Climate Change on Monday, used 22 climate models to game out exactly how hot these summer temperatures would be. They determined that by the end of the 21st century, future temperature events “will be so extreme that they will not have been experienced previously.”

The temperature increase is directly tied to rising global greenhouse gas emissions, the authors say.

The world is already seeing record setting temperatures and while warming hasn’t been uniform, earlier studies have shown that the planet has been in a warming trend, generally.

Heat waves will be deadly. Heat stroke, breathing issues, heart attacks, asthma attacks, kidney problems are all a big concern for people when the temperatures increase, according to the US Centers for Disease Control and Prevention.

Higher temperatures can also make air pollution worse, make water scarce and cause crops to fail, leading to malnutrition and starvation.

In 2014, the World Health Organization predicted 250,000 more people will die annually between 2030 and 2050 due to climate change. More recent studies predict that this is a “conservative estimate.”

If, however, countries meet goals of limiting global temperature rise less than 2 degrees Celsius, as set out in the Paris agreement, that scenario would be much less likely.

Footnote: A second separate heat wave alarm study was published and trumpeted in the Seattle Times. (H/T kakatoa, comment below) Cliff Mass does his usual thorough review pointing out problems both in the estimating of future temperatures and in calculating projected deaths from heat waves.

The article by Mass is The Seattle Times Story on Massive Heat Wave Deaths in Seattle: Does it Make Sense?


Trudeau’s Empty Plastic Gesture

Bjorn Lomborg writes in the Globe and Mail about Canadian PM Justin Treudeau showing off by proposing to ban single-use plastics. Sorry, banning plastic bags won’t save our planet. Excerpts in italics with my bolds.

Last week, Prime Minister Justin Trudeau announced a plan to reduce plastic pollution, which will include a ban on single-use plastics as early as 2021. This is laudable: plastics clog drains and cause floods, litter nature and kill animals and birds.

Of course, plastic also makes our lives better in a myriad of ways. In just four decades, plastic packaging has become ubiquitous because it keeps everything from cereals to juice fresher and reduces transportation losses, while one-use plastics in the medical sector have made syringes, pill bottles and diagnostic equipment more safe.

Going without disposable plastic entirely would leave us worse off, so we need to tackle the problems without losing all of the benefits.

The simplest action for consumers is to ensure that plastic is collected and used, so a grocery bag, for example, has a second life as a trash bag, and is then used for energy.

But we need to be honest about how much consumers can achieve. As with other environmental issues, instead of tackling the big-picture problems to actually reduce the plastic load going into oceans, we focus on relatively minor changes involving consumers, meaning we only ever tinker at the margins.

More than 20 countries have taken the showy action of banning plastic bags, including even an al-Qaeda-backed terrorist group which said plastic bags pose “a serious threat to the well-being of humans and animals alike.”

But even if every country banned plastic bags it would not make much of a difference, since plastic bags make up less than 0.8 per cent of the mass of plastic currently afloat on the world’s oceans.

Rather than trying to save the oceans with such bans in rich countries, we need to focus on tackling the inferior waste management and poor environmental policies in developing regions.

Research from 2015 shows that less than 5 per cent of land-based plastic waste going into the ocean comes from OECD countries, with half coming from just four countries: China, Indonesia, Philippines and Vietnam. While China already in 2008 banned thin plastic bags and put a tax on thicker ones, it is estimated to contribute more than 27 per cent of all marine plastic pollution originating from land.

Moreover, banning plastic bags can have unexpected, inconvenient results. A new study shows California’s ban eliminates 40 million pounds of plastic annually. However, many banned bags would have been reused for trash, so consumption of trash bags went up by 12 million pounds, reducing the benefit. It also increased consumption of paper bags by twice the saved amount of plastic – 83 million pounds. This will lead to much larger emissions of CO₂.

When Kenya banned plastic bags, people predictably shifted to thicker bags made of synthetic fabric – which now may be banned. But Kenya had to relent and exempt plastics used to wrap fresh foods such as meat and other products.

We also need to consider the wider environmental impact of our bag choices. A 2018 study by the Danish Ministry of Environment and Food looked not just at plastic waste, but also at climate-change damage, ozone depletion, human toxicity and other indicators. It found you must reuse an organic cotton shopping bag 20,000 times before it will have less climate damage than a plastic bag.

If we use the same shopping bag every single time we go to the store, twice every week, it will still take 191 years before the overall environmental effect of using the cotton bag is less than if we had just used plastic.

Even a simple paper bag requires 43 reuses to be better for the environment – far beyond the point at which the bag will be fit for the purpose.

The study clearly shows that a simple plastic bag, reused as a trash bag, has the smallest environmental impact of any of the choices.

If we want to reduce the impact of plastic bags while still allowing for their efficient use, a tax seems like a much better idea. A 2002 levy in Ireland reduced plastic bag use from 328 bags a person per year to just 21 bags.

And if we really want to make a meaningful impact on ocean plastics coming from land, we should focus on the biggest polluters such as China, Indonesia, Philippines and Vietnam, and emphasize the most effective ways to cut the plastic load, namely better waste management in the developing world.

We should also recognize that more than 70 per cent of all plastics floating on oceans today – about 190,000 tonnes – come from fisheries, with buoys and lines making up the majority. That tells us clearly that concerted action is needed to clean up the fishing industry.

If our goal is to get a cleaner ocean, we should by all means think about actions we can take as consumers in rich countries to reduce our use of unnecessary plastic bags. But we need to keep a sense of proportion and, if we’re serious, focus on change where it’s really needed.

Bjorn Lomborg is president of the Copenhagen Consensus Center.

See Also Plastic Trash Talking

Waste Management Saves the Ocean

Mid June Arctic Ice Lopsided

In the first half of June 2019, the shift from ice to water is unusually lop-sided in two respects. The image above, supported by the table later on shows that in the last two weeks water has opened up faster on the Pacific side, and much slower on the Atlantic side, with the exception of Baffin Bay.  The other surprise is that MASIE shows much less ice than does SII, a reversal of the typical situation.

The graph below shows the surprising discrepancy between MASIE and SII appearing in May and continuing in June.

Note that the  NH ice extent 12 year average declined from 12.7M km2 to 10.9M km2 during in the last 30 days.  MASIE 2019 shows about the same decline from 11.9M km2 to 10.3M km2.  That track matched 2016 in May, but is now closest to 2010 and below other years.  Interestingly SII showed a much slower rate of ice extent loss, starting nearly the same as MASIE, but ended this period 400k km2 higher. and close to average and 2018.

I have no explanation for the differential between MASIE and SII.  Note that ice extents in both datasets are levelling off mid-June.

Region 2019166 Day 166 Average 2019-Ave. 2010166 2019-2010
 (0) Northern_Hemisphere 10340833 10933549 -592716 10534077 -193244
 (1) Beaufort_Sea 761369 968193 -206823 933194 -171824
 (2) Chukchi_Sea 680432 799211 -118778 839873 -159441
 (3) East_Siberian_Sea 1049046 1054090 -5045 1068901 -19856
 (4) Laptev_Sea 750164 778536 -28372 772185 -22021
 (5) Kara_Sea 671900 722641 -50741 717539 -45640
 (6) Barents_Sea 261587 215180 46408 138264 123324
 (7) Greenland_Sea 549038 568045 -19007 524612 24426
 (8) Baffin_Bay_
Gulf_of_St._Lawrence
558105 733399 -175294 667457 -109352
 (9) Canadian_Archipelago 787036 798742 -11706 766642 20394
 (10) Hudson_Bay 1014530 1004832 9698 826781 187749
 (11) Central_Arctic 3229461 3221030 8431 3206453 23008
 (12) Bering_Sea 17768 33002 -15234 21317 -3550
 (13) Baltic_Sea 0 7 -7 0 0
 (14) Sea_of_Okhotsk 9381 35292 -25911 83076 -73695

The table shows where the ice is distributed to make the 5.4% defict to average.  Beaufort and Chukchi Seas are more than half of the NH deficit to average, while Baffin has lost 175k km2 to average.

Illustration by Eleanor Lutz shows Earth’s seasonal climate changes. If played in full screen, the four corners present views from top, bottom and sides.

Epic Science Fraud by Inept Journalist

Alex Berezow reminds why we cannot trust today’s journalists to tell the truth, especially regarding anything scientific. His article at American Council on Science and Health (ACSH) is La Croix And BPA: Journalist Celebrates That She Caused Millions In Losses. Excerpts in italics with my bolds.

Journalism is thoroughly inept and corrupt. The quality of journalism has gotten so bad that I have whittled down my trusted sources to merely a handful. Even then, when it comes to science, these sources often get it wrong.

The reason is two-fold: First, journalists aren’t experts in anything. Many of them went to journalism school, which taught them absolutely nothing useful. An editor at The Economist once told me that the newspaper did not hire journalism majors, preferring people who majored in “something real.” The craft of journalism can be learned on the job. Besides, as science communicator Mary Mangan once wrote, “Every crank in the crankosphere has either a politics degree or a journalism degree.”

Second, too many journalists believe their primary job is to “change the world” rather than “report the facts.” If it seems like many journalists behave like partisans or activists, it’s because they really are partisans and activists. Truth matters less than fulfilling an ideological mission. This attitude was summed up best by Michael Wolff, who once said, “If it rings true, it is true.” Really, who needs facts when you have feelings?

Putting this all together, we shouldn’t be surprised when a journalist goes on social media to celebrate when her (poor) reporting causes a company to lose hundreds of millions of dollars in market capitalization.

Business Insider Journalist Celebrates a Massive Loss of Wealth

La Croix is a popular beverage that I refuse to drink because I think it tastes like fizzy horse urine. But plenty of other people like it, which is one reason why its parent company, the National Beverage Corporation, has a market cap well over $2 billion.

Like several other high-profile companies, La Croix has been the target of a junk science lawsuit. The company was accused of using synthetic chemicals instead of natural ones as advertised, a distinction without a difference, as my colleague Dr. Josh Bloom explains.

Now, they are the subject of another lawsuit, this time revolving around bisphenol A (BPA), a chemical that is used as a liner to protect the integrity of cans. There are no known health effects caused by the tiny doses to which humans are exposed, and the FDA declares BPA “safe.” So, what’s the basis of the lawsuit?

According to court filings reported by Business Insider, the president of the National Beverage Corp. planned to lie about the BPA content of its products. Specifically, he allegedly planned to announce that the company no longer used BPA months before the cans would actually be BPA-free. When a high-level executive voiced opposition, he was fired. The lawsuit, then, is for wrongful termination.

There are two facets to this story: (1) The science of BPA; and (2) The conditions surrounding the termination of the employee. As already discussed, (1) is perfectly clear. Yet, despite the fact that the FDA has declared BPA “safe,” Business Insider originally called the chemical “toxic.” The article was eventually updated to remove that completely inaccurate descriptor.

The exact details of (2) are unknown. The only thing we know is that allegations have been made in a lawsuit. But Hayley Peterson, the author of the Business Insider piece, not only seems to have concluded erroneously that BPA is dangerous, but that the company is guilty of wrongful termination. How else can we explain her decision to go on LinkedIn and brag that her reporting cost the company 10% of its market cap?

How a Responsible Journalist Would Cover the La Croix Lawsuit

Instead of just cursing the darkness, I will attempt to light a candle. Here’s how a responsible journalist would cover the La Croix lawsuit.

First, it would be discussed in-depth that the entire basis of the controversy — namely, the presence of BPA — is entirely misguided because it’s a safe product. Whether the company engaged in wrongful termination is far less important than the larger discussion about BPA, which is used in many different products. Second, it would be made clear, if it is eventually found that the president planned to lie and that he acted illegally by terminating an employee, that this has no bearing on the safety of BPA. BPA is safe whether or not the president is a jerk. Third, a responsible journalist wouldn’t go on social media and brag about how they destroyed hundreds of millions of dollars of wealth.

Essentially, I’m asking that journalists be competent, well-informed, and well-behaved. I know that’s asking a lot in 2019.

Upside Down CO2 Dogma

Yoga experts taking the IPCC position attributing rising CO2 to humans.

In the field of climatology, we see repeatedly that alarmists/activists turn things upside down to justify a narrative.  Causes and effects are reversed in order to foster alarm about the burning of fossil fuels.  This distorted way of thinking is described in more detail in essays linked at the end.  This post is concerned with one particular reversal of reality, namely the assertion by IPCC adherents that atmospheric CO2 is rising entirely because of emissions from fossil fuels.  They have it upside down:  Rising temperatures are the main reason CO2 is rising, not the other way around.

The latest heads up treatise on this issue is published this week at Earth Sciences Journal What Humans Contribute to Atmospheric CO2: Comparison of Carbon Cycle Models with Observations by Hermann Harde, Experimental Physics and Materials Science, Helmut-Schmidt-University, Hamburg, Germany.  Excerpts in italics with my bolds.

Harde (2019) Conclusion

The increase of CO2 over recent years can well be explained by a single balance equation, the Conservation Law (23) which considers the total atmospheric CO2 cycle, consisting of temperature and thus time dependent natural emissions, the human activities and a temperature dependent uptake process, which scales proportional with the actual concentration. This uptake is characterized by a single time scale, the residence time of about 3 yr, which over the Industrial Era slightly increases with temperature.

Only this concept is in complete conformity with all observations and natural causalities. It confirms previous investigations (Salby [7, 10]; Harde [6]) and shows the key deficits of some widespread but largely ad hoc carbon cycle models used to describe atmospheric CO2, failures which are responsible for the fatal conclusion that the increase in atmospheric CO2 over the past 270 years is principally anthropogenic.

GHG blocks


For a conservative assessment we find from Figure 8 that the anthropogenic contribution to the observed CO2 increase over the Industrial Era is significantly less than the natural influence. At equilibrium this contribution is given by the fraction of human to native impacts. As an average over the period 2007-2016 the anthropogenic emissions (FFE&LUC together) donated not more than 4.3% to the total concentration of 393 ppm, and their fraction to the atmospheric increase since 1750 of 113 ppm is not more than 17 ppm or 15%. With other evaluations of absorption, the contribution from anthropogenic emission is even smaller.
[Note:  FFE is Fossil Fuel Emissions, LUC is Land Use Change]

Thus, not really anthropogenic emissions but mainly natural processes, in particular the temperature, have to be considered as the dominating impacts for the observed CO2 increase over the last 270 yr and also over paleoclimate periods.

[Read the entire paper for discussion of the error-prone CO2 models employed by IPCC]

Background from Previous Post:  Who to Blame for Rising CO2?

Source :NOAA

Blaming global warming on humans comes down to two assertions:

Rising CO2 in the atmosphere causes earth’s surface temperature to rise.

Humans burning fossil fuels cause rising atmospheric CO2.

For this post I will not address the first premise, instead refer the reader to a previous article regarding efforts to measure temperature effects from CO2. Greenhouse gas theory presumes surface warming arises because heat is forced to escape at a higher, colder altitude. However, at least four separate studies of the available datasets were not able to detect any shift in the atmospheric temperature profile coincidental with rising CO2 in recent decades.  The discussion of the GHG warming theory and its lack of evidence in the real world is summarized in the post No GHG Warming Fingerprints in the Sky

The focus in this piece is the claim that fossil fuel emissions drive observed rising CO2 concentrations. IPCC consensus scientists and supporters note that human emissions are about twice the measured rise and presume that natural sinks absorb half, leaving the other half to accumulate in the atmosphere. Thus they conclude all of the increase in atmospheric CO2 is from fossil fuels.

This simple-minded conclusion takes the only two things we measure in the carbon cycle: CO2 in the atmosphere, and fossil fuel emissions. And then asserts that one causes the other. But several elephants are in the room, namely the several carbon reservoirs that dwarf human activity in their size and activity, and can not be measured because of their complexity.

The consensus notion is based on a familiar environmental paradigm: The Garden of Eden. This is the modern belief that nature, and indeed the climate is in balance, except for humans disrupting it by their activities. In the current carbon cycle context, it is the supposition that all natural sources and sinks are in balance, thus any additional CO2 is because of humans.

Now, a curious person might wonder: How is it that for decades as the rate of fossil fuel emissions increased, the absorption by natural sinks has also increased at exactly the same rate, so that 50% is always removed and 50% remains? It can only be that nature is also dynamic and its flows change over time!

That alternative paradigm is elaborated in several papers that are currently under vigorous attack from climatists. As one antagonist put it: Any paper concluding that humans don’t cause rising CO2 is obviously wrong. One objectionable study was published by Hermann Harde, another by Ole Humlum, and a third by Ed Berry is delayed in pre-publication review.

The methods and analyses are different, but the three skeptical papers argue that the levels and flows of various carbon reservoirs fluctuate over time with temperature itself as a causal variable. Some sinks are stimulated by higher temperatures to release more CO2 while others respond by capturing more CO2. And these reactions occur on a range of timescales. Once these dynamics are factored in, the human contribution to rising atmospheric CO2 is neglible, much to the ire of alarmists.

Ed Berry finds IPCC carbon cycle metrics illogical.

Dr. Ed Berry provides a preprint of his submitted paper at a blog post entitled Why human CO2 does not change climate. He welcomes comments and uses the discussion to revise and improve the text. Excerpts with my bolds.

The United Nations Intergovernmental Panel on Climate Change (IPCC) claims human emissions raised the carbon dioxide level from 280 ppm to 410 ppm, or 130 ppm. Physics proves this claim is impossible.

The IPCC agrees today’s annual human carbon dioxide emissions are 4.5 ppm per year and nature’s carbon dioxide emissions are 98 ppm per year. Yet, the IPCC claims human emissions have caused all the increase in carbon dioxide since 1750, which is 30 percent of today’s total.

How can human carbon dioxide, which is only 5 percent of natural carbon dioxide, add 30 percent to the level of atmospheric carbon dioxide? It can’t.

This paper derives a Model that shows how human and natural carbon dioxide emissions independently change the equilibrium level of atmospheric carbon dioxide. This Model should replace the IPCC’s invalid Bern model.

The Model shows the ratio of human to natural carbon dioxide in the atmosphere equals the ratio of their inflows, independent of residence time.

Fig. 5. The sum of nature’s inflow is 20 times larger than the sum of human emissions. Nature balances inflow with or without human emissions.

The model shows, contrary to IPCC claims, that human emissions do not continually add carbon dioxide to the atmosphere, but rather cause a flow of carbon dioxide through the atmosphere. The flow adds a constant equilibrium level, not a continuing increasing level, of carbon dioxide.

Fig. 2. Balance proceeds as follows: (1) Inflow sets the balance level. (2) Level sets the outflow. (3) Level moves toward balance level until outflow equals inflow.

Ole Humlum proves that CO2 follows temperature also for interannual/decadal periods.

Humlum et al. looks the modern record of fluctuating temperatures and atmospheric CO2 and concludes that CO2 changes follow temperature changes over these timescales. The paper is The phase relation between atmospheric carbon dioxide and global temperature OleHumlum, KjellStordahl, Jan-ErikSolheim.  Excerpts with my bolds.

From the Abstract:
Using data series on atmospheric carbon dioxide and global temperatures we investigate the phase relation (leads/lags) between these for the period January 1980 to December 2011. Ice cores show atmospheric CO2 variations to lag behind atmospheric temperature changes on a century to millennium scale, but modern temperature is expected to lag changes in atmospheric CO2, as the atmospheric temperature increase since about 1975 generally is assumed to be caused by the modern increase in CO2.

In our analysis we used eight well-known datasets. . . We find a high degree of co-variation between all data series except 7) and 8), but with changes in CO2 always lagging changes in temperature.
Highlights

► Changes in global atmospheric CO2 are lagging 11–12 months behind changes in global sea surface temperature. ► Changes in global atmospheric CO2 are lagging 9.5–10 months behind changes in global air surface temperature. ► Changes in global atmospheric CO2 are lagging about 9 months behind changes in global lower troposphere temperature. ► Changes in ocean temperatures explain a substantial part of the observed changes in atmospheric CO2 since January 1980. ► Changes in atmospheric CO2 are not tracking changes in human emissions.

Summary

Summing up, monthly data since January 1980 on atmospheric CO2 and sea and air temperatures unambiguously demonstrate the overall global temperature change sequence of events to be 1) ocean surface, 2) surface air, 3) lower troposphere, and with changes in atmospheric CO2 always lagging behind changes in any of these different temperature records.9

A main control on atmospheric CO2 appears to be the ocean surface temperature, and it remains a possibility that a significant part of the overall increase of atmospheric CO2 since at least 1958 (start of Mauna Loa observations) simply reflects the gradual warming of the oceans, as a result of the prolonged period of high solar activity since 1920 (Solanki et al., 2004).

Based on the GISP2 ice core proxy record from Greenland it has previously been pointed out that the present period of warming since 1850 to a high degree may be explained by a natural c. 1100 yr periodic temperature variation (Humlum et al., 2011).

Hermann Harde sets realistic proportions for the carbon cycle.

Hermann Harde applies a comparable perspective to consider the carbon cycle dynamics. His paper is Scrutinizing the carbon cycle and CO2 residence time in the atmosphere. Excerpts with my bolds.

From the Abstract:

Climate scientists presume that the carbon cycle has come out of balance due to the increasing anthropogenic emissions from fossil fuel combustion and land use change. This is made responsible for the rapidly increasing atmospheric CO2 concentrations over recent years, and it is estimated that the removal of the additional emissions from the atmosphere will take a few hundred thousand years. Since this goes along with an increasing greenhouse effect and a further global warming, a better understanding of the carbon cycle is of great importance for all future climate change predictions. We have critically scrutinized this cycle and present an alternative concept, for which the uptake of CO2 by natural sinks scales proportional with the CO2 concentration. In addition, we consider temperature dependent natural emission and absorption rates, by which the paleoclimatic CO2 variations and the actual CO2 growth rate can well be explained. The anthropogenic contribution to the actual CO2 concentration is found to be 4.3%, its fraction to the CO2 increase over the Industrial Era is 15% and the average residence time 4 years.
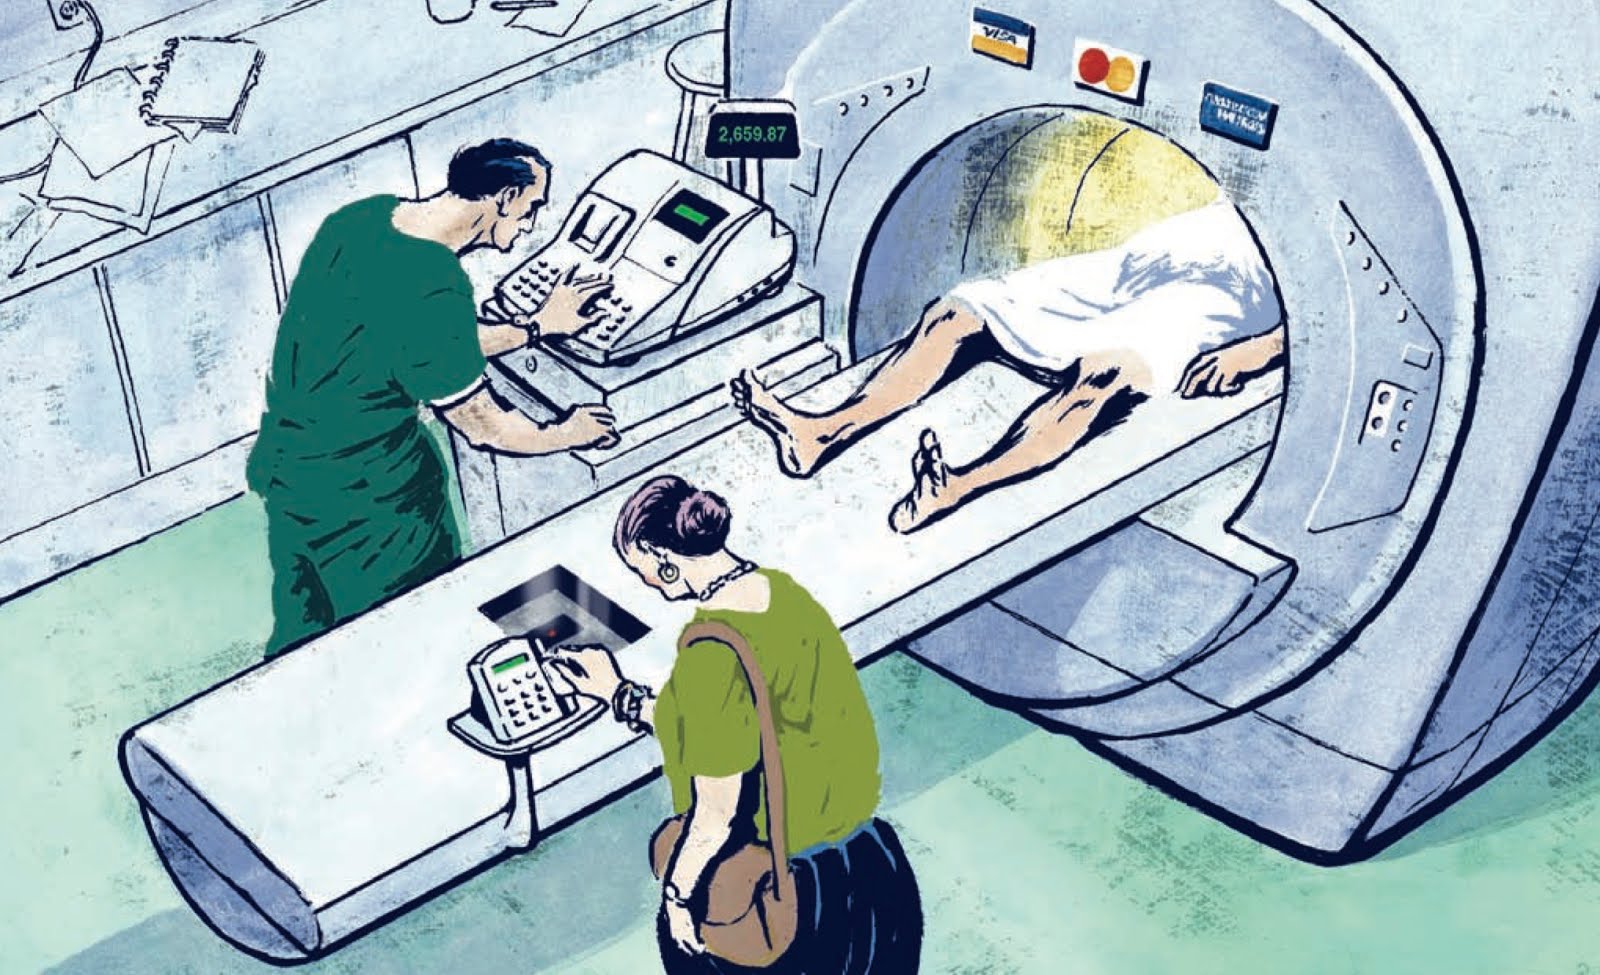
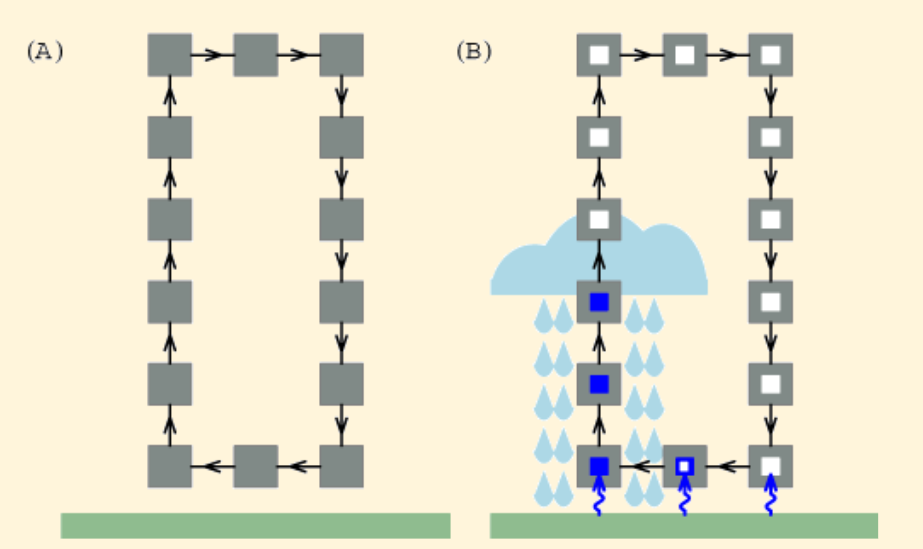
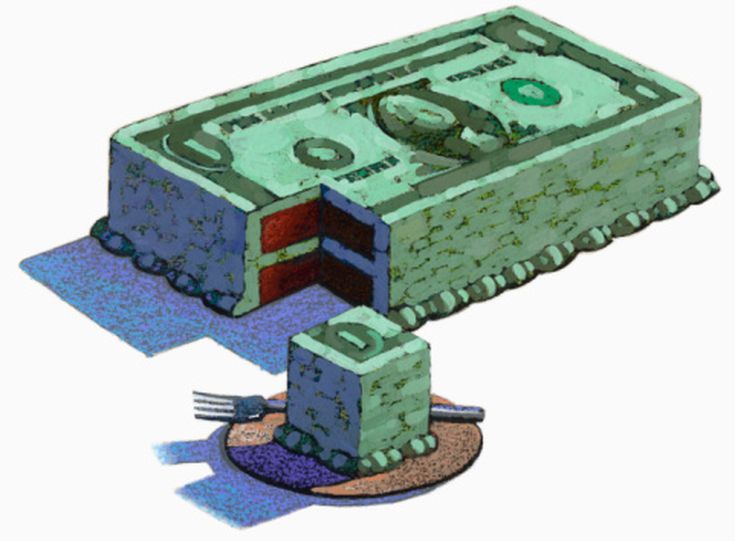
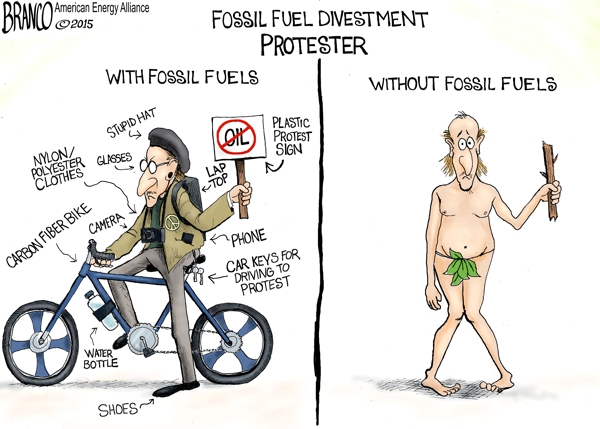
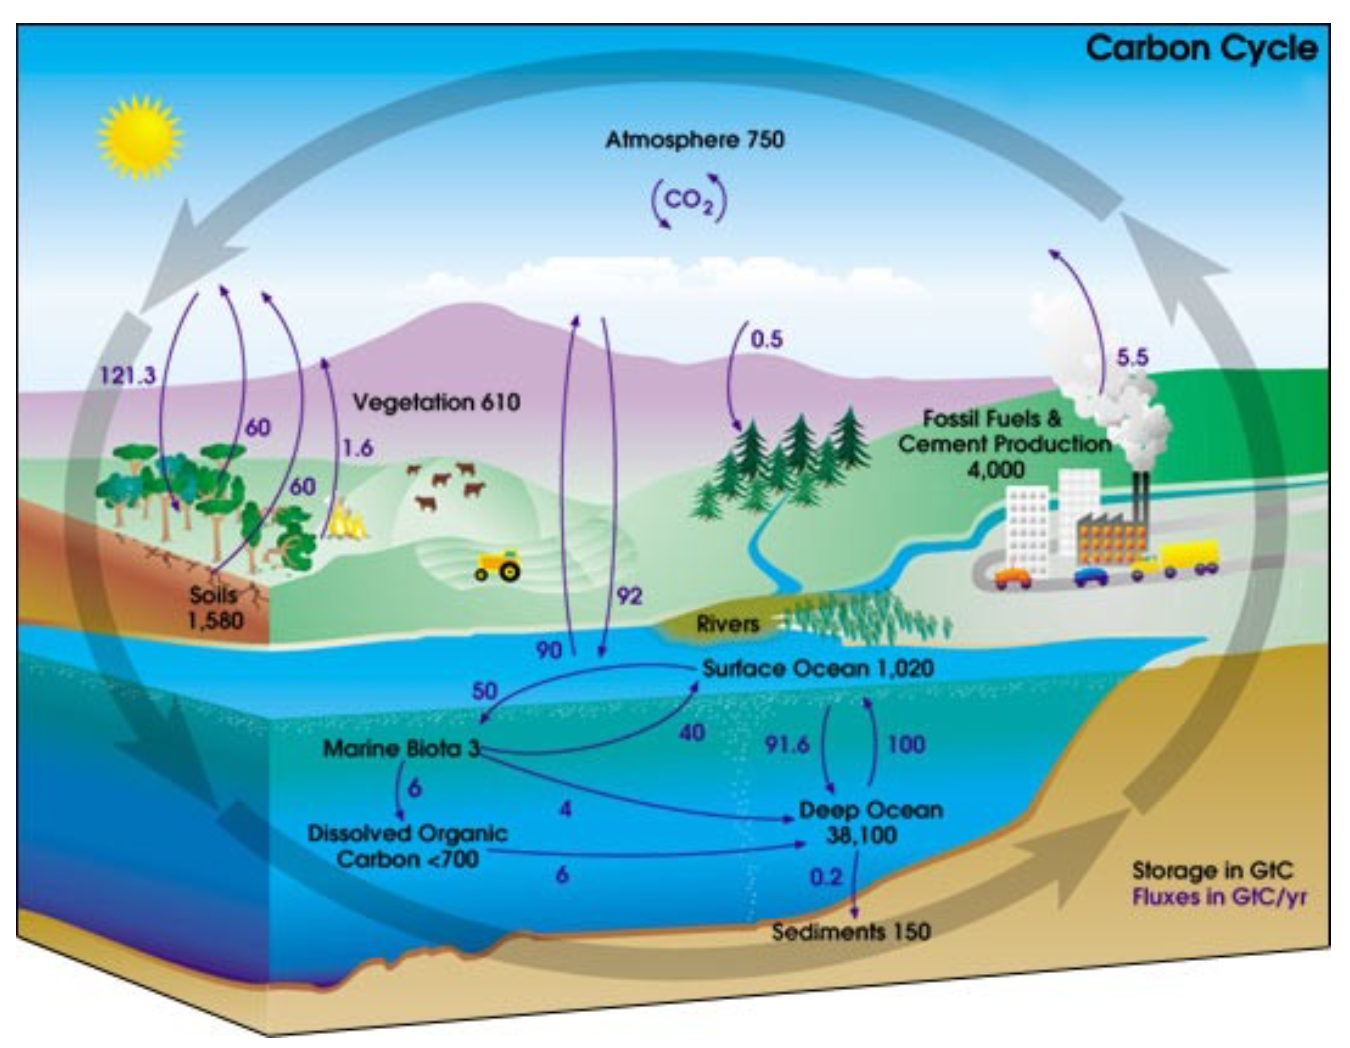
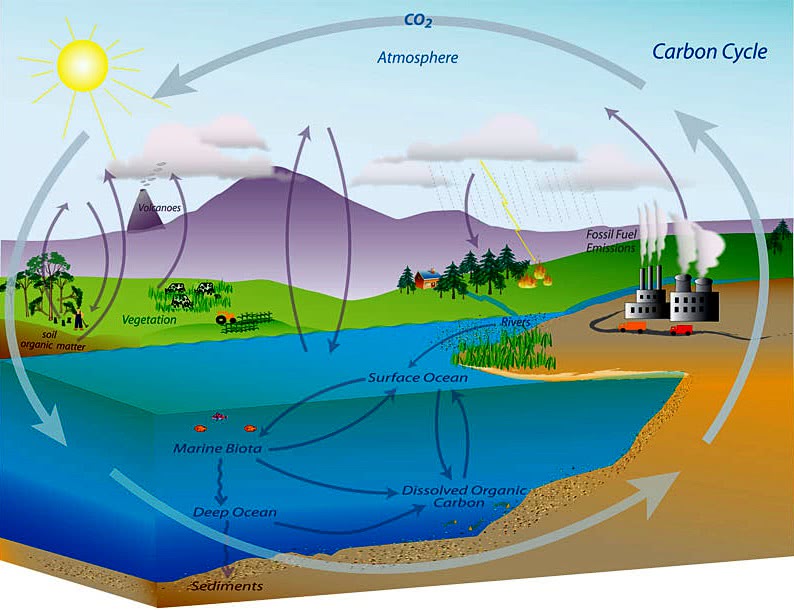
Fig. 1. Simplified schematic of the global carbon cycle. Black numbers and arrows indicate reservoir mass in PgC and exchange fluxes in PgC/yr before the Industrial Era. Red arrows and numbers show annual  anthropogenic’ flux changes averaged over the 2000–2009 time period. Graphic from AR5-Chap.6-Fig.6.1. 

Conclusions

Climate scientists assume that a disturbed carbon cycle, which has come out of balance by the increasing anthropogenic emissions from fossil fuel combustion and land use change, is responsible for the rapidly increasing atmospheric CO2 concentrations over recent years. While over the whole Holocene up to the entrance of the Industrial Era (1750) natural emissions by heterotrophic processes and fire were supposed to be in equilibrium with the uptake by photosynthesis and the net ocean-atmosphere gas exchange, with the onset of the Industrial Era the IPCC estimates that about 15–40% of the additional emissions cannot further be absorbed by the natural sinks and are accumulating in the atmosphere. The IPCC further argues that CO2 emitted until 2100 will remain in the atmosphere longer than 1000 years, and in the same context it is even mentioned that the removal of human-emitted CO2 from the atmosphere by natural processes will take a few hundred thousand years (high confidence) (see AR5-Chap.6ExecutiveSummary). Since the rising CO2 concentrations go along with an increasing greenhouse effect and, thus, a further global warming, a better understanding of the carbon cycle is a necessary prerequisite for all future climate change predictions.

In their accounting schemes and models of the carbon cycle the IPCC uses many new and detailed data which are primarily focussing on fossil fuel emission, cement fabrication or net land use change (see AR5-WG1- Chap.6.3.2), but it largely neglects any changes of the natural emissions, which contribute to more than 95 % to the total emissions and by far cannot be assumed to be constant over longer periods (see, e.g.: variations over the last 800,000 years (Jouzel et al., 2007); the last glacial termination (Monnin et al., 2001); or the younger Holocene (Monnin et al., 2004; Wagner et al., 2004)).

Since our own estimates of the average CO2 residence time in the atmosphere differ by several orders of magnitude from the announced IPCC values, and on the other hand actual investigations of Humlum et al. (2013) or Salby (2013, 2016) show a strong relation between the natural CO2 emission rate and the surface temperature, this was motivation enough to scrutinize the IPCC accounting scheme in more detail and to contrast this to our own calculations.

Different to the IPCC we start with a rate equation for the emission and absorption processes, where the uptake is not assumed to be saturated but scales proportional with the actual CO2 concentration in the atmosphere (see also Essenhigh, 2009; Salby, 2016). This is justified by the observation of an exponential decay of 14C. A fractional saturation, as assumed by the IPCC, can directly be expressed by a larger residence time of CO2 in the atmosphere and makes a distinction between a turnover time and adjustment time needless.

Based on this approach and as solution of the rate equation we derive a concentration at steady state, which is only determined by the product of the total emission rate and the residence time. Under present conditions the natural emissions contribute 373 ppm and anthropogenic emissions 17 ppm to the total concentration of 390 ppm (2012). For the average residence time we only find 4 years.

The stronger increase of the concentration over the Industrial Era up to present times can be explained by introducing a temperature dependent natural emission rate as well as a temperature affected residence time. With this approach not only the exponential increase with the onset of the Industrial Era but also the concentrations at glacial and cooler interglacial times can well be reproduced in full agreement with all observations.

So, different to the IPCC’s interpretation the steep increase of the concentration since 1850 finds its natural explanation in the self accelerating processes on the one hand by stronger degassing of the oceans as well as a faster plant growth and decomposition, on the other hand by an increasing residence time at reduced solubility of CO2 in oceans. Together this results in a dominating temperature controlled natural gain, which contributes about 85% to the 110 ppm CO2 increase over the Industrial Era, whereas the actual anthropogenic emissions of 4.3% only donate 15%. These results indicate that almost all of the observed change of CO2 during the Industrial Era followed, not from anthropogenic emission, but from changes of natural emission. The results are consistent with the observed lag of CO2 changes behind temperature changes (Humlum et al., 2013; Salby, 2013), a signature of cause and effect. Our analysis of the carbon cycle, which exclusively uses data for the CO2 concentrations and fluxes as published in AR5, shows that also a completely different interpretation of these data is possible, this in complete conformity with all observations and natural causalities.

On Myopic, Lop-sided Climatism

Fearless Physics from Dr. Salby

Climate Reductionism

More on CO2

CO2 Fluxes, Sources and Sinks

Obsessed with Human CO2

Not Worried About CO2