The image is an animation of MASIE ice charts over the last two weeks. Upper right is Kara Sea icing, upper center is Laptev freezing over, and upper left is East Siberian filling with ice. Chukchi on the left is still mostly water, and along with Beaufort Sea the main reason 2019 NH ice extent remains below average at this time.
MASIE daily results for October show 2019 recovering slowly early on, then adding ice faster the second half of the month.
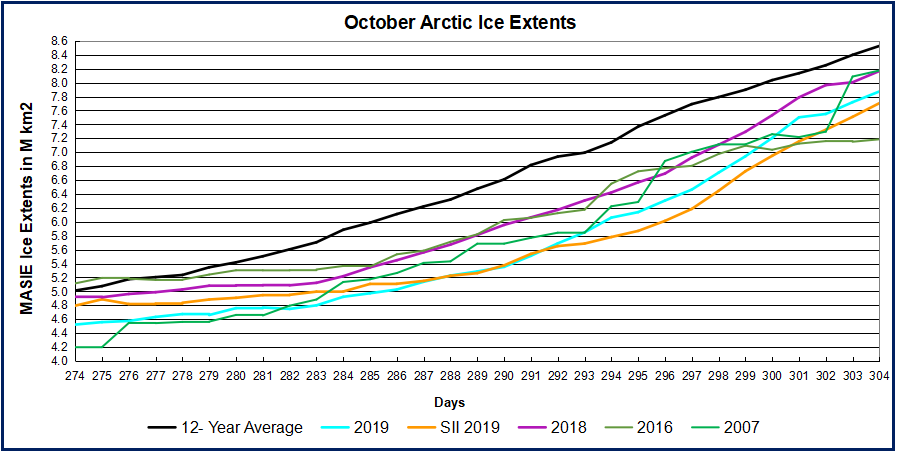 Note that Arctic ice recovers strongly in October going on average (2007 through 2018 inclusive) from 5M km2 to 8.6 M km2. 2019 was as much as 1.3M km2 below average mid-October, before ending the month 654k km2 down..The graph shows 2018 and 2007 matching with 2019 converging as of October 31. SII and MASIE show the same average for the month with SII about 170k km2 lower at the end.
The table for day 304 shows distribution of ice across the regions making up the Arctic ocean.
| Region | 2019304 | Day 304 Average | 2019-Ave. | 2007304 | 2019-2007 |
| (0) Northern_Hemisphere | 7873831 | 8527820 | -653989 | 8175072 | -301241 |
| (1) Beaufort_Sea | 700342 | 956166 | -255824 | 1038126 | -337784 |
| (2) Chukchi_Sea | 169401 | 471301 | -301900 | 242685 | -73284 |
| (3) East_Siberian_Sea | 959948 | 949415 | 10532 | 835071 | 124876 |
| (4) Laptev_Sea | 795682 | 879595 | -83913 | 887789 | -92107 |
| (5) Kara_Sea | 568308 | 462083 | 106225 | 311960 | 256348 |
| (6) Barents_Sea | 165838 | 79203 | 86635 | 52823 | 113015 |
| (7) Greenland_Sea | 430074 | 403101 | 26973 | 443559 | -13485 |
| (8)Baffin_Bay_Gulf_St._Lawrence | 120175 | 277951 | -157775 | 289374 | -169198 |
| (9) Canadian_Archipelago | 727405 | 785367 | -57963 | 817220 | -89816 |
| (10) Hudson_Bay | 3816 | 82445 | -78629 | 48845 | -45029 |
| (11) Central_Arctic | 3222143 | 3169720 | 52423 | 3206345 | 15798 |
Presently 2019 ice extent according to MASIE is 654k km2 (8%) below the 12 year average and 301k km2 less than 2007. Most of the deficit to average is in the Pacific seas of Beaufort and Chukchi. along with Baffin and Hudson Bays refreezing slowly this year. Other places are close to normal, with Central Arctic higher than average and much greater than 2007.

For context, note that the average maximum has been 15M, so on average the extent shrinks to 30% of the March high before growing back the following winter.


Reblogged this on Climate Collections.
LikeLike