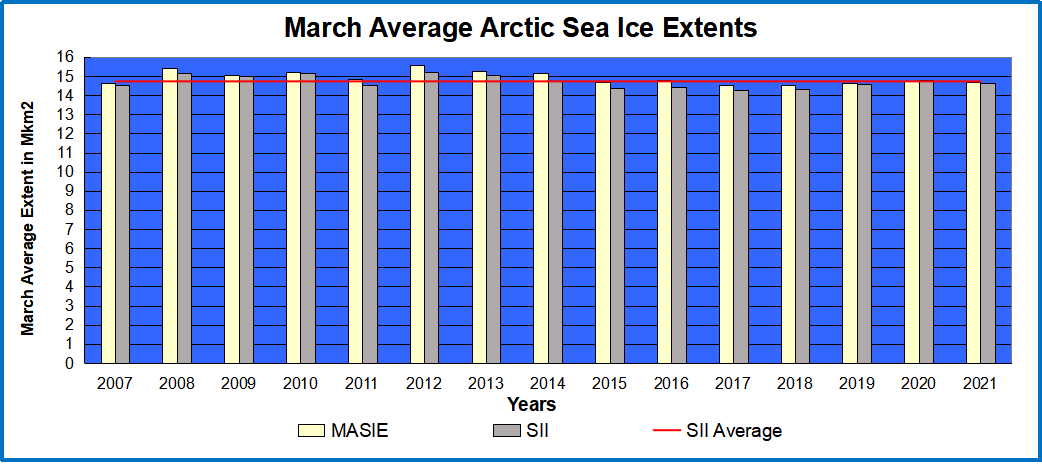
Previous posts showed 2021 Arctic Ice fell short of breaking the 15M km2 ceiling mid March due to a February Polar Vortex disruption. As we shall see below, another smaller PV disruption is now occurring accelerating the normal spring melting season. The graph above shows that the March monthly average has varied little since 2007, typically around the SII average of 14.7 M km2. Of course there are regional differences as described later on.
Dr. Judah Cohen at AER provides an image of how this latest PV disruption appears:

The High pressure areas were forecast to warm over the Pacific Arctic basins, and extending over to the European side, while the cold Low area is presently extending down into North America, bringing some snow on April 1 in Montreal (no joke). The effect on Arctic Ice is shown in the animation below:

Over the last 10 days, Okhotsk upper left lost 180k km2 while Bering lower left lost half that with a slight recovery yesterday. Barents Sea upper right lost 145k km2 over the same period. The effect on NH total ice extents is presented in the graph below.

The graph above shows ice extent through March comparing 2021 MASIE reports with the 14-year average, other recent years and with SII. After drawing close to average by day 80, 2021 ice extents dropped sharply and at March end matched both 2020 and 2007. Despite losses from this PV event, the 2020 March monthly average ended up comparable to other years, as seen in the chart at the top. In fact, the SII dataset of monthly gains and losses shows March 2021 gained slightly over end of February, compared to a 200k km2 loss for the average March.

The table below shows the distribution of sea ice across the Arctic regions.
| Region | 2021090 | Day 090 Average | 2021-Ave. | 2007090 | 2021-2007 |
| (0) Northern_Hemisphere | 14266634 | 14692014 | -425380 | 14222916 | 43718 |
| (1) Beaufort_Sea | 1070689 | 1070177 | 512 | 1069711 | 978 |
| (2) Chukchi_Sea | 966006 | 964100 | 1907 | 966006 | 0 |
| (3) East_Siberian_Sea | 1087137 | 1086134 | 1003 | 1074908 | 12229 |
| (4) Laptev_Sea | 897827 | 896838 | 989 | 884340 | 13487 |
| (5) Kara_Sea | 935023 | 916581 | 18442 | 892157 | 42866 |
| (6) Barents_Sea | 602392 | 649566 | -47174 | 441970 | 160422 |
| (7) Greenland_Sea | 620574 | 658050 | -37476 | 686312 | -65739 |
| (8) Baffin_Bay_Gulf_of_St._Lawrence | 1243739 | 1438412 | -194673 | 1217467 | 26272 |
| (9) Canadian_Archipelago | 854597 | 852959 | 1638 | 850127 | 4470 |
| (10) Hudson_Bay | 1260903 | 1254727 | 6176 | 1229995 | 30908 |
| (11) Central_Arctic | 3192844 | 3234463 | -41619 | 3242237 | -49393 |
| (12) Bering_Sea | 549939 | 736829 | -186890 | 814788 | -264849 |
| (13) Baltic_Sea | 33543 | 608741 | -27331 | 45897 | -12354 |
| (14) Sea_of_Okhotsk | 942085 | 861234 | 80850 | 794657 | 147428 |
Overall NH extent March 31 was below average by 425k km2, or 3%. The bulk of the deficit is seen in Bering and Baffin, along with Barents Sea. Okhotsk remains above average in spite of recent losses. The onset of spring melt is as usual in most regions.


Reblogged this on Climate Collections.
LikeLiked by 1 person