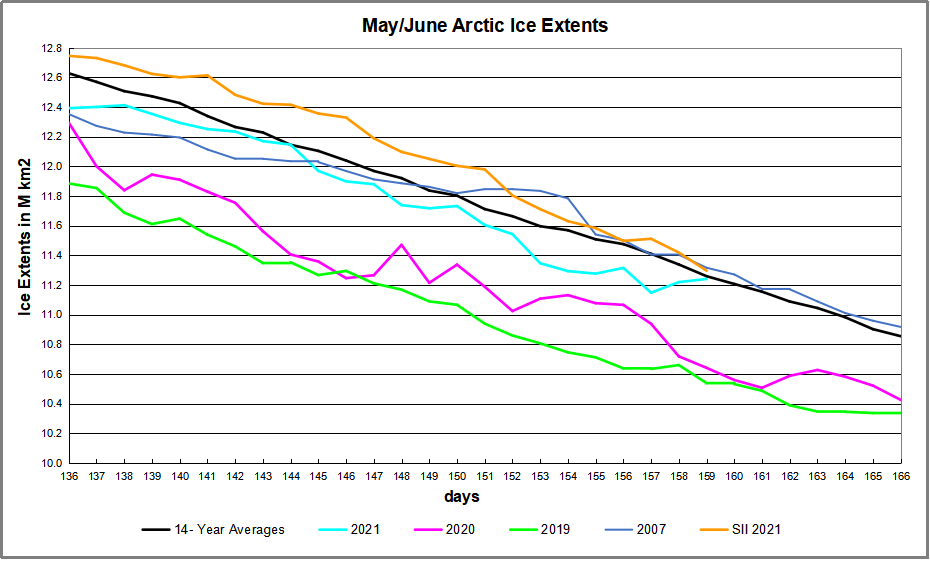
A previous post reported that Arctic Sea Ice has persisted this year despite a wavy Polar Vortex this spring, bringing cold down to mid-latitudes, and warming air into Arctic regions. Now in June, after tracking in deficit the sea ice extent is matching the 14-year average on day 159. Note that SII (Sea Ice Index) since mid-May has been showing 200 to 400k km2 more ice than MASIE, and currently the two datasets have converged on a value of ~11.25 M km2.
Note that on the 14-year average, during this period ~1.7M km2 of ice extent is lost, which 2021 is matching, as did 2007. Both 2020 and 2019 were much lower than average at this date, by ~600k and ~700k respectively.
Why is this important? All the claims of global climate emergency depend on dangerously higher temperatures, lower sea ice, and rising sea levels. The lack of additional warming is documented in a post Adios, Global Warming
The lack of acceleration in sea levels along coastlines has been discussed also. See USCS Warnings of Coastal Floodings
Also, a longer term perspective is informative:

The table below shows the distribution of Sea Ice across the Arctic Regions, on average, this year and 2007.
| Region | 2021159 | Day 159 Average | 2021-Ave. | 2007159 | 2021-2007 |
| (0) Northern_Hemisphere | 11240999 | 11259536 | -18538 | 11316498 | -75500 |
| (1) Beaufort_Sea | 1019264 | 964689 | 54575 | 1000434 | 18830 |
| (2) Chukchi_Sea | 849650 | 820007 | 29642 | 828275 | 21375 |
| (3) East_Siberian_Sea | 1018939 | 1060847 | -41907 | 1065467 | -46528 |
| (4) Laptev_Sea | 719152 | 797804 | -78652 | 750975 | -31824 |
| (5) Kara_Sea | 786077 | 768820 | 17257 | 805583 | -19506 |
| (6) Barents_Sea | 253238 | 260182 | -6944 | 312729 | -59491 |
| (7) Greenland_Sea | 664297 | 581528 | 82769 | 579724 | 84573 |
| (8) Baffin_Bay_Gulf_of_St._Lawrence | 755645 | 803058 | -47412 | 811860 | -56215 |
| (9) Canadian_Archipelago | 802846 | 802905 | -60 | 783908 | 18938 |
| (10) Hudson_Bay | 1022997 | 1058859 | -35862 | 1027039 | -4042 |
| (11) Central_Arctic | 3233401 | 3215315 | 18085 | 3235047 | -1646 |
| (12) Bering_Sea | 59415 | 70145 | -10729 | 62751 | -3336 |
| (13) Baltic_Sea | 0 | 8 | -8 | 0 | 0 |
| (14) Sea_of_Okhotsk | 54471 | 53989 | 482 | 51031 | 3440 |
The main deficits are in Laptev and East Siberian Seas, Baffin and Hudson Bays, offset by surpluses in Beaufort, Chukchi and Greenland Seas.


Reblogged this on Climate Collections.
LikeLike