Anthony Watts has a short and to the point video entitled The True Relationship of CO2 and Temperature That the Media Won’t Tell You. For those who prefer reading I provide below a transcript in italics, lightly edited from the closed captions, along with images and my bolds. H/T Geo Rublik
Climate change is in fact real. Climate has changed on the earth for millennia. Okay that’s just the natural order of things–climate is not static in any way shape or form. Let’s start with that.

The first point is: Yes, carbon dioxide does have an effect.
However it is down on the lower side of things, almost minuscule. The reason is the fact that we have reached saturation of the effect of carbon dioxide on warming the atmosphere. It happens in the first 100 parts per million and then after that it’s a logarithmic scale. The effect flattens out at the top, and we’re very nearly at the top of the curve of the effect of carbon dioxide warming the planet. The ability for additional carbon dioxide to affect the temperature is is quickly diminishing to become flat.

This mod trend calculation shows exactly what I’m talking about. In the first hundred parts per million, it’s just a rapid increase. And then it tapers off more and more. So the idea of climate running away due to carbon dioxide isn’t going to happen. So yes carbon dioxide does have an effect which gets smaller as the amount of concentration of co2 gets larger.
The second point is what I brought up in my surface station project.
Namely, that we are retaining more and more heat in our local areas due to increased infrastructure, increased concrete, asphalt and so forth. So are locales are retaining heat at night. And the more artificial structures and surfaces we have in the vicinity of the thermometer, the more it warms the temperature at night, it doesn’t get as cold.
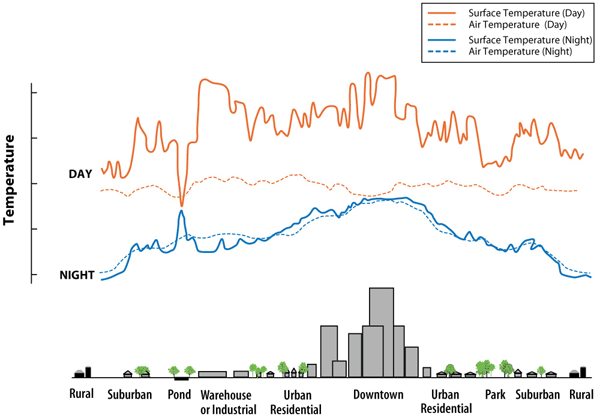
Well the climate folks track climate change per se using the average temperature. That average temperature is obtained by averaging between the daily high and the low. So if the low goes up and the high stays the same. then the average is going to go up. That’s the result showing a warming planet, mostly based on the nighttime temperature going up. [Note the dotted red line for daytime averages changes little compared to the rise of nightime averages shown by blue dotted line.]
That’s due both to carbon dioxide retarding heat going to space and
because we’ve got more localized influences of infrastructure retaining heat
which affects the thermometers. it’s just that simple.
Addendum

Thirdly, there has also been man made warming of the temperature record by making adjustments to the observations.

There’s a third point Anthony didn’t raise, but I will. There has also been man made warming of the temperature record by making adjustments to the observations. And those data alterations always serve to increase the warming trend.
The diagram above comes from KNMI showing how repeated adjustments over time added increments of warming to the GISSTemp record. The blue line is the GISS value for January 1910. The red line is GISS value for January 2000. The values for both months change many times between the GISS dataset at May 2008 and the same dataset at June 2023. The effect is to increase the warming (the difference between January 1910 and 2000) from 0.45 C to 0.67 C, due to lowering the 1910 number and increasing the 2000 number.
Dr. Ole Humlum commented: A temperature record which keeps on changing the past hardly can qualify as being correct.
I have also done a study of the records of surface stations rated by Watts’ project as having a #1 rating for siting quality–no urban heat sources nearby. That analysis compared raw data (as reported by the local weather authority) with the adjusted data (reanalyzed before input into climatology models.) See Updated Review of Temperature Data which also confirms the problems noted above.
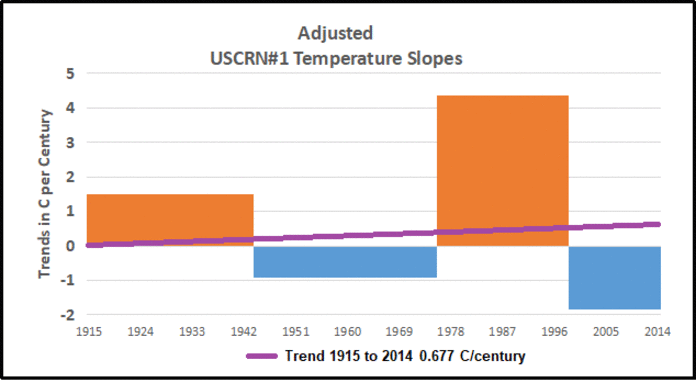
The analysis showed the effect of GHCN adjustments on each of the 23 stations in the sample. The average station was warmed by +0.58 C/Century, from +.18 to +.76, comparing adjusted to unadjusted records. 19 station records were warmed, 6 of them by more than +1 C/century. 4 stations were cooled, most of the total cooling coming at one station, Tallahassee. So for this set of stations, the chance of adjustments producing warming is 19/23 or 83%. For example, Baker City Oregon


Reblogged this on Climate Collections.
LikeLike
Warming in itself isn’t evidence of human caused warming anyway.
LikeLike