
Why Did IMF Disinvite Nobel Laureate?
CO2 Coalition explains. Nobel Laureate (Physics 2022) Dr. John Clauser was to present a seminar on climate models to the IMF on Thursday and now his talk has been summarily cancelled. According to an email he received last evening, the Director of the Independent Evaluation Office of the International Monetary Fund, Pablo Moreno, had read the flyer for John’s July 25 zoom talk and summarily and immediately canceled the talk. Technically, it was “postponed.”
Dr. Clauser had previously criticized the awarding of the 2021 Nobel Prize for work in the development of computer models predicting global warming and told President Biden that he disagreed with his climate policies. Dr. Clauser has developed a climate model that adds a new significant dominant process to existing models. The process involves the visible light reflected by cumulus clouds that cover, on average, half of the Earth. Existing models greatly underestimate this cloud feedback, which provides a very powerful, dominant thermostatic control of the Earth’s temperature.
More recently, he addressed the Korea Quantum Conference where he stated, “I don’t believe there is a climate crisis” and expressed his belief that “key processes are exaggerated and misunderstood by approximately 200 times.” Dr. Clauser, who is recognized as a climate change skeptic, also became a member of the board of directors of the CO2 Coalition last month, an organization that argues that carbon dioxide emissions are beneficial to life on Earth.
What Difference Clouds Make in Climate Models
Obviously the Clauser presentation is not accessible and I don’t find a link to a publication concerning his treatment of clouds in climate models. But we can see how the models react to clouds by means of an important paper The Mechanisms of Cloudiness Evolution Responsible for Equilibrium Climate Sensitivity in Climate Model INM-CM4-8 by Evgeny Volodin AGU 03/12/2021. Excerpts in italics with my bolds.
Abstract
Current climate models demonstrate large discrepancy in equilibrium climate sensitivity (ECS). The effects of cloudiness parameterization changes on the ECS of the INM-CM4-8 climate model were investigated. This model shows the lowest ECS among CMIP6 models. Reasonable changes in the parameterization of the degree of cloudiness yielded ECS variability of 1.8–4.1 K in INM-CM4-8, which was more than half of the interval for the CMIP6 models.
The three principal mechanisms responsible for the increased ECS were increased cloudiness dissipation in warmer climates due to the increased water vapor deficit in the non-cloud fraction of a cell, decreased cloudiness generation in the atmospheric boundary layer in warm climates, and the instantaneous cloud response to CO2 increases due to stratification changes.
Introduction
In CMIP6 the lowest and highest ECS (Equilibrium Climate Sensitivity) values are 1.8 and 5.6 K, respectively (Zelinka et al., 2020). Climate response to some external forcing produces feedbacks. Positive feedback enhances the response to forcing, negative feedback weakens it. Analysis of climate feedback shows that cloud feedback is the principal reason for the broad range of ECS (Zelinka et al., 2020). Clouds (especially low clouds) are significantly reduced with global warming in models with high ECS, resulting in positive feedback. Models with low sensitivity show small cloudiness changes with global warming; some models feature an increase in low clouds in warmer climates, creating a negative feedback.
Clouds produce shortwave and longwave radiative effects. The shortwave cloud radiative effect (SW CRE) is generally negative, because cloudiness reflects solar radiation that would otherwise be absorbed by the climate system. The shortwave effect is usually strongest for low clouds that have high amounts of liquid water and high albedos. The longwave cloud radiative effect (LW CRE) is generally positive, because cloud tops are usually much colder than the surface of the Earth; thus, thermal radiation from the cloud top is much lower than that from the surface. Negative/positive CRE produces cooling/warming from clouds.
The goal of this study is that we turn off some mechanisms responsible for large-scale cloud evolution that lead to increase or decrease ECS, and ECS is changed by the factor of more than 2. The role of a chosen mechanism in decrease or increase of ECS can be clearly seen. At the same time, all model versions show preindustrial climate with systematic biases compared to that for the version used in CMIP6. A realistic way of estimating the impact of change in parameterization on cloud feedback by keeping the cloud mean state realistic in all model versions and running 4xCO2 experiments rather than uniform +4K experiments are used in this study.
Table 1. Summary of Model Versions
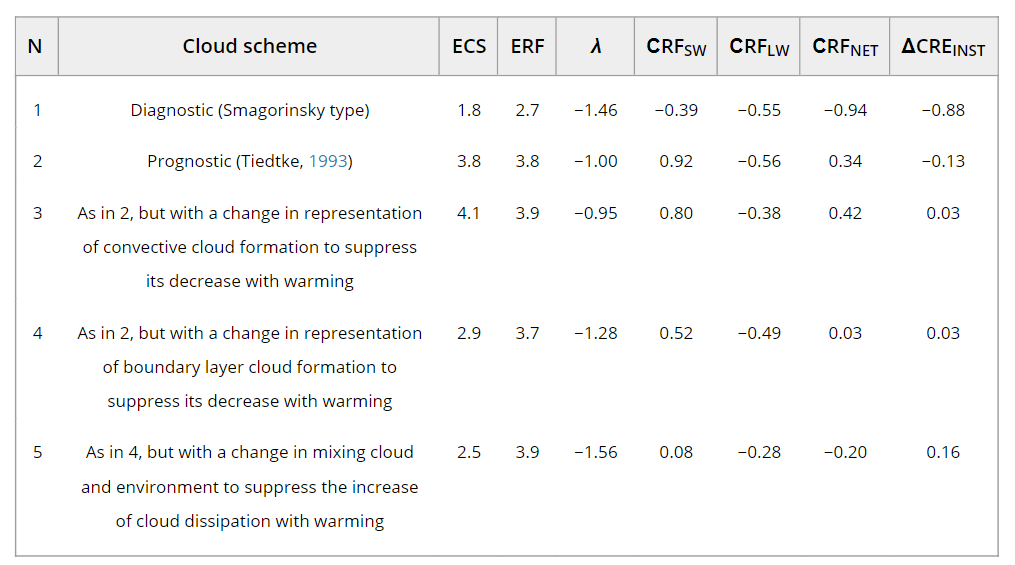
Note. Equilibrium climate sensitivity ECS (K), effective radiation forcing ERF (W m−2), climate feedback parameter λ (W m−2 K−1), shortwave cloud radiative feedback СRFSW, longwave cloud radiative feedback СRFLW, net cloud radiative feedback СRFNET (W m−2 K−1) and instantaneous cloud radiative forcing change ΔCREINST (Wm−2).
The ECS estimation method is commonly used in CMIP5 and CMIP6 and was proposed by Gregory et al. (2004). The two model runs performed were the control run, in which all forcings were fixed at preindustrial levels, and the run where the concentration of CO2 in the atmosphere was four times higher than in the control run (4CO2 run). The initial state for both runs was the same and taken from a sufficiently long control run. Each run had a length of 150 years. Subsequently, the global mean difference of GMST and the heat balance at the top of atmosphere (THB) for 4CO2 and the control run were calculated for each model year.
Results of the sensitivity experiments performed with the five climate model versions.
Version 1 shows a very low ECS of 1.8 K due to a low negative climate feedback parameter value of −1.46 W m−2 K−1 (interval from −0.6 to −1.8 W m−2 K−1 for CMIP5 and CMIP6) and a low ERF value of 2.7 W m−2 (intervals of 2.6–4.4 and 2.7–4.3 W m−2 for CMIP5 and CMIP6, respectively, Zelinka et al., 2020). The low ECS was accompanied by mostly negative CRF in both the SW and LW spectral intervals (Figure 2 below).

Figure 2 Shortwave (top), longwave (middle) and net (bottom) cloud radiation feedback (Wm−2 K−1) for model version 1 (purple), 2 (yellow), 3 (red), 4(green), and 5 (blue). Data are multiplied by cosine of latitude.
The parameterization replacement scheme for cloudiness in version 2 dramatically changed all the parameters, and the ECS more than doubled to 3.8 K. ERF increased to 3.8 W m−2, without changes to the radiation code because ΔCREINST changed from −0.88 W m−2 to −0.13 W m−2. Additionally, the climate feedback parameter increased from −1.46 W m−2 K−1 to −1.0 W m−2 K−1. In version 2, global warming was associated with decreased cloudiness at all levels. The net cloud radiative feedback became positive. Version 2 yielded significantly increased net and SW cloud radiative feedbacks at all latitudes compared with version 1. Analysis of the sensitivity experiment results of versions 3–5 helps understand the mechanisms of these significant changes.
Version 3 features a suppressed mechanism of high tropical cloudiness due to decreased convective mass flux and higher ECS than version 2 (4.1 K); however, the change is not very pronounced. The LW CRF in the tropics increases in version 3 compared to version 2. The decrease in SW CRE is not very pronounced; therefore, increased net CRF increases ECS. This confirms our hypothesis that suppressing the decrease in tropical cloudiness should increase ECS and that the impact of this mechanism on ECS is noticeable but not very strong.
ECS is noticeably lower in version 4 (2.9 K) than in version 2. Thus, the mechanism of the decrease in boundary layer cloudiness due to decreased cloudiness generation by boundary layer turbulence is crucial for ECS. SW and LW CRF decreased in version 4 compared to version 2, primarily in the tropics and subtropics.
The mechanism of increased cloud dissipation under global warming conditions was suppressed in version 5, ECS was reduced to 2.5 K, and the climate feedback parameter decreased to −1.56 W m−2 K−1. Additionally, the SW CRF decreased in version 5 compared with version 4, primarily in the tropics and subtropics. In this version, all the mechanisms that decrease clouds with increased temperature, as raised in the previous section, are suppressed. The principal reason for the ECS difference between versions 1 and 5 is the instantaneous adjustment rather than the feedback (see Table 1). ΔCREINST values in versions 1 and 5 were −0.88 and 0.16 W m−2, respectively.
Conclusion
All model versions demonstrate similar model bias values for annual mean CRE, near-surface temperature, and precipitation; thus, determining a relation between present-day climate simulation model quality and ECS is difficult. Version 1 has slightly better quality (because it is a CMIP6 version) due to extensive tuning. The cloudiness scheme used in version 1 contained the dependence of low clouds on stratification. An increase in CO2 leads to more stable stratification and more low clouds and may be the primary cause of the low ECS. Bretherton (2015) and Geoffroy et al. (2017) obtained similar results. The decrease in clouds in warmer climates due to the mixing of cloud air with the unsaturated environment was also stated in a review by Gettelman and Sherwood (2016). Our results confirm those by Bony et al. (2006), Brient and Bony (2012), and others that a significant change in the response of low clouds to global warming leads to significant changes in cloud radiative feedback and ECS.
Comment
The main finding is: If warming increases low clouds, then SW (incoming solar radiation) is reduced, counteracting the warming, in effect a negative feedback. That is consistent with Clauser’s position.

Why CO2 cools the Surface of the Earth.
Dr. Theo Eichten, Munich; Professor Dr.-Ing. Vollrath Hopp[2], Dreieich; Dr. Gerhard Stehlik[1], Hanau; Dr.-Ing. Edmund Wagner, Wiesbaden; © January 2014.
The following information destroys all the lies of the climate fascists. You really only have to study the results from these serious facts that I have listed here. All information from my comment should be spread and contribute to the destruction of the fake climate change fairy tale.
In contrast to the fact-free bullshit slogans of the climate lobbyists, my proposals are based on incontrovertible serious and scientific research results.
I am from Germany. The weather situation in Germany is just the best proof of the mendacity of the climate lobbyists. Today is the 14. 07.2023. It is midsummer. Summer in Germany hasn’t even happened yet. There have only been 2 days with temperatures above 30 degrees. Today the temperature is 24 degrees. Next week the temperature should drop to 21 degrees. This is now already the coldest summer for over 10 years. The water reservoirs in Germany are filled to the brim with water.
Example: Lake Eder. One of the largest German reservoirs for water supply in the middle of Germany. The water level in the Eder reservoir is currently 57 cm above the water level of the last 10 years.
Source: https://wasserstand.edersee.me
Date: Thursday, 13.07.2023
Water level at 07:00 o’clock in m above sea level: 239,90
Water level average 1991 – 2020 239,33
While everything is green, the summer is too cold and there is water in abundance, politicians and media talk about global warming and an impending drought. The lower the CO2 content in the atmosphere, the warmer the climate becomes. The climate fascists distort the truth and claim exactly the opposite. Therefore, we must stop the climate fascists as soon as possible. The climate lies pursue exclusively the goal to abolish the freedom of speech and the basic rights of the people. Meanwhile, governments are forcing people to eat bugs and worms on the grounds of global warming. This is perverse and anti-human.
Summers are no hotter than in the seventies. The measurements are simply faked in favor of the CO2 opponents. However, last year’s winter was one of the fierce variety worldwide.
Maybe it’s because there were unusually many and long-lasting volcanic eruptions a year ago and two years ago?
See research report on the cause of the Little Ice Age.
https://arcticportal.org/ap-library/news/600-little-ice-age-was-caused-by-volcanic-eruptions
The Little Ice Age lasted from the 13th to the 18th century.
Why do the climate fascists not mention with a word that ,before the Little Ice Age there was a centuries-long period of extreme warmth, in which temperatures were higher than today? This world-wide extreme warmth period before the 13th century was neither caused by farting cows nor by a world-wide industrialization.
Original Text: Climate scientists now understand that the Medieval Warm Period was caused by an increase in solar radiation and a decrease in volcanic activity.Source:
https://news.utexas.edu/2010/11/11/medieval-warm-period-not-so-random/
Another example: Original text:
And they thus concluded that the idea of “the modern temperature increase being caused solely by an increase in CO2 concentrations appears questionable.”
Source: http://www.co2science.org/subject/g/summaries/globalmwp.php
Here is a research paper by climate professors from Germany that confirms that CO2 is cooling the climate. The corrupt climate lobbyists, with their CO2 hysteria, are causing climate catastrophe by decreasing CO2 in the atmosphere.
https://gerhard.stehlik-online.de/
Finally, an interesting research result that completely refutes and destroys the CO2 hysteria of the climate fascists.
Original text:In discussing their results, the three researchers write that “the water masses associated with the North Pacific and Antarctic interglacials were 2.1 ± 0.4°C and 1.5 ± 0.4°C warmer, respectively, during the middle Holocene thermal maximum [HTM] than in the past century” and that “both water masses were ~0.9°C warmer during the Medieval Warm Period [MWP] than during the Little Ice Age and ~0.65°C warmer than in recent decades.” Rosenthal et al. not only provide further evidence for the greater warmth of the Medieval Warm Period compared to the current Warm Period, but also write that “the inferred similarity of temperature anomalies in both hemispheres is consistent with recent findings from Antarctica (Orsi et al., 2012), supporting the idea that the HTM, MWP, and LIA were global events.
http://www.co2science.org/subject/g/summaries/globalmwp.php
Conclusion: With this scientific information the fact-free lies of the climate fascists should be finally and clearly completely destroyed.
LikeLike
Thanks for commenting with perspectives from Germany. Your nickname is ironic, since Clauser’s research was intended to challenge Einstein’s quantum theory.
LikeLike
Reblogged this on Climate Collections.
LikeLike
Sea surface temperatures control low cloud cover. During a warm Atlantic Multidecadal Oscillation (AMO) phase, low cloud cover declines, apart from in parts of the central tropics and over the Arctic Ocean. And every other warm phase of the AMO is during a centennial solar minimum, due to weaker solar wind states causing negative North Atlantic Oscillation regimes. The colder AMO in the mid 1970’s and mid 1980’s had the strongest solar wind states of the space age, driving positive NAO regimes. Rising CO2 forcing is modeled to increase positive NAO conditions, so in theory it should have limited (or stalled) the AMO warming from 1995.
It is pointless addressing cloud feedbacks without a rational model for the AMO.
https://archive.ipcc.ch/publications_and_data/ar4/wg1/en/ch10s10-3-5-6.html
LikeLike
Thanks Ulric for making that connection between cloud cover and ocean by way of AMO.
LikeLike
Ulric to your point, I found this:
“No significant ENSO-driven atmospheric anomalies can be observed over the North Atlantic when ENSO and the AMO are out of phase (AMO−/El Niño and AMO+/La Niña). Further analysis indicates that the sea surface temperature anomaly (SSTA) in the tropical North Atlantic (TNA) plays an essential role in this modulating effect. Because of broadly analogous TNA SSTA responses to both ENSO and the AMO during late winter, a warm SSTA in the TNA is evident when El Niño occurs during a positive AMO phase, resulting in a significantly weakened NAO, and vice versa when La Niña occurs during a negative AMO phase. In contrast, neither the TNA SSTA nor the NAO shows a prominent change under out-of-phase combinations of ENSO and AMO. ”
https://journals.ametsoc.org/view/journals/clim/32/1/jcli-d-18-0365.1.xml
LikeLike
LikeLike
Thanks Ron. While the NAO is a driver of ENSO and the AMO, there are feedbacks from both to the NAO. I had noticed major warm pulses to the AMO peaking in August following the December peak of an El Nino, via negative NAO conditions in the summer months, but only during the warm AMO phase. As in the left hand diagram you posted above, but they have the logic different. I was not familiar with the corollary in the right hand diagram, so that is useful.
LikeLike