The animation above shows the minimum daily extent for 2023 occurred on September 15. In the next six days ~450k km2 of ice extent was added (nearly half a Wadham). The Arctic ice extent yesterday was 4.53M km2 approaching the 17 year average for the day.
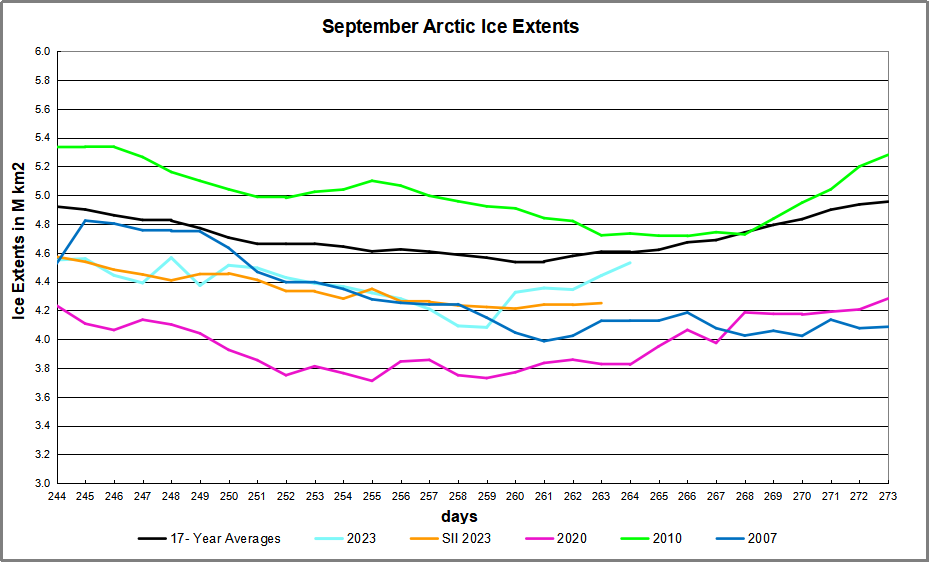
The graph for September shows the first two weeks 2023 was well below the average and tracking with 2007. After hitting bottom day 258, a sharp recovery lifted extents close to average and much higher than 2007. (SII has not yet posted a value for day 264).
Note that typically September ends the month slightly higher than it begins, though 2023 is already matching its Sept. 1 value. If this year’s ice growth continued at the same rate of losses during the first two weeks of September (50k per day), the extent would reach ~5M km2 at month end. That would result in a 2023 September monthly average of 4.5M km2. Such extent would be close to the median prediction, somewhat lower than 2022, but much higher than 2007 or 2020, and 800k km2 higher than 2012 (the year of the great August Cyclone.)

The table for day 264 shows how the ice extent is distributed across the Arctic regions, in comparison to 17 year average and 2007.
| Region | 2023264 | 264 Average | 2023-Ave. | 2007264 | 2023-2007 |
| (0) Northern_Hemisphere | 4530862 | 4603044 | -72183 | 4129308 | 401554 |
| (1) Beaufort_Sea | 353539 | 514036 | -160497 | 507235 | -153697 |
| (2) Chukchi_Sea | 135936 | 167774 | -31839 | 30316 | 105620 |
| (3) East_Siberian_Sea | 48471 | 262691 | -214220 | 311 | 48160 |
| (4) Laptev_Sea | 381662 | 127644 | 254018 | 223595 | 158067 |
| (5) Kara_Sea | 43989 | 34853 | 9136 | 27950 | 16038 |
| (6) Barents_Sea | 2394 | 14654 | -12260 | 4851 | -2457 |
| (7) Greenland_Sea | 273632 | 202253 | 71379 | 336388 | -62756 |
| (8) Baffin_Bay_Gulf_of_St._Lawrence | 66853 | 34768 | 32085 | 31731 | 35122 |
| (9) Canadian_Archipelago | 177101 | 302976 | -125875 | 237555 | -60454 |
| (10) Hudson_Bay | 0 | 4119 | -4119 | 2270 | -2270 |
| (11) Central_Arctic | 3046145 | 2936249 | 109896 | 2725832 | 320313 |
The table shows the main deficits are in Beaufort, East Siberian seas and CAA. Offsetting surpluses are in Laptev, Greenland and Central Arctic seas. The total deficit on this day is 72k km2 or 1.6%. Note that 2007 did not add more ice as September ended.


How odd that ice should increase when it gets colder ? I fear this alarmism of yours will have those in that “Great Temple of Uselessness” – the UN – all of dither.
LikeLike
LikeLike
😂
LikeLike