Culture War Facturing Canada (Updated)

Update Below Adds Context from Angus Reid and Links to Series of Reports, Some Upcoming
Bruce Pardy writes at National Post Woke wolves dominate the culture war ecosystem — for now. Excerpts in italics with my bolds and added images.
Canada is unravelling. Culture wars are making the country stupid, poor and fractured — and according to Angus Reid, these fractures have produced five distinct groups.
Last week, the Angus Reid Institute released a study on the bubbling, sometimes boiling, political conflicts in Canada. The study characterized five culture war factions that comprise the country: the “zealous activists,” the “quiet accommodators,” the “conflicted middle,” the “frustrated skeptics” and the “defiant objectors.” They make up the political ecosystem, which is why they are perhaps best recast as members of the animal kingdom.
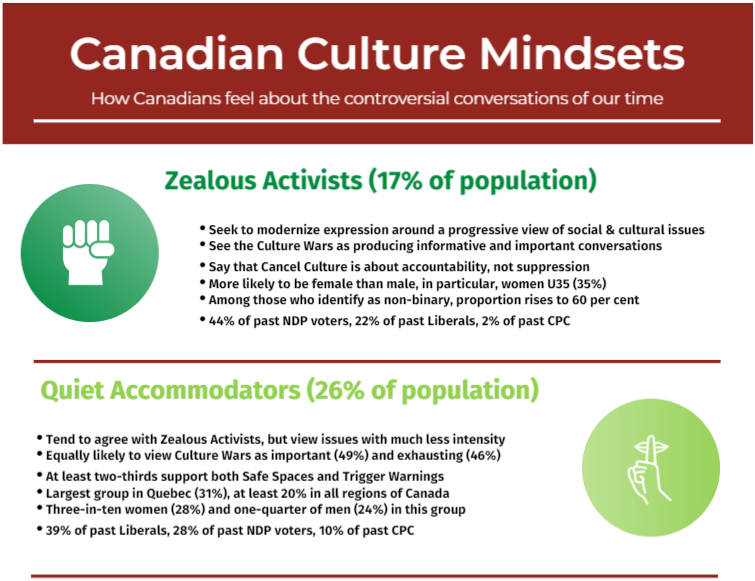
Zealous Activists Behave as Wolves
“Zealous activists,” according to the Angus Reid study, make up 17 per cent of the population. They are ardent social progressives who believe that cancel culture is about “accountability.” I think of them as wolves. They travel in packs. These are woke mobs pushing the social justice revolution. They hunger to rip to shreds the reputation of anyone who defies progressive agendas.
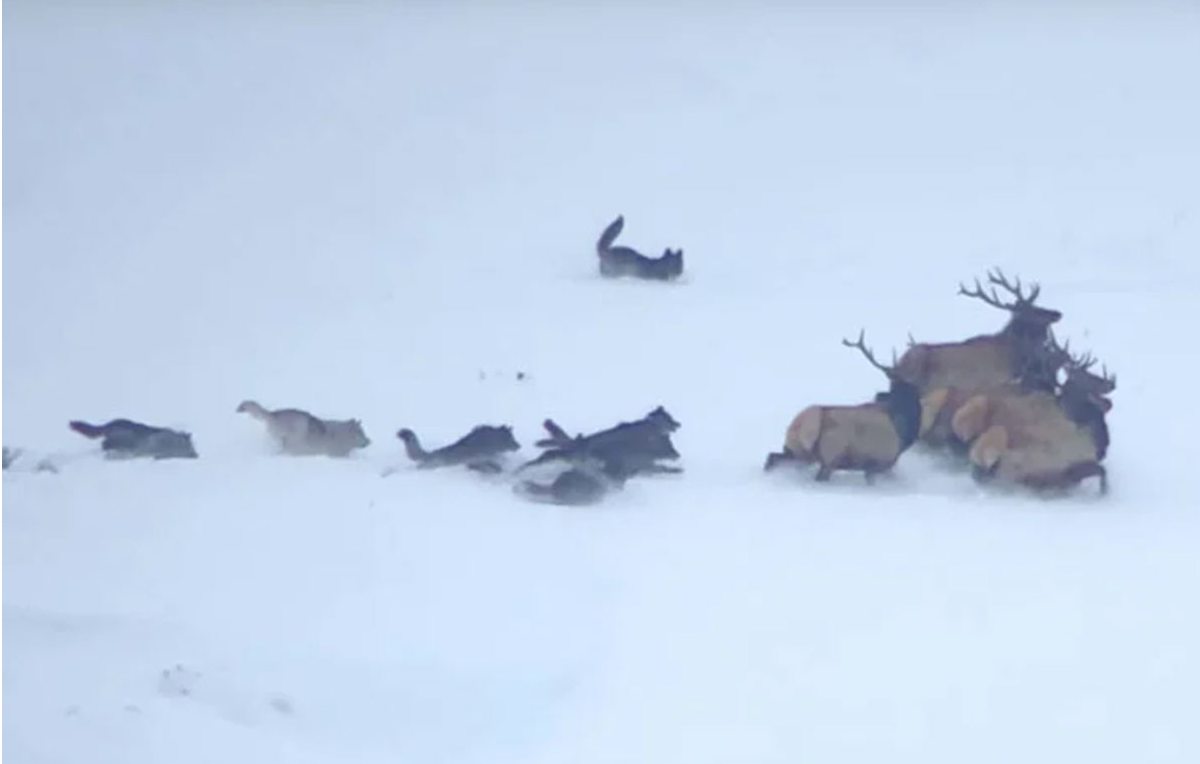
Although they sometimes attack big targets, wolves prefer to hunt the vulnerable. They dress in sheep’s clothing, pretending to protect the weak and the downtrodden. But when the weak or downtrodden step out of line, wolves turn on them without a moment’s hesitation. Wolves appear to be more numerous than they really are, perhaps because they howl incessantly. They are proud virtue-signallers. Some truly believe in the cause, but activism is also a means to professional and social standing: they compete with one another for status within the pack.
Quiet Accommodators Resemble Sheep
Just over one quarter of Canadians are “quiet accommodators.” Like wolves, they are progressives, tending to agree with safe spaces and trigger warnings — but they lack the intensity of a predator. Let’s call them sheep. They are the foot soldiers of the culture wars; they believe in social justice dogma because that is what they have been fed. They crave approval and belonging.
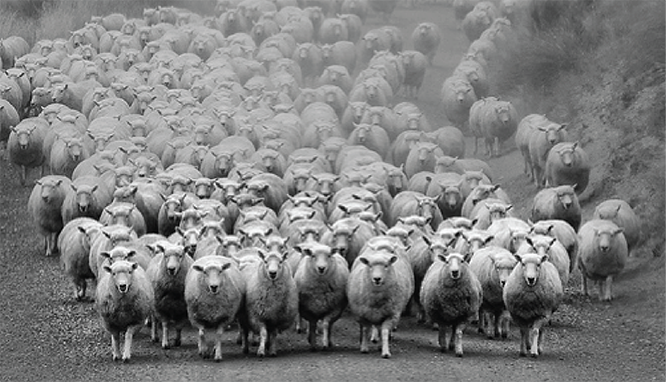
Some sheep don’t understand social justice ideology beyond catchphrases and knee-jerk reactions, but they know those very well. Sheep can be found in positions of authority, where they enthusiastically enforce woke policies. They can be primary school principals, CEOs and even premiers. They seek to preserve their status by supporting the “correct” attitudes; in doing so, they willingly follow wolves, failing to understand that wolves are their greatest threat.
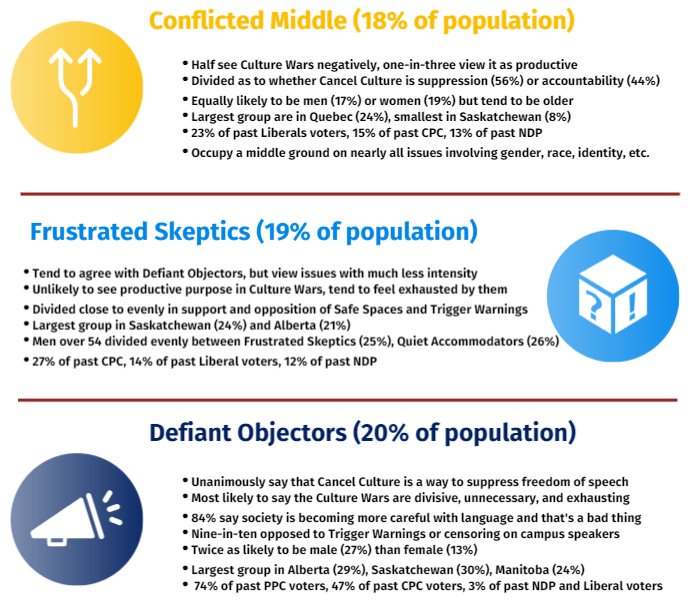
Conflicted Middle Act Like Ostriches
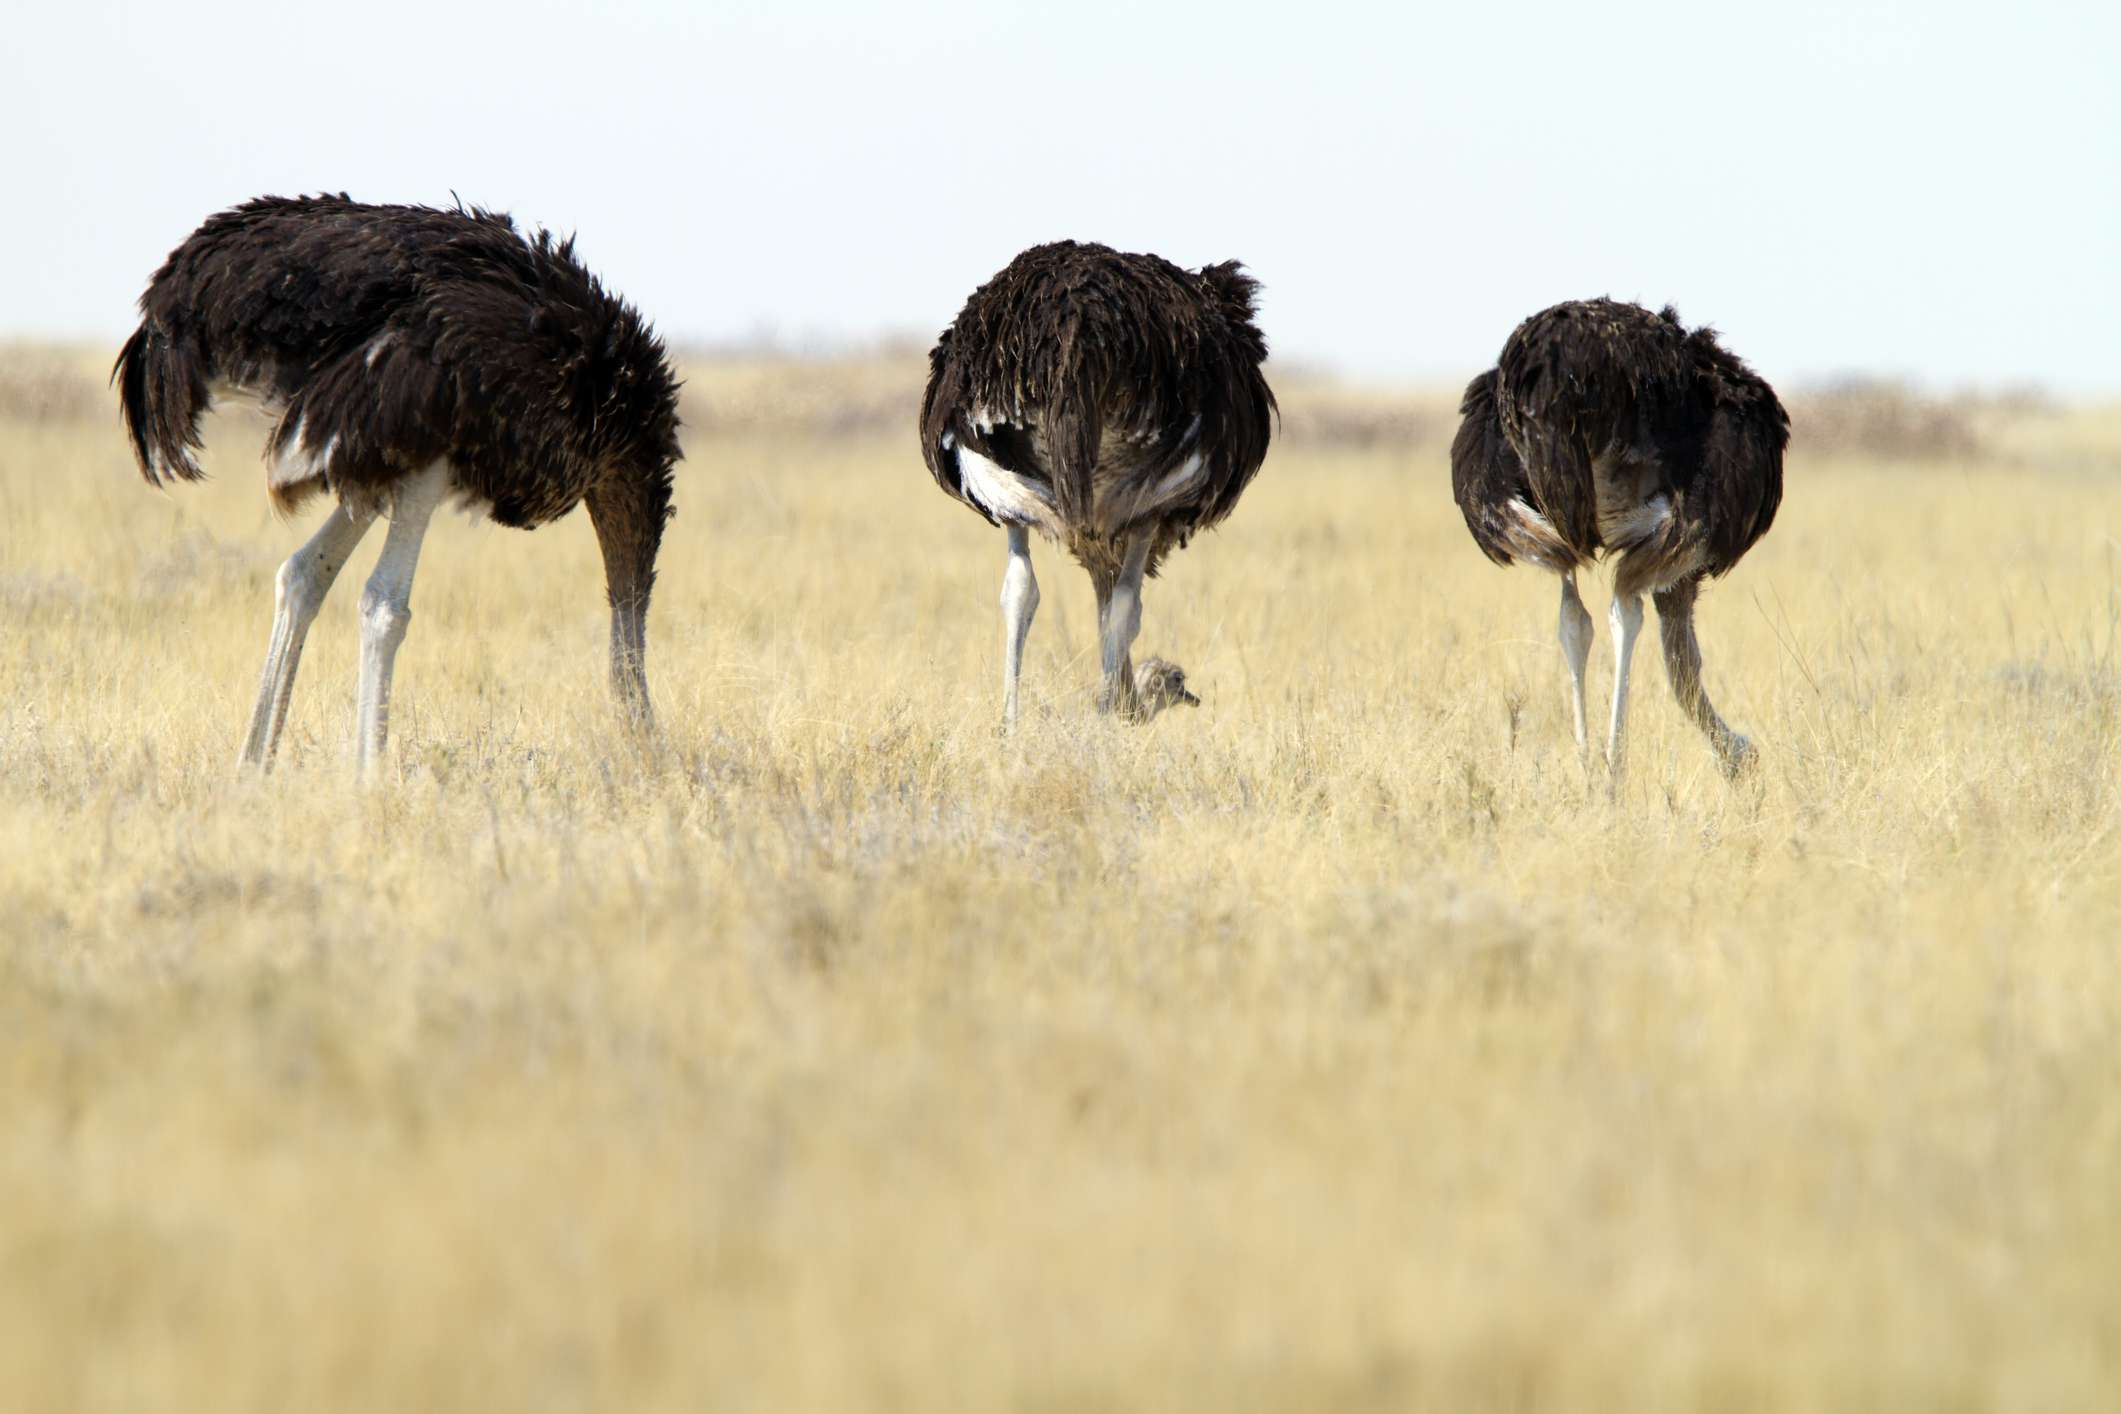
Ostriches don’t actually put their heads in the sand. They mostly lay their heads in the grass, preoccupied with staying well fed.
The “conflicted middle” makes up 18 per cent of the population. They are ostriches who keep their heads close to the ground, divided on culture wars and politics. Ostriches are ambivalent about social justice agendas and cultural revolutions; they comply to avoid any unwanted attention. Like sheep, ostriches seek to preserve their professional or social status. Unlike sheep, who want to belong, ostriches obey to avoid trouble. They tend to abhor politics and prefer not to think about ideology, even when ideology won’t leave them alone. Ostriches just wish the whole thing would go away.
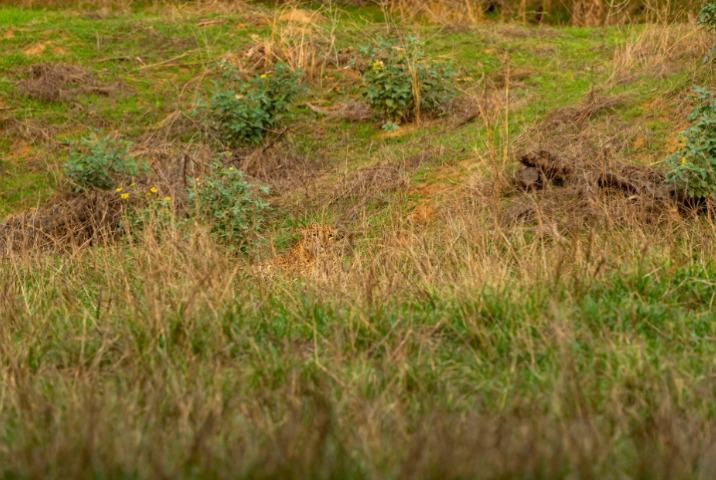
Can you spot the leopard hidden in the grass?
Frustrated Skeptics Lurk Like Leopards
Nineteen per cent of Canadians are “frustrated skeptics.” They view culture wars as tiring and unproductive. Imagine them as leopards, aware and poised, but camouflaged against the scrubby savannah. Leopards object to woke agendas but keep their opinions to themselves. Some feel vulnerable in their jobs or social relationships. Others hide their opposition strategically, believing they can resist more effectively from the inside. Like ostriches, leopards are careful not to provide wolves with a reason to attack. Unlike ostriches, leopards are not ambivalent, but are waiting for the right moment to pounce.
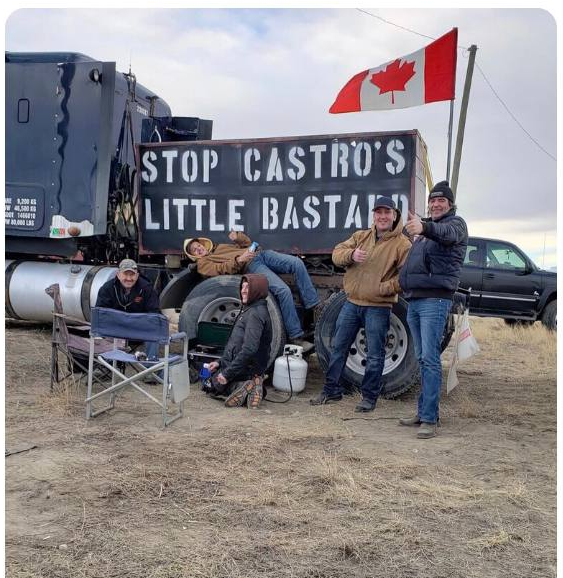
Defiant Objectors Roar Like Lions
A fifth of Canadians are “defiant objectors.” They oppose cancel culture, safe spaces and censorship. These are the lions, who openly roar in disapproval at the progressive transformation of their society. Lions are the only animals in the kingdom who say “hell no” out loud. Some have prominent public profiles, but most lions are simply fearless ordinary people. They sometimes gather in prides, like the truckers and their supporters, but they are naturally inclined to be independent. When lions roar, wolves howl that they are bigots, populists, or members of a fringe minority with unacceptable views.

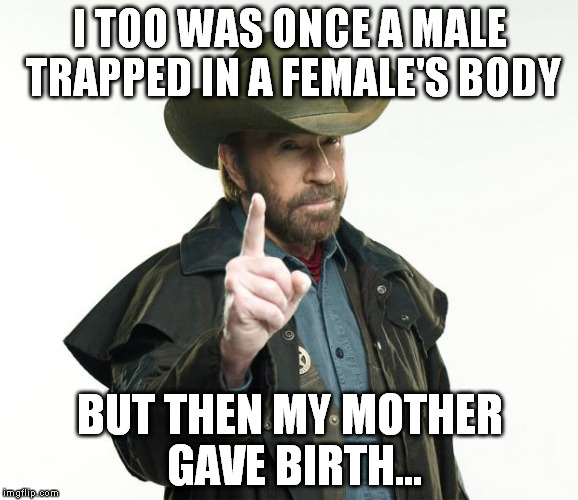
Missteps are dangerous in a culture war. The pack will devour those who commit wrongthink. The most susceptible are sheep and ostriches, who, despite submitting to the regime, are apt to utter inconvenient truths. Social justice ideology is tricky. It contains incoherent positions, changes the meanings of words and constantly moves the target. “My body, my choice” is a rallying cry when it relates to abortion, but racist and misogynist when it applies to vaccine mandates. Sheep and ostriches must navigate an ever-shifting landscape of rules and political correctness.
Leopards can misstep and blow their cover, but sometimes that works out for the best. Once revealed, they may find that they were meant to be lions after all. Lions can’t misstep, at least in the sense of accidentally outing themselves. Out is where they mean to be.
An activist minority is setting the agenda in Canada, but only
for as long as Canadians allow it. Be a lion.
Footnote: A Pride of Lions Roaring in the Streets of Ottawa

Exclusive footage from LifeSiteNews in Ottawa shows thousands of pro-family Canadians formed near Parliament Hill, rivaled by an estimated 350 counter-protesters.
Pro-family Canadians flood Ottawa, other cities for Million Person March against LGBT indoctrination
According to LifeSite’s John-Henry Westen, who was on the ground at the Ottawa march, there was a noticeable number of children present on the pro-family side of the protest, with very few if any children present on the pro-LGBT side. Westen also estimates that the pro-family side outnumbered the pro-LGBT side by roughly ten to one.

Video footage from Toronto and Calgary posted to social media by True North shows thousands of pro-family citizens gathered in protest against LGBT indoctrination in both cities.
Counter-protesters were expected at the events after leaked video footage of a Zoom call appeared online last week showing unions leaders encouraging their members to oppose the pro-family efforts.
Update: Detailed Findings from Angus Reid
The website for this project is Canada and the Culture Wars: In the first of a multi-part series, Canadians weigh in on the nation’s divided discourse
Part One: Defining Canadians’ cultural mindsets
Topical Reports
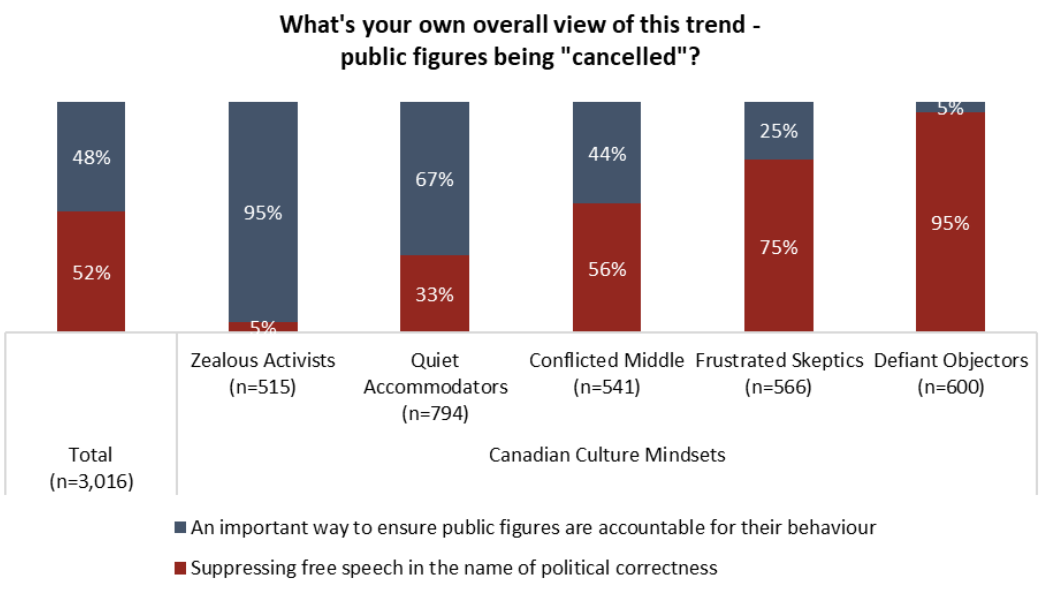
Canadians say we’re changing how we talk to each other,
split over whether it’s a good or bad thing
The first release focused on Canadians views of the culture wars, how we talk to each other, as well as conflict mitigation, censorship, and “cancel culture”. Depending on where they sit on the spectrum of cultural mindsets, Canadians can view these issues as important, informative, exhausting or even unnecessary.
Example:
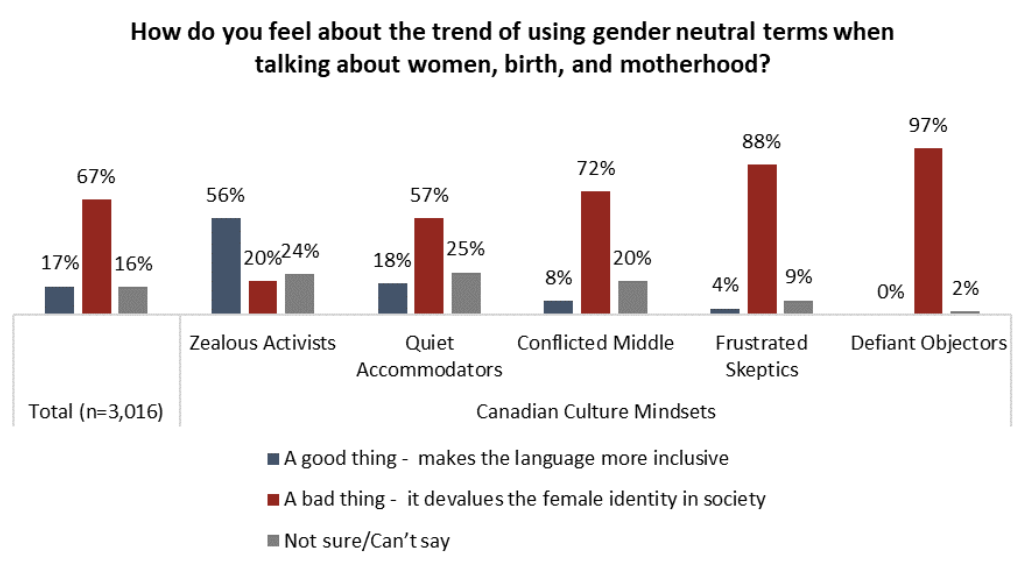
Gender Identity: More than half say male or female;
one-third say that’s too limiting, others unsure
The second release covered Gender Identity – including topics such as gender fluidity and gender neutral language. Also Transgender Issues – how do Canadians say they would react if their child showed an affinity for a gender other than the one they were assigned at birth?
Example:
These forthcoming studies will put a spotlight on:
Climate and the Economy – how should Canada move forward in energy development? Do Canadians support or oppose a wealth tax?
Colonialism and Indigenous Issues – addressing topics such as the legacy of Canada’s colonial history and residential schools
Race and Ethnicity – including topics such as privilege, cultural appropriation, equity, discrimination and racism