
The graph above shows the monthly averages for September Arctic ice extents including 2023 compared to previous years back to 2007. This year is slightly below the 17 year average of 4.63M km2; MASIE shows 4.43M and SII shows 4.37. For comparison the 2007 September values were 4.30M for MASIE and 4.27M for SII. The predictions below refer to the SII value.
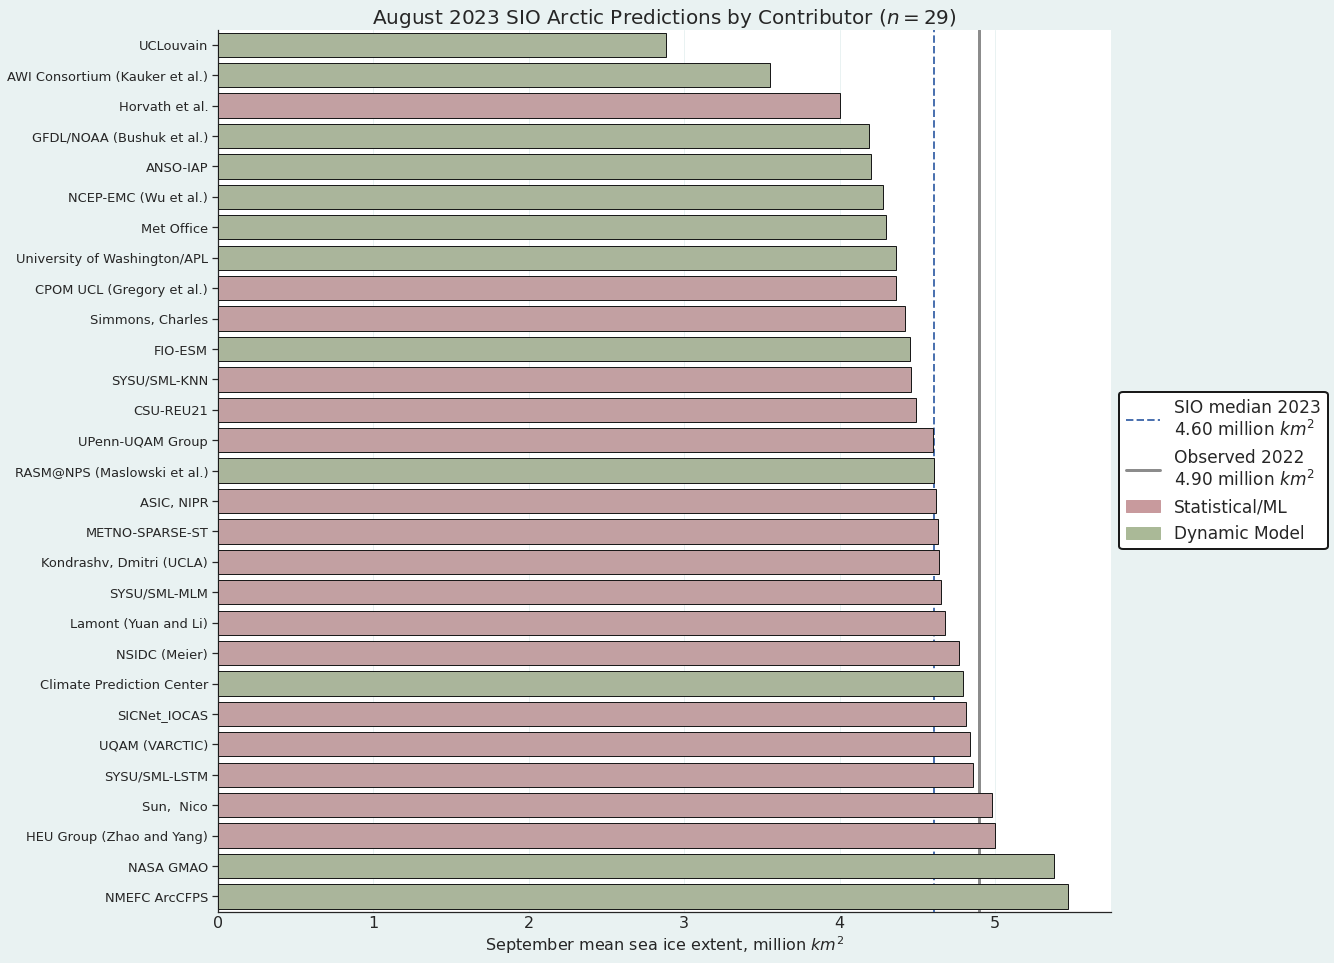
2023: August Report from Sea Ice Prediction Network
The August median forecasted value for pan-Arctic September sea-ice extent is 4.60 million square kilometers with interquartile values of 4.35 and 4.80 million square kilometers, while individual forecasts range from 2.88 to 5.47 million square kilometers. We note that the lowest two forecasts predict a new record September sea-ice extent value (current record is September 2012, with a sea-ice extent of 3.57 million square kilometers), but these forecasts are outliers relative to the other contributions.
These are predictions for the September 2023 monthly average ice extent as reported by NOAA Sea Ice Index (SII). This post provides a look at the 2023 Year To Date (YTD) based on monthly averages comparing MASIE and SII datasets. (17 year average is 2006 to 2022 inclusive).
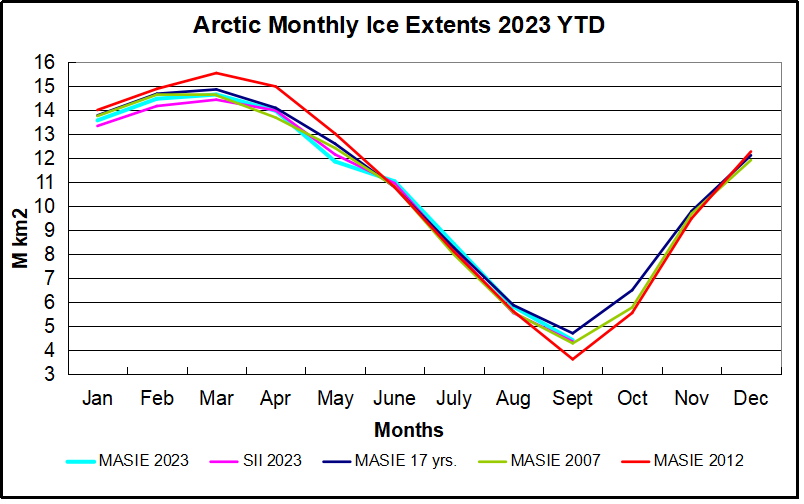
The graph puts 2023 into recent historical perspective. Note how 2023 was slightly below the 17-year average for the first 5 months, then recovered to match average in May and has maintained or exceeded average through August. September was below average slightly and above 2007. The outlier 2012 provided the highest March maximum as well as the lowest September minimum, coinciding with the Great Arctic Cyclone that year. 2007 began the period with the lowest minimum except for 2012. SII 2023 was running below MASIE except for May/June and is currently just below MASIE and above 2007 and 2012.
The table below provides the numbers for comparisons (all are M km2)
| Monthly | MASIE 2023 | SII 2023 | MASIE -SII | MASIE 2023-17 YR AVE | SII 2023-17 YR AVE | MASIE 2023-2007 |
| Jan | 13.579 | 13.347 | 0.232 | -0.207 | -0.250 | -0.183 |
| Feb | 14.481 | 14.177 | 0.304 | -0.207 | -0.292 | -0.171 |
| Mar | 14.655 | 14.440 | 0.215 | -0.212 | -0.248 | 0.032 |
| Apr | 13.979 | 13.992 | -0.013 | -0.120 | -0.025 | 0.283 |
| May | 11.866 | 12.159 | -0.293 | -0.742 | -0.492 | -0.561 |
| June | 11.044 | 10.963 | 0.081 | 0.242 | 0.099 | 0.218 |
| July | 8.431 | 8.183 | 0.248 | 0.152 | 0.150 | 0.439 |
| Aug | 5.825 | 5.561 | 0.264 | -0.062 | -0.083 | 0.241 |
| Sept | 4.430 | 4.371 | 0.059 | -0.285 | -0.360 | 0.132 |
The first two columns are the 2023 YTD shown by MASIE and SII, with the MASIE surpluses in column three. Column four shows MASIE 2023 compared to MASIE 17 year average, while column five shows SII 2023 compared to SII 17 year average. YTD September both MASIE and SII ~300k km2 below average. The last column shows MASIE 2023 holding a September surplus of 132k km2 over 2007.
Summary and Update
The experts involved in SIPN were expecting SII 2023 September to be higher than 2007 and somewhat lower than 2022. The way it came out MASIE September was 285k km2 below average and 132 above 2007. The Chart below shows the October ice recovery is well under way, reaching average briefly.
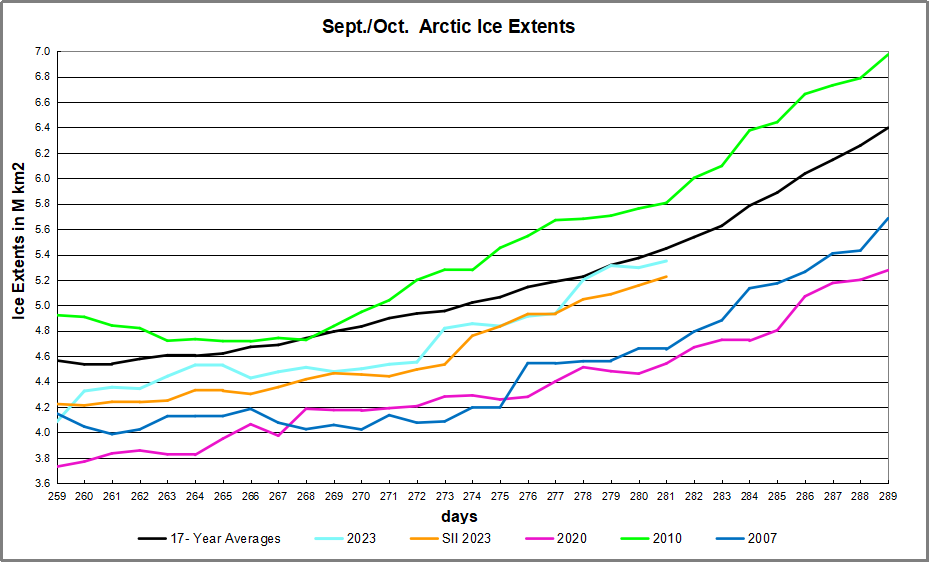
The table shows Day 281 (October 8) ice extents for NH overall and the regions, comparing 2023 to average and several years.
| Region | 2023281 | Day 281 | 2023-Ave. | 2007281 | 2023-2007 |
| (0) Northern_Hemisphere | 5349225 | 5448341 | -99116 | 4653544 | 695681 |
| (1) Beaufort_Sea | 429938 | 633800 | -203862 | 618242 | -188304 |
| (2) Chukchi_Sea | 301437 | 249878 | 51559 | 27562 | 273875 |
| (3) East_Siberian_Sea | 180747 | 397106 | -216358 | 311 | 180436 |
| (4) Laptev_Sea | 423091 | 235120 | 187971 | 302924 | 120168 |
| (5) Kara_Sea | 97994 | 54598 | 43396 | 22717 | 75277 |
| (6) Barents_Sea | 15003 | 21167 | -6164 | 3580 | 11423 |
| (7) Greenland_Sea | 414298 | 285893 | 128405 | 414576 | -278 |
| (8) Baffin_Bay_Gulf_of_St._Lawrence | 74944 | 64730 | 10214 | 71399 | 3545 |
| (9) Canadian_Archipelago | 266487 | 468946 | -202459 | 408841 | -142354 |
| (10) Hudson_Bay | 744 | 4166 | -3423 | 1936 | -1193 |
| (11) Central_Arctic | 3142582 | 3031785 | 110797 | 2780181 | 362401 |
On Day 281 Arctic ice was 100k km2 below average and nearly 700k km2 above 2007. The major deficits were in Beaufort, East Siberian seas and Canadian Archipelago. Offsetting were surpluses in Laptev, Greenland sea and Central Arctic as well as smaller surpluses elsewhere. From previous years we can expect that October 2023 will gain more than 3M km2 of ice extent over the ending extent in September.

i kind of got the gist things re progressing normally. lets face it propaganda is stronger than facts and logic, these days, no matter what reason logic or facts that are famliar to people they wont change their minds. my distrust in government narratives tells me they are lying yet again. normal for sure. so no matter what ehy say or how they make vague 97 percent scientists say this or tha, I just change the channel.
LikeLike