
Special snow goggles for protection in polar landscapes.
Climate Crisis Central apparently triggered Antarctica for this week’s media alarm blitz.
Antarctic Ice Shelves Suffer Staggering Losses | Weather.com
‘Shrinking with no sign of recovery’: Scientists issue warning on Antarctic ice shelves
YAHOO!News
Scientists count huge melts in many protective Antarctic ice shelves. Trillions of tons of ice lost.
Associated Press
Antarctica’s Shrinking Sea Ice Hits a Record Low, Alarming Scientists Bloomberg
Melting Antarctic Ice Shelves Have Dumped More Than 7 Trillion Metric Tons of Water Into the Ocean The Messenger
Etc., Etc. Etc.
Looks like it’s time yet again to play Climate Whack-A-Mole. That means stepping back to get some perspective on the reports and the interpretations applied by those invested in alarmism.
Antarctic Basics
The Antarctic Ice Sheet extends almost 14 million square kilometers (5.4 million square miles), roughly the area of the contiguous United States and Mexico combined. The Antarctic Ice Sheet contains 30 million cubic kilometers (7.2 million cubic miles) of ice. (Source: NSIDC: Quick Facts Ice Sheets)
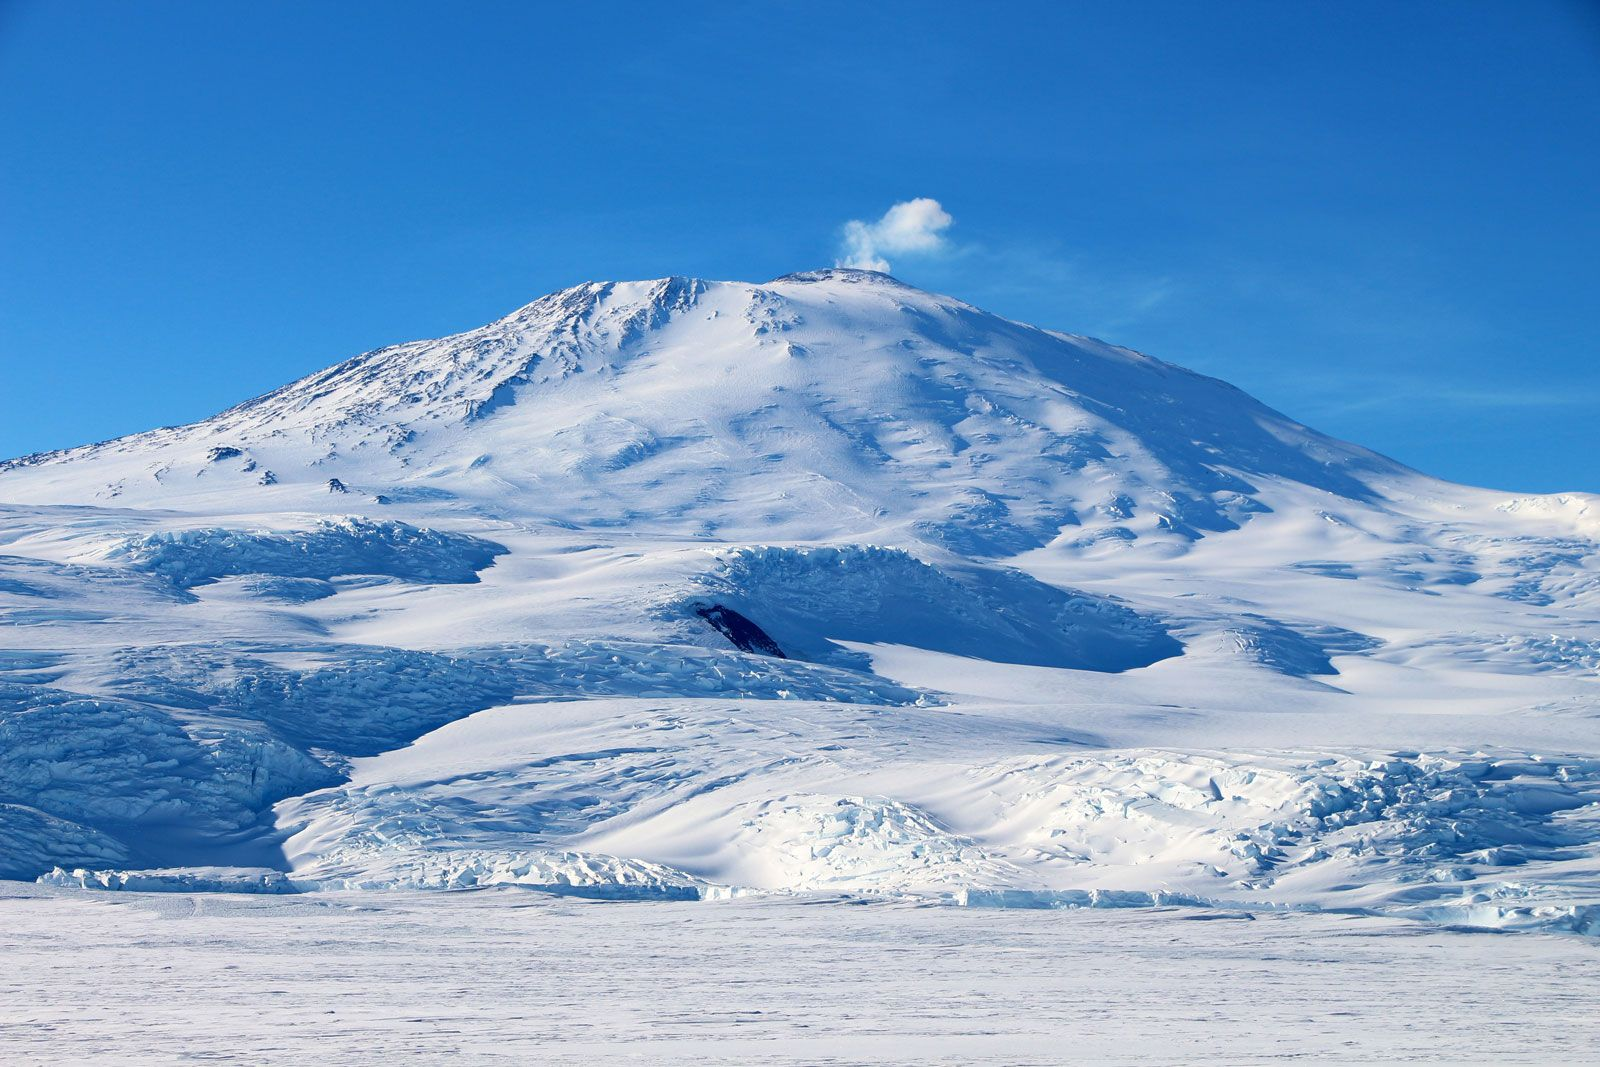
Highly active volcano Mt. Erebus, Ross Island, Antarctica
The Antarctic Ice Sheet covers an area larger than the U.S. and Mexico combined. This photo shows Mt. Erebus rising above the ice-covered continent. Credit: Ted Scambos & Rob Bauer, NSIDC
The study of ice sheet mass balance underwent two major advances, one during the early 1990s, and again early in the 2000s. At the beginning of the 1990s, scientists were unsure of the sign (positive or negative) of the mass balance of Greenland or Antarctica, and knew only that it could not be changing rapidly relative to the size of the ice sheet.
Advances in glacier ice flow mapping using repeat satellite images, and later using interferometric synthetic aperture radar SAR methods, facilitated the mass budget approach, although this still requires an estimate of snow input and a cross-section of the glacier as it flows out from the continent and becomes floating ice. Satellite radar altimetry mapping and change detection, developed in the early to mid-1990s allowed the research community to finally extract reliable quantitative information regarding the overall growth or reduction of the volume of the ice sheets.
By 2002, publications were able to report that both large ice sheets were losing mass (Rignot and Thomas 2002). Then in 2003 the launch of two new satellites, ICESat and GRACE, led to vast improvements in one of the methods for mass balance determination, volume change, and introduced the ability to conduct gravimetric measurements of ice sheet mass over time. The gravimetric method helped to resolve remaining questions about how and where the ice sheets were losing mass. With this third method, and with continued evolution of mass budget and geodetic methods it was shown that the ice sheets were in fact losing mass at an accelerating rate by the end of the 2000s (Veliconga 2009, Rignot et al. 2011b).

Fig. 1. Antarctic Ice Sheet Regions and Drainage Systems (DS). East Antarctica (EA) is divided into EA1 (DS2 to DS11) and EA2 (DS12 to DS17). The Antarctic Peninsula (AP) includes DS24 – 27. West Antarctica (WA) is divided into WA1 (Pine Island Glacier DS22, Thwaites and Smith Glaciers DS21, and the coastal DS20) and WA2 (inland DS1, DS18, and DS19 and coastal DS23). Includes grounded ice within ice shelves and contiguous islands.
Contradictory Findings
A 2021 paper by H. J. Zwally describes the waxing and waning of the Antarctic ice sheet NASA Study: Excess of Mass Gains of the Antarctic Ice Sheet over Mass Losses during 1992 to 2008 Eliminated by Increasing Dynamic Losses to 2016. Excerpts in italics with my bolds.
A new NASA study [Antarctic Mass Balance] confirms that an increase in Antarctic snow accumulation [Siegert, 2003] that began 10,000 years ago in East Antarctica (EA) [Fig. 1] was adding enough ice to the continent during 1992 to 2008 to outweigh increased losses from its increasing glacier discharge into the ocean from West Antarctica (WA) as previously reported [2015 JOG paper]. Since most other studies reported that the Antarctic ice sheet was losing mass, those 2015 results on gaining mass were controversial. The new study derives consistent rates of mass changes over 24 years (1992 to 2016) using radar-altimetry data from ESA’s Envisat (2003-10) and gravimetry data from NASA’s GRACE (2003-16), in addition to the prior use of radar-altimetry data from ERS1/2 (1992-2001) of the European Space Agency (ESA) and laser-altimetry from NASA’s ICESat (2003-08).

However, the new study shows that beginning in 2009, the dynamic losses from the outlet glaciers in the WA1 part of WA strongly increased by 119 Gt a-1 (from 95 to 214 Gt a-1), which was further enhanced by an accumulation mass decrease of 39 Gt a-1 in the inland WA2 part of WA. Nevertheless, that total decrease of 158 Gt a-1 was not enough to bring the whole ice sheet into balance (input equals output), because there was a concurrent accumulation mass increase of 107 Gt a-1 in EA for three years (2009-11). While that temporary EA accumulation increase diminished, the loss from WA reduced by 71 Gt a-1 and the total ice sheet came into balance at -12 ± 46 Gt a-1 during 2012-16, thereby eliminating its effect on sea level rise.

Fig. 2. M(t) mass time series for West Antarctica (WA), East Antarctica (EA), Antarctica Peninsula (AP), and the total Antarctic Ice Sheet (AIS) from ICESat (blue) and GRACE (red) using the derived equalizing corrections (dBcor and GIAcor) for sub-glacial changes in volume and mass of the Earth’s fluid mantle.

Fig. 3. ICESat map of dM/dt total rate of mass change for 2003-2008 with adjusted correction for bedrock motion.
“We now have an accurate record of how the mass balance of the Antarctic ice sheet has changed over 24 years and the causes of those changes. Short-term changes for 3 to 8 years have been caused by fluctuations in snowfall and accumulation, but there is no significant trend during 1992 to 2016. Mass losses have increased from the dynamic thinning and faster ice discharge of outlet glaciers in West Antarctic, and the large long-term mass gain in East Antarctica has continued”, said lead author Jay Zwally. “However, our findings and those of others [e.g. Barletta and others, 2018] also include some good signs about the future stability of the West Antarctic ice sheet, about which there has been much concern and predictions of increasing mass loss”.
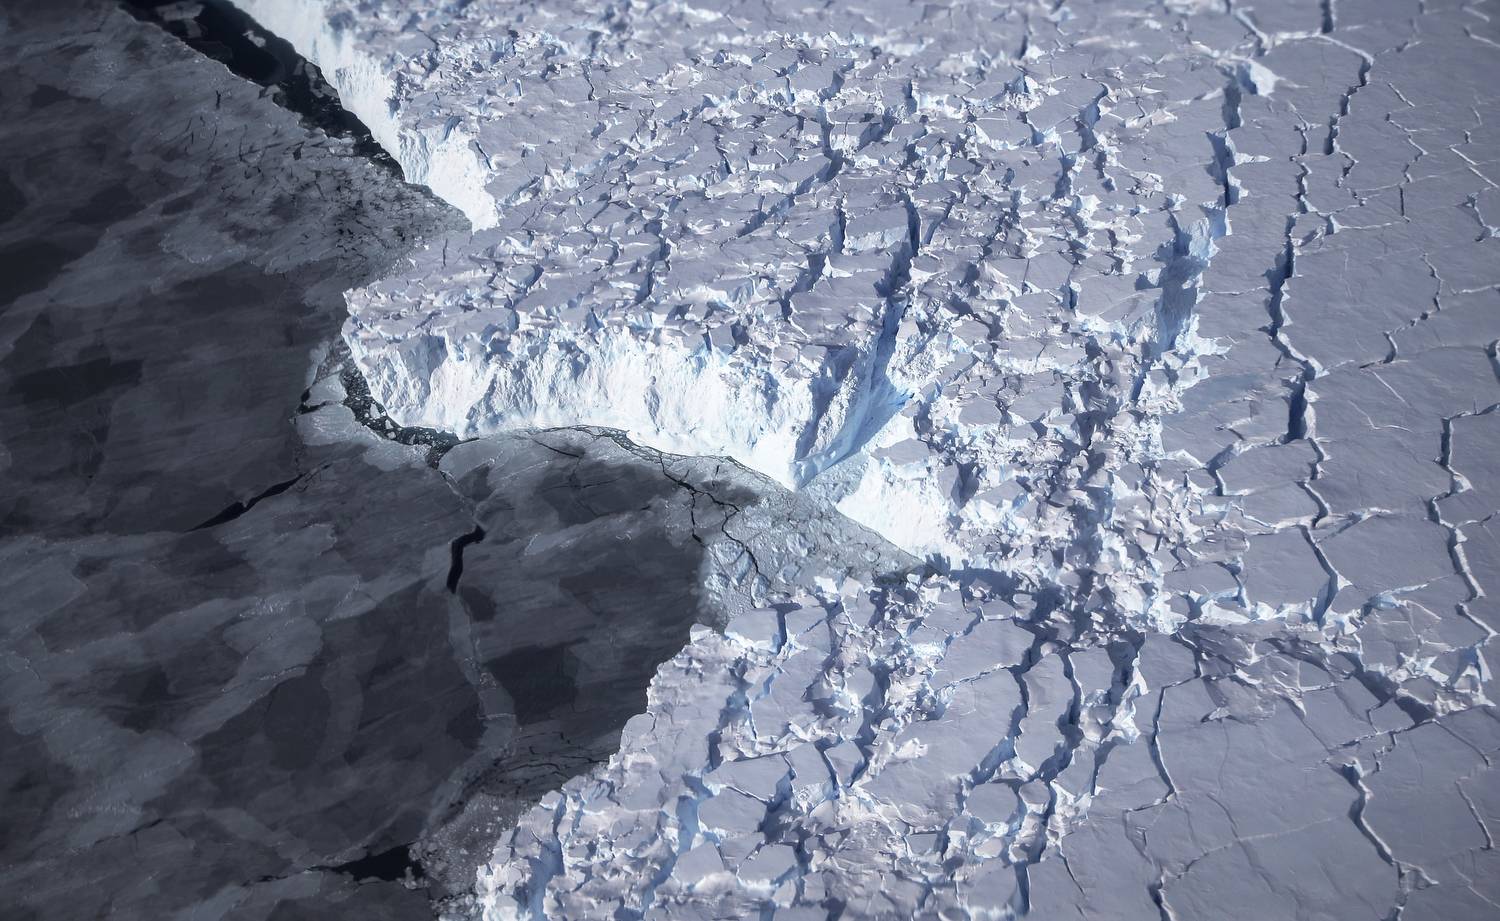
NASA aerial images record West Antarctica melting ice (2016)
Keeping Things in Perspective
Source: NASA
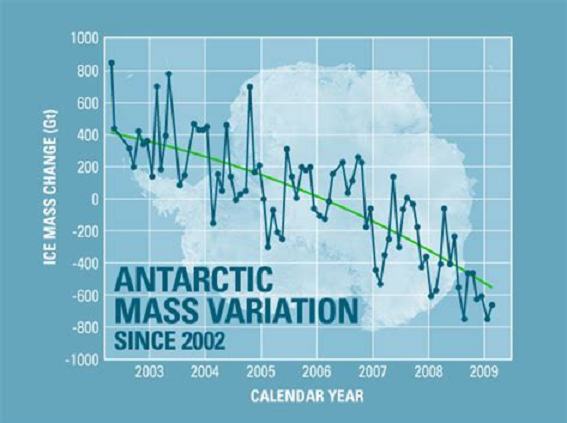
Such reports often include scary graphs like this one and the reader is usually provided no frame of reference or context to interpret the image. First, the chart is showing cumulative loss of mass arising from an average rate of 100 Gt lost per year since 2002. Many years had gains, including 2002, and the cumulative loss went below zero only in 2006. Also, various methods of measuring and analyzing give different results, as indicated by the earlier section.
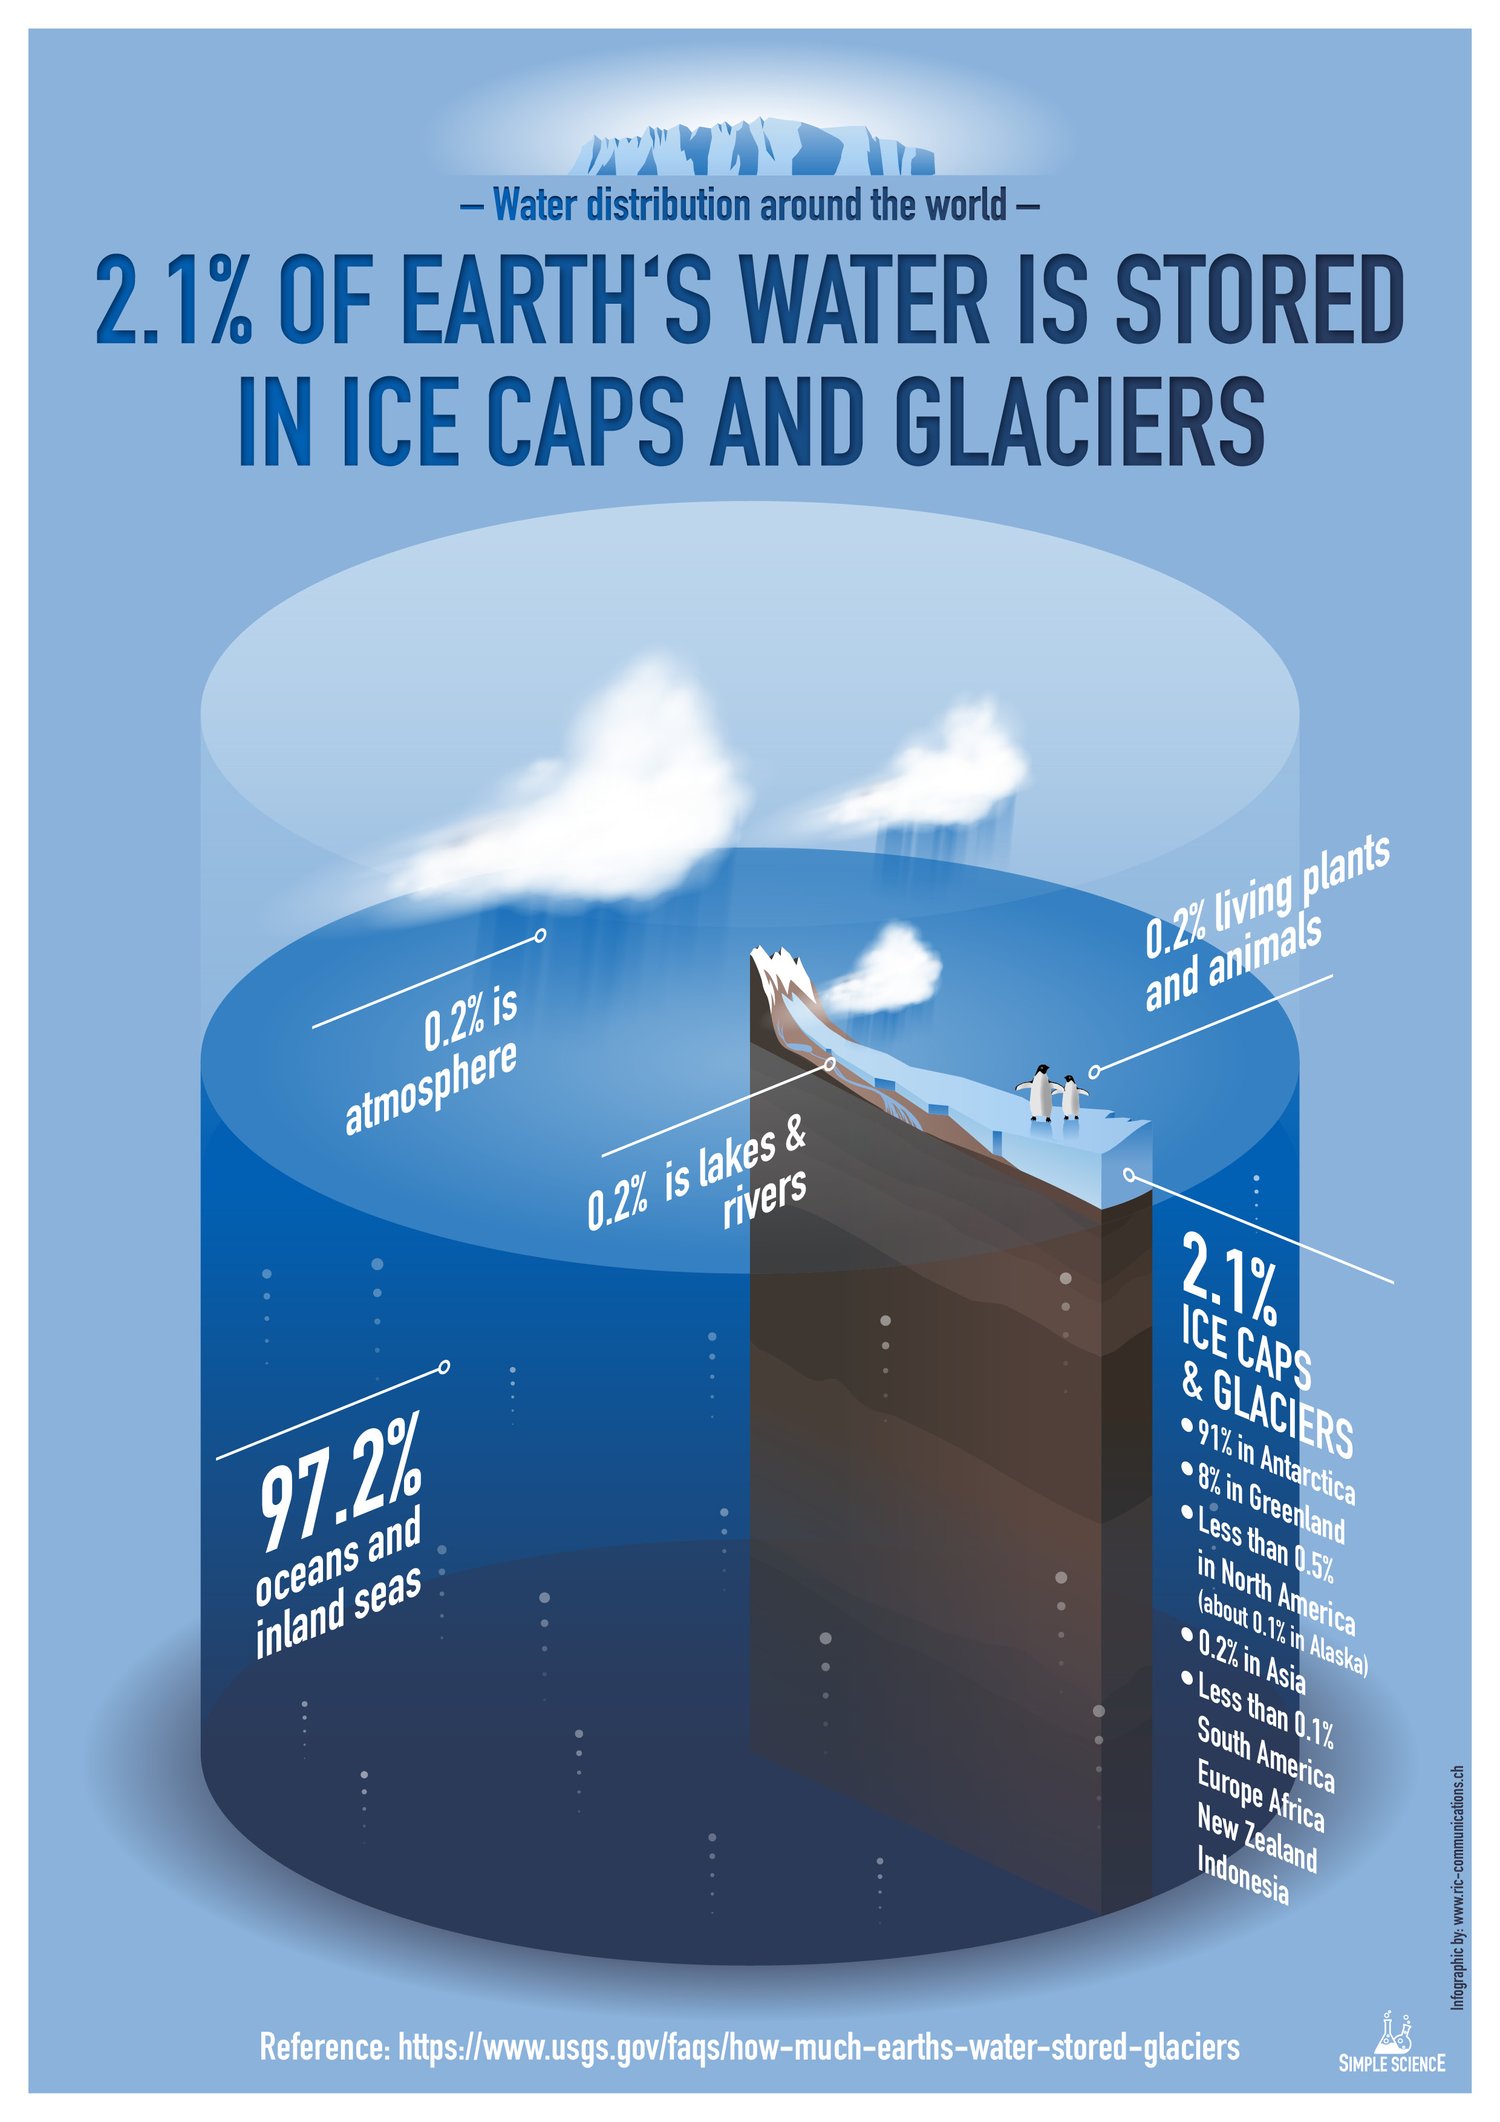
Most important is understanding the fluxes in proportion to the Antarctic Ice Sheet. Let’s do the math. Above it was stated Antarctica contains ~30 million cubic kilometers of ice volume. One km3 of water is 1 billion cubic meters and weighs 1 billion tonnes, or 1 gigatonne. So Antarctica has about 30,000,000 gigatonnes of ice. Since ice is slightly less dense than water, the total should be adjusted by 0.92 for an estimate of 27.6 M Gts of ice comprising the Antarctic Ice Sheet.
So in the recent decade, an average year went from 27,600,100 Gt to 27,600,000, according to one analysis. Other studies range from losing 200 Gt/yr to gaining 100 Gt/yr.
Even if Antarctica lost 200 Gt/yr. for the next 1000 years,
it would only approach 1% of the ice sheet.
If like Al Gore you are concerned about sea level rise, that calculation starts with the ocean area estimated to be 3.618 x 10^8 km2 (361,800,000 km2). To raise that area 1 mm requires 3.618×10^2 km3 or 361.8 km3 water (1 km3 water=1 Gt.) So 200 Gt./yr is about 0.55mm/yr or 6 mm a decade, or 6 cm/century.
By all means let’s pay attention to things changing in our world, but let’s also notice the scale of the reality and not make mountains out of molehills.
Let’s also respect the scientists who study glaciers and their subtle movements over time (“glacial pace”). Below is an amazing video showing the challenges and the beauty of working on Greenland Glacier.
From Ice Alive: Uncovering the secrets of Earth’s Ice
For more on the Joys of Playing Climate Whack-A-Mole

Watched the movie. A few things that struck me are;
– They said it is a problem. Why is it a problem, isn’t it more a question. Problem assumes a negative, but perhaps it is a positive.
– I completely agree we should measure the changes, and even consider if man has an effect, but these people seem to have already concluded man is affecting the ice in a major way and therefore are violating one rule of science, that being, if you theorize a cause and effect, you design your work to disprove your theory, not prove it. By not finding a way to disprove your theory, you are adding evidence to it being valid.
– so, we have good measurements for about 30 years for a planet millions of years old. To draw any conclusion such a small time is simply ludicrous
– who determined that the earths best weather was 100, 200, or some other time ago was the right weather. Perhaps the earth being warmer is better.
– when ice melts it becomes more dense, so shouldn’t that reduce the volume of water and lower the ocean levels? Just saying
LikeLike
Juan, good points. On the properties of water, I like this post:
LikeLike