In January, most of the Arctic ocean basins are frozen over, and so the growth of ice extent slows down. According to MASIE January on average adds 1.2M km2, and this month it was 1.1M. However, 2024 started above average and quickly grew to 14M km2 (14 Wadhams), before slowing down and ending January slightly above the 18 year average. The few basins that can grow ice this time of year tend to fluctuate and alternate waxing and waning, which appears as a see saw pattern in these images.
On the left is the Pacific seesaw with Bering below and Okhotsk above. This year Okotsk added ice steadily, and slowed at the end, while Bering waffled up and down mid month before gaining ice at the end. The Atlantic seesaw is Barents top center and Baffin on the right below Greenland. Barents grew ice steadily until mid January, then gave almost all of it back by the end. Baffin added ice slowly all month, then accelerated the last two weeks.
While the seesaws are tilting back and forth on the margins, the bulk of the Arctic is frozen solid. And with limited places where more extent can be added, the pace of overall growth has slowed. Note that at 14.4M km2 Arctic ice extent now has about six weeks to break the 15M km2 annual ceiling mid March.
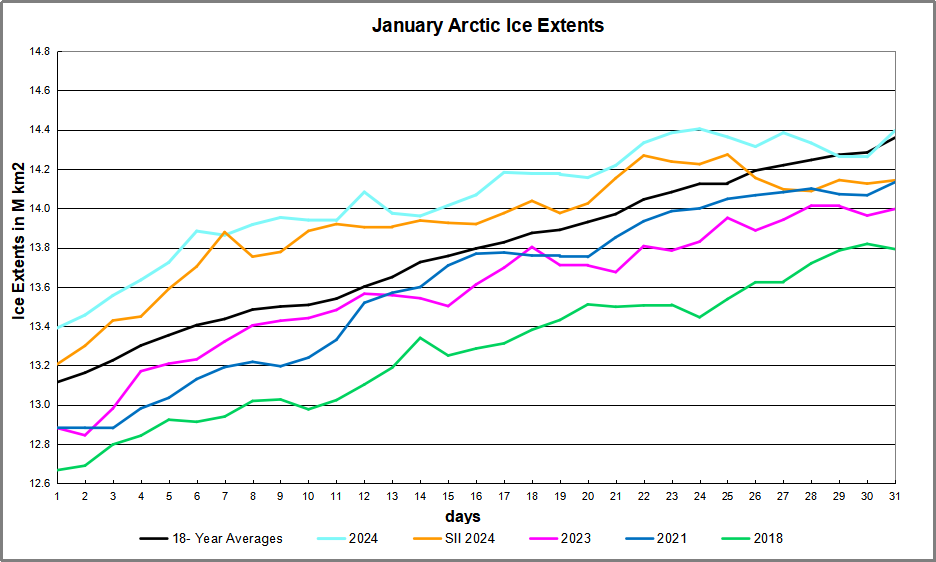
The graph shows the 18-year average gain for January is 1.2M km2. 2024 started with 275k km2 surplus ice extent and ended slightly above average, while and other recent years were lower. SII showed lower extents most of the month with a 253k km2 deficit to MASIE at the end.
| Region | 2024031 | Day 31 | 2024-Ave. | 2018031 | 2024-2018 |
| (0) Northern_Hemisphere | 14396470 | 14360118 | 36352 | 13792271 | 604199 |
| (1) Beaufort_Sea | 1070983 | 1070351 | 632 | 1070445 | 538 |
| (2) Chukchi_Sea | 966006 | 965973 | 34 | 965971 | 35 |
| (3) East_Siberian_Sea | 1087137 | 1087059 | 78 | 1087120 | 18 |
| (4) Laptev_Sea | 897845 | 897823 | 22 | 897845 | 0 |
| (5) Kara_Sea | 894933 | 918701 | -23769 | 895363 | -430 |
| (6) Barents_Sea | 473076 | 569199 | -96123 | 481947 | -8872 |
| (7) Greenland_Sea | 711708 | 607586 | 104122 | 501411 | 210297 |
| (8) Baffin_Bay_Gulf_of_St._Lawrence | 1272213 | 1331684 | -59471 | 1406903 | -134690 |
| (9) Canadian_Archipelago | 854860 | 853430 | 1430 | 853109 | 1752 |
| (10) Hudson_Bay | 1260903 | 1260770 | 133 | 1260838 | 66 |
| (11) Central_Arctic | 3214505 | 3210272 | 4233 | 3184817 | 29688 |
| (12) Bering_Sea | 665225 | 647841 | 17384 | 382207 | 283018 |
| (13) Baltic_Sea | 71817 | 62350 | 9467 | 41714 | 30103 |
| (14) Sea_of_Okhotsk | 910937 | 818756 | 92181 | 704398 | 206539 |
The table shows regional ice extents in km2. The few deficits are in Baffin Bay and Barents, offset by sizeable surpluses in Greenland and Okhotsk seas. Everywhere else is close to maximum for the year.
The polar bears have a Valentine Day’s wish for Arctic Ice.

And Arctic Ice loves them back, returning every year so the bears can roam and hunt for seals.

Footnote:
Seesaw accurately describes Arctic ice in another sense: The ice we see now is not the same ice we saw previously. It is better to think of the Arctic as an ice blender than as an ice cap, explained in the post The Great Arctic Ice Exchange.

One comment