Preface
This report is written for people wishing to form their own opinion on issues relating to climate. Its focus is on publicly available observational datasets, and not on the output of numerical models, although there are a few exceptions, such as Figure 42. References and data sources are listed at the end.
The observational data presented here reveal a vast number of natural variations, some of which appear in more than one series. The existence of such natural climatic variations is not always fully acknowledged, and therefore generally not considered in contemporary climate conversations. The drivers of most of these climatic variations are not yet fully understood, but should represent an important focus for climatic research in future.
In this report, meteorological and climatic observations are described according to the following overall structure: atmosphere, oceans, sea level, sea ice, snow cover, precipitation, and storms. Finally, in the last section (below), the observational evidence as at 2023 is briefly summarised.
Ten facts about the year 2023
1. Air temperatures in 2023 were the highest on record (since 1850/1880/1979, according to the particular data series). Recent warming is not symmetrical, but is mainly seen in the Northern Hemisphere (Figures 1 and 13).
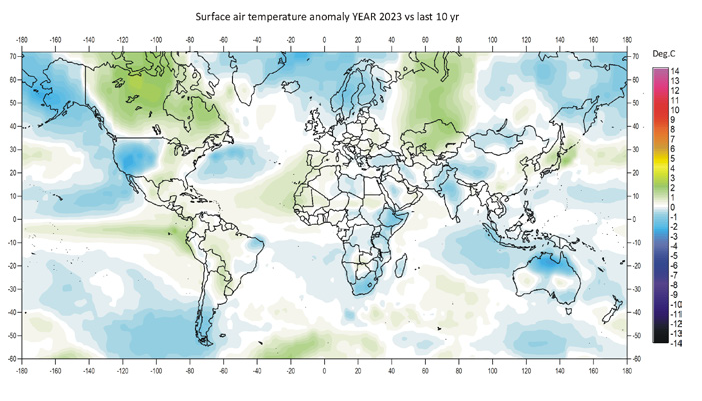
Figure 1: 2023 surface air temperatures compared to the average for the previous 10 years. Green-yellow-red colours indicate areas with higher temperature than the average, while blue colours indicate lower than average temperatures. Data source: Remote Sensed Surface Temperature Anomaly, AIRS/Aqua L3 Monthly Standard Physical Retrieval 1-degree x 1-degree V006 (https://airs.jpl.nasa.gov/), obtained from the GISS data portal (https://data.giss.nasa.gov/gistemp/maps/).
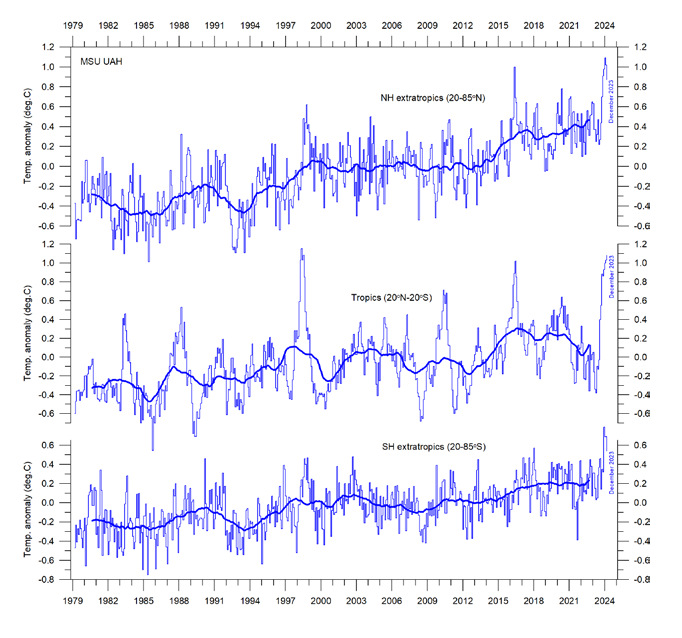
Figure 13: Zonal air temperatures. Global monthly average lower troposphere temperature since 1979 for the tropics and the northern and southern extratropics, according to University of Alabama at Huntsville, USA. Thin lines: monthly value; thick lines: 3-year running mean.
2. Arctic air temperatures have increased during the satellite era (since 1979), but Antarctic temperatures remain essentially stable (Figure 14).
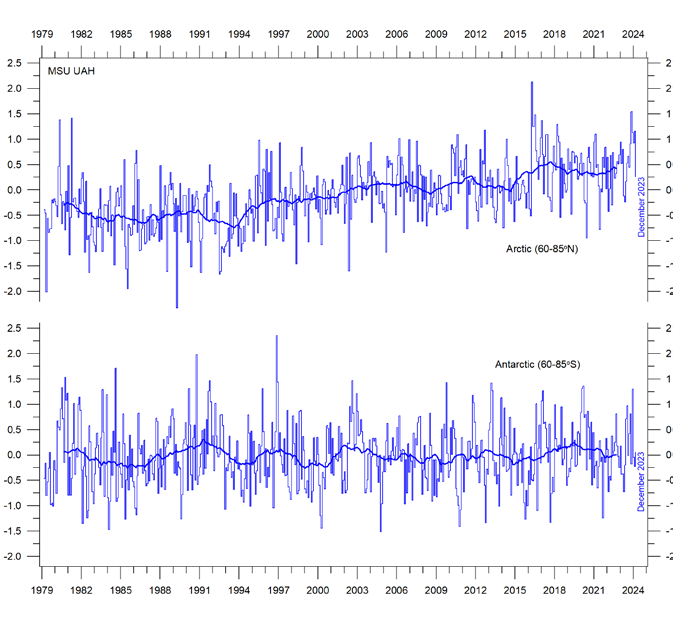
Figure 14: Polar temperatures Global monthly average lower troposphere temperature since 1979 for the North and South Pole regions, according to University of Alabama at Huntsville (UAH), USA. Thick lines are the simple running 37-month average.
3. Since 2004, globally, the upper 1900m of the oceans has seen net warming of about 0.037°C. The greatest warming (of about 0.2°C) is in the uppermost 100m, and mainly in regions near the Equator, where the greatest amount of solar radiation is received (Figure 28).
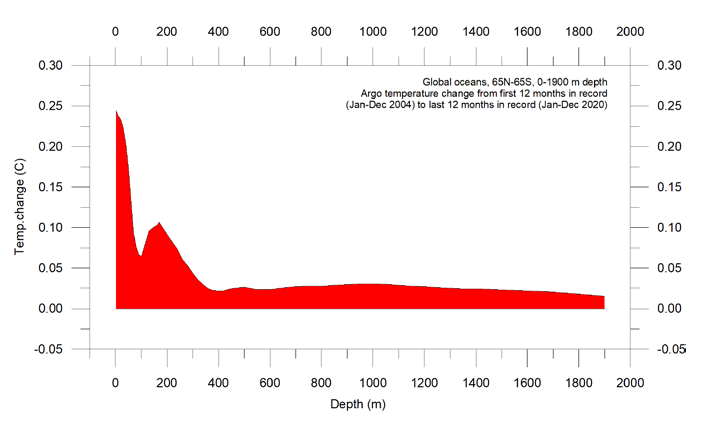
Figure 28: Temperature changes 0–1900m Global ocean net temperature change since 2004 from surface to 1900m depth, using Argo-data. Source: Global Marine Argo Atlas.
4. Since 2004, the northern oceans (55–65°N) have, on average, experienced a marked cooling down to 1400m depth, and slight warming below that (Figure 29). Over the same period, the southern oceans (55–65°S) have, on average, seen some warming at most depths (above 1900m), but mainly near the surface.
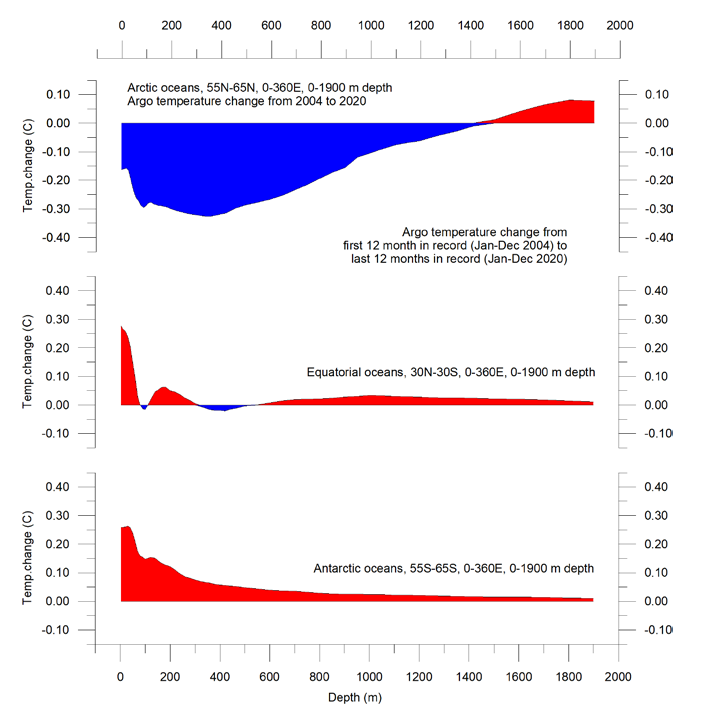
Figure 29: Temperature changes 0–1900m Global ocean net temperature change since 2004 from surface to 1900m depth. Source: Global Marine Argo Atlas
5. Sea level globally is increasing at about 3.4 mm per year or more according to satellites, but only at 1-2 mm per year according to coastal tide gauges (Figures 39 and 41). Local and regional sea-level changes usually deviate significantly from such global averages.
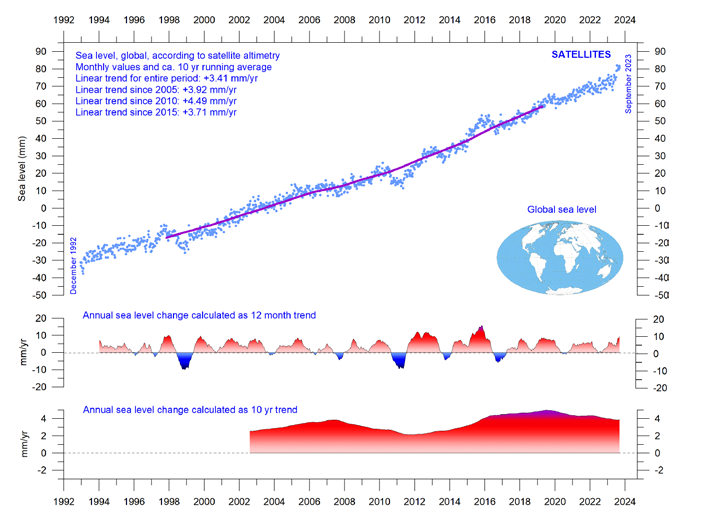
Figure 39: Global sea level change since December 1992 The two lower panels show the annual sea level change, calculated for 1- and 10-year time windows, respectively. These values are plotted at the end of the interval considered. Source: Colorado Center for Astrodynamics Research at University of Colorado at Boulder. The blue dots are the individual observations (with calculated GIA e”ect removed), and the purple line represents the running 121-month (ca. 10-year) average.
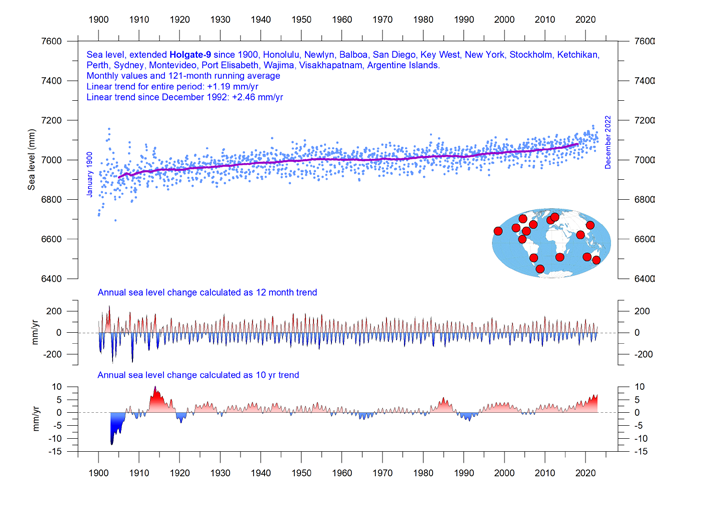
Figure 41: Holgate-9 monthly tide gauge data from PSMSL Data Explorer The Holgate-9 are a series of tide gauges located in geologically stable sites. The two lower panels show the annual sea level change, calculated for 1- and 10-year time windows, respectively. These values are plotted at the end of the interval considered. Source: Colorado Center for Astrodynamics Research at University of Colorado at Boulder. The blue dots are the individual observations, and the purple line represents the running 121-month (ca. 10-year) average.
6. Global sea-ice extent remains well below the average for the satellite era (since 1979). Since 2018, however, it has remained quasistable, perhaps even exhibiting a small increase (Figure 43).
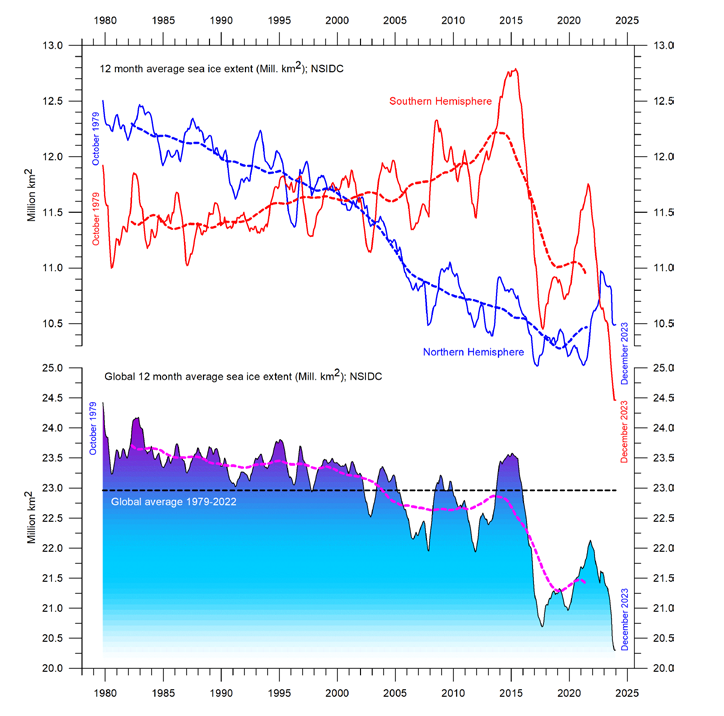
Figure 43: Global and hemispheric sea ice extent since 1979 12-month running means. The October 1979 value represents the monthly average of November 1978–October 1979, the November 1979 value represents the average of December 1978–November 1979, etc. The stippled lines represent a 61-month (ca. 5 years) average. The last month included in the 12-month calculations is shown to the right in the diagram. Data source: National Snow and Ice Data Center (NSIDC).
7. Global snow cover has remained essentially stable throughout the satellite era (Figure 47), although with important regional and seasonal variations.
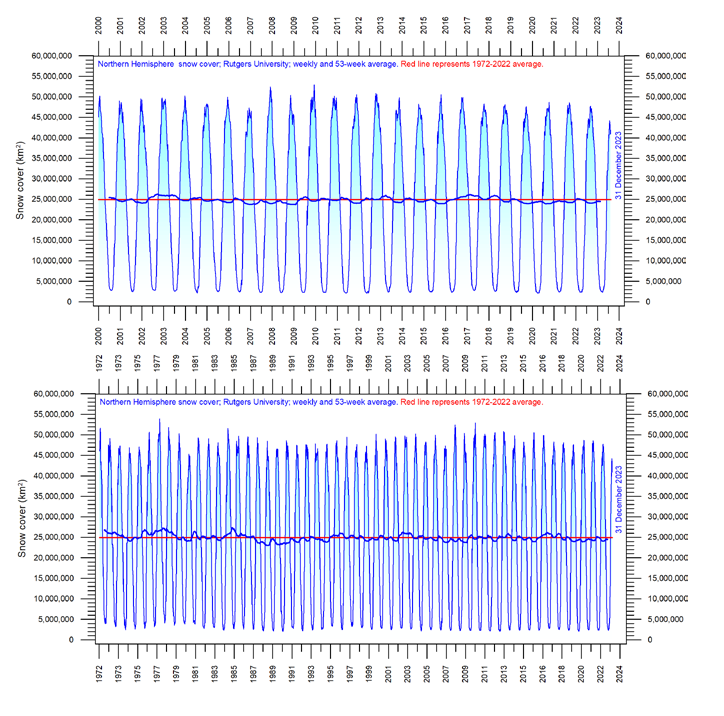
Figure 47: Northern hemisphere weekly snow cover since 2000 (a) Since January 2000 and (b) Since 1972. Source: Rutgers University Global Snow Laboratory. The thin blue line is the weekly data, and the thick blue line is the running 53-week average (approximately 1 year). The horizontal red line is the 1972–2022 average.
8. Global precipitation varies from more than 3000mm per year in humid regions to almost nothing in deserts. Global average precipitation exhibits variations from one year to the next, and from decade to decade, but since 1901 there has been no clear overall trend (Figure 50).
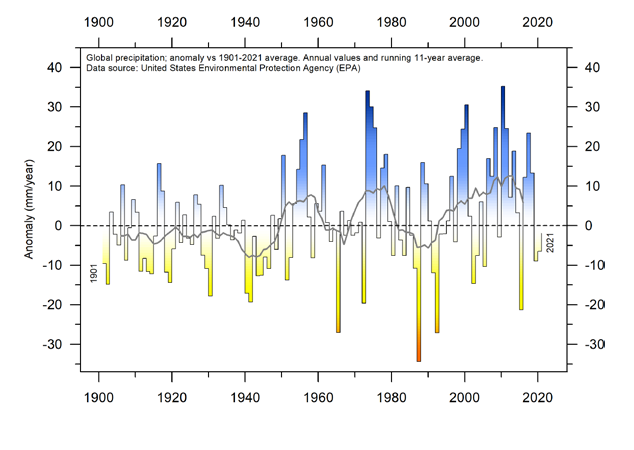
Figure 50: Global precipitation anomalies. Variation of annual anomalies in relation to the global average precipitation from 1901 to 2021 based on rainfall and snowfall measurements from land-based weather stations worldwide. Data source: United States Environmental Protection Agency (EPA).
9. Storms and hurricanes display variable frequency over time, but without any clear global trend towards higher or lower values (Figure 51).
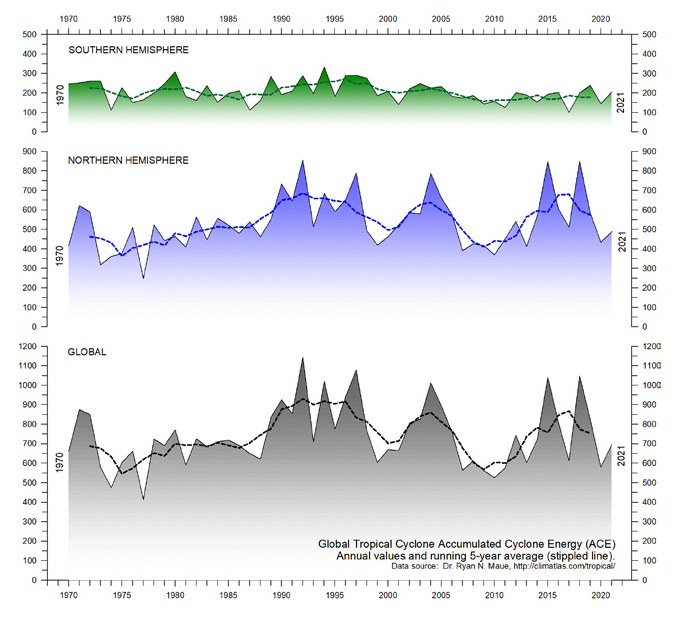
Figure 51: Annual global accumulated cyclone energy Source: Ryan Maue.
10. Observations confirm the continuing long-term variability of average meteorological and oceanographic conditions, but do not support the notion of an ongoing climate crisis.
Summing up
The global climate system is multifaceted, involving sun, planets, atmosphere, oceans, land, geological processes, biological life, and complex interactions between them. Many components and their mutual coupling are still not fully understood or perhaps not even recognised.
Believing that one minor constituent of the atmosphere (CO2) controls nearly all aspects of climate is naïve and entirely unrealistic.
The global climate has remained in a quasi-stable condition within certain limits for millions of years, although with important variations playing out over periods ranging from years to centuries or more, but the global climate has never been in a fully stable state without change.
Modern observations show that this behaviour continues today;
there is no evidence of a global climate crisis.
There is no charge for content on this site, nor for subscribers to receive email notifications of postings.

if the satellite sea-level is increasing much faster than the coastal rate, where is the water going?
has anyone explained this difference?
LikeLike
Jack, it’s complicated. Short answer: Satellites attempt to measure thermal expansion of the
ocean compared to a theoretical ellipsoid
Long answer here:
LikeLike
thanks a lot, Ron,
I think that I understand now.
best regards, Jack.
LikeLike