In April, most of the Arctic ocean basins are still frozen over, and so the melting of ice extent begins in the marginal regions. According to MASIE, April on average loses 1.1M km2, and this month it was 1.4M. However, April 2024 started well above average, slipped into deficit and ended up above normal. The few basins where open water appears this time of year tend to fluctuate and alternate waxing and waning, which appears as a see saw pattern in these images.
On the left is the Pacific seesaw with Bering below and Okhotsk above. This year Okhotsk melted out rapidly, and at the end held only 181k km2, 14% of its March maximum. Meanwhile Bering waffled up and down and retained ~60% (444k km2) of its max ice at the end. The Atlantic seesaw is Barents top center and Baffin on the right below Greenland. Barents also waffled but lost no ice extent until the last week, ending up with 666k km2 (76% of its max). Baffin fluctuated before ending down to 1.06M (72% of its. max.).
While the bulk of the Arctic is frozen solid, the melting has started with the seesaws tilting back and forth in the four regions noted above. The graph below shows the April patterns for ice extents on average, this year and some other years of note.
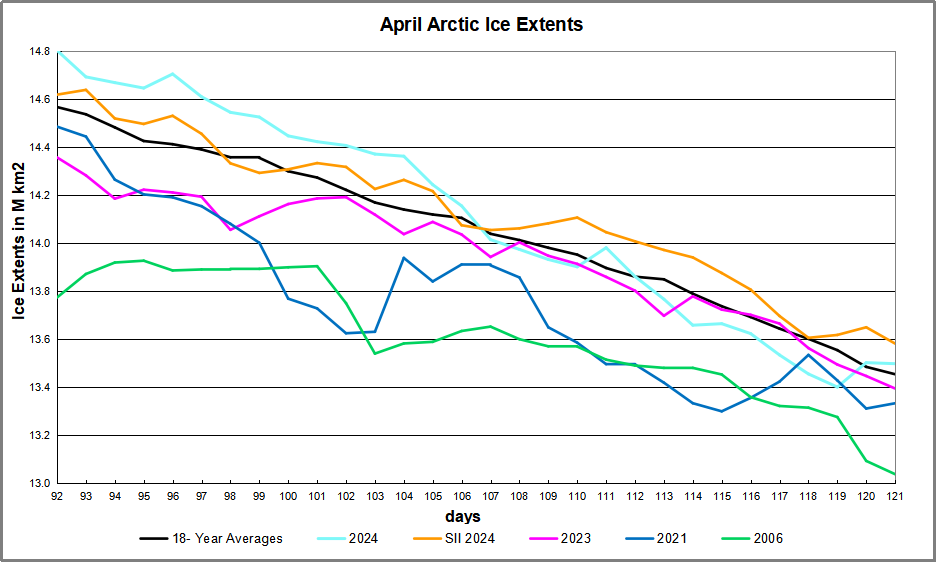
The graph shows the 18-year average loss for April is 1.1M km2. 2024 started with 236k km2 surplus ice extent and ended 44k km2 above average. SII showed lower extents the first half, and greater extents the latter half, ending with a small surplus to MASIE. Other recent years have been nearly average, while 2006 ended with a large deficit.
| Region | 2024121 | Day 121 Ave | 2024-Ave. | 2006121 | 2024-2006 |
| (0) Northern_Hemisphere | 13498263 | 13454328 | 43935 | 13037927 | 460336 |
| (1) Beaufort_Sea | 1070983 | 1068053 | 2931 | 1067609 | 3374 |
| (2) Chukchi_Sea | 965784 | 956102 | 9682 | 965302 | 483 |
| (3) East_Siberian_Sea | 1087137 | 1085711 | 1426 | 1083591 | 3546 |
| (4) Laptev_Sea | 897845 | 890453 | 7392 | 896455 | 1390 |
| (5) Kara_Sea | 930744 | 909660 | 21084 | 911941 | 18803 |
| (6) Barents_Sea | 666436 | 539906 | 126530 | 366229 | 300207 |
| (7) Greenland_Sea | 790758 | 648904 | 141854 | 533678 | 257079 |
| (8) Baffin_Bay_Gulf_of_St._Lawrence | 1060935 | 1195567 | -134633 | 1037524 | 23411 |
| (9) Canadian_Archipelago | 854860 | 849541 | 5320 | 843395 | 11465 |
| (10) Hudson_Bay | 1242383 | 1236594 | 5789 | 1178518 | 63865 |
| (11) Central_Arctic | 3232686 | 3231036 | 1651 | 3098989 | 133698 |
| (12) Bering_Sea | 495771 | 459644 | 36127 | 639162 | -143391 |
| (13) Baltic_Sea | 19703 | 44493 | -24791 | 29017 | -9314 |
| (14) Sea_of_Okhotsk | 180662 | 610735 | -430073 | 381798 | -201136 |
The table shows regional ice extents in km2. Note the huge deficit in Okhotsk and a smaller deficit in Baffin. Everywhere else is in surplus, especially the seas of Barents, Greenland and Bering. 2006 had 460k km2 less ice extent (nearly half a Wadham) than 2024.
The polar bears had a Valentine Day’s wish for Arctic Ice.

And Arctic Ice loves them back, returning every year so the bears can roam and hunt for seals.

Footnote:
Seesaw accurately describes Arctic ice in another sense: The ice we see now is not the same ice we saw previously. It is better to think of the Arctic as an ice blender than as an ice cap, explained in the post The Great Arctic Ice Exchange.
