Roots of Climate Change Distortions

Roger Pielke Jr. explains at his blog Why Climate Misinformation Persists.  Excerpts in italics with my bolds and added images. H/T John Ray

Noble Lies, Conventional Wisdom, and Luxury Beliefs

In 2001, I participated in a roundtable discussion hosted at the headquarters of the National Academy of Sciences (NAS) with a group of U.S. Senators, the Secretary of Treasury, and about a half-dozen other researchers. The event was organized by Idaho Senator Larry Craig (R-ID) following the release of a short NAS report on climate to help the then-new administration of George W. Bush get up to speed on climate change.

At the time I was a 32 year-old fresh-faced researcher about to leave the National Center for Atmospheric Research for a faculty position across town at the University of Colorado. I had never testified before Congress or really had any high-level policy engagement.

When the roundtable was announced, I experienced something completely new in my professional career — several of my much more senior colleagues contacted me to lobby me to downplay or even to misrepresent my research on the roles of climate and society in the economic impacts of extreme weather. I had become fairly well known in the atmospheric sciences research community back then for our work showing that increasing U.S. hurricane damage could be explained entirely by more people and more wealth.

One colleague explained to me that my research, even though scientifically accurate, might distract from efforts to advocate for emissions reductions:

“I think we have a professional (or moral?) obligation to be very careful what we say and how we say it when the stakes are so high.”

At the time, I wrote that the message I heard was that the “ ends justify means or, in other words, doing the “right thing” for the wrong reasons is OK” — even if that meant downplaying or even misrepresenting my own research.

I have thought about that experience over the past few weeks as I have received many comments on the first four installments of the THB series Climate Fueled Extreme Weather (Part 1Part 2Part 3Part 4). One of the most common questions I’ve received asks why it is that the scientific assessments of the Intergovernmental Panel on Climate Change (IPCC) are so different than what is reported in the media, proclaimed in policy, and promoted by the most public-facing climate experts. And, why can’t that gap be closed?

Over the past 23 years, I have wondered a lot myself about this question — not just how misinformation arises in policy discourse (we know a lot about that), but why it is that the expert climate community has been unable or unwilling to correct rampant misinformation about extreme weather, with some even promoting that misinformation.

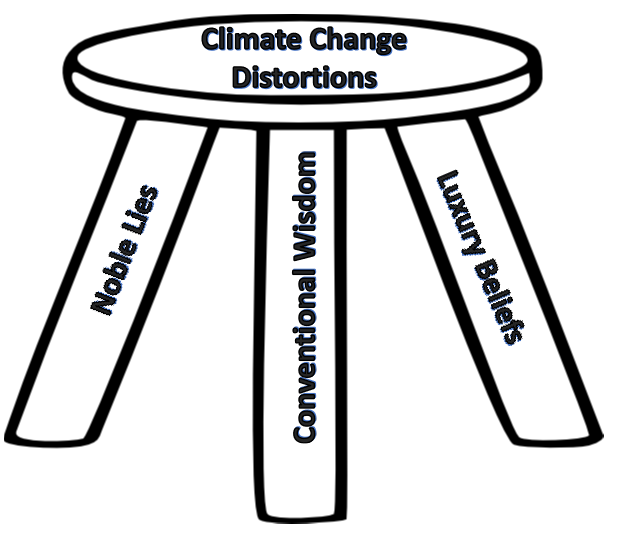
Obviously, I don’t have good answers, but I will propose three inter-related explanations that help me to make sense of these dynamics — the noble lie, conventional wisdom, and luxury beliefs.
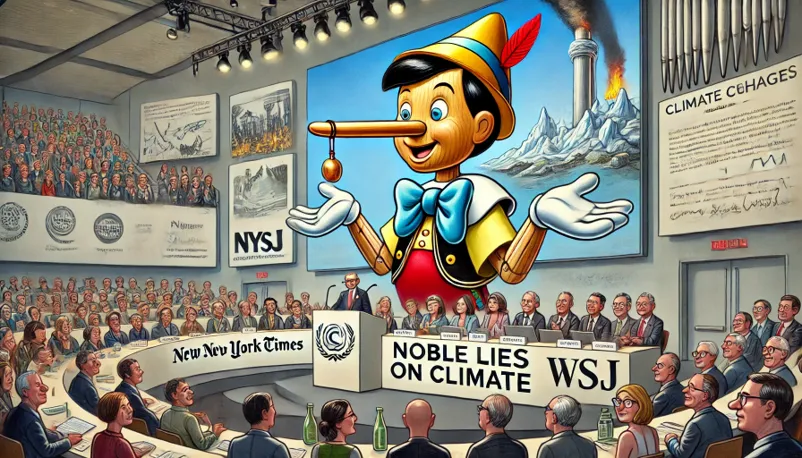
The Noble Lie

The most important explanation is that many in the climate community — like my senior colleague back in 2001 — appear to believe that achieving emissions reductions is so very important that its attainment trumps scientific integrity. The ends justify the means. They also believe that by hyping extreme weather, they will make emissions reductions more likely (I disagree, but that is a subject for another post).

I explained this as a “fear factor” in The Climate Fix:

Typically, the battle over climate-change science focused on convincing (or, rather, defeating) those skeptical has meant advocacy focused on increasing alarm. As one Australian academic put it at a conference at Oxford University in the fall of 2009: “The situation is so serious that, although people are afraid, they are not fearful enough given the science. Personally I cannot see any alternative to ramping up the fear factor.” Similarly, when asked how to motivate action on climate change, economist Thomas Schelling replied, “It’s a tough sell. And probably you have to find ways to exaggerate the threat. . . [P]art of me sympathizes with the case for disingenuousness. . . I sometimes wish that we could have, over the next five or ten years, a lot of horrid things happening—you know, like tornadoes in the Midwest and so forth—that would get people very concerned about climate change. But I don’t think that’s going to happen.” From the opening ceremony of the Copenhagen climate negotiations to Al Gore’s documentary, An Inconvenient Truth, to public comments from leading climate scientists, to the echo-chambers of the blogosphere, fear and alarm have been central to advocacy for action on climate change.

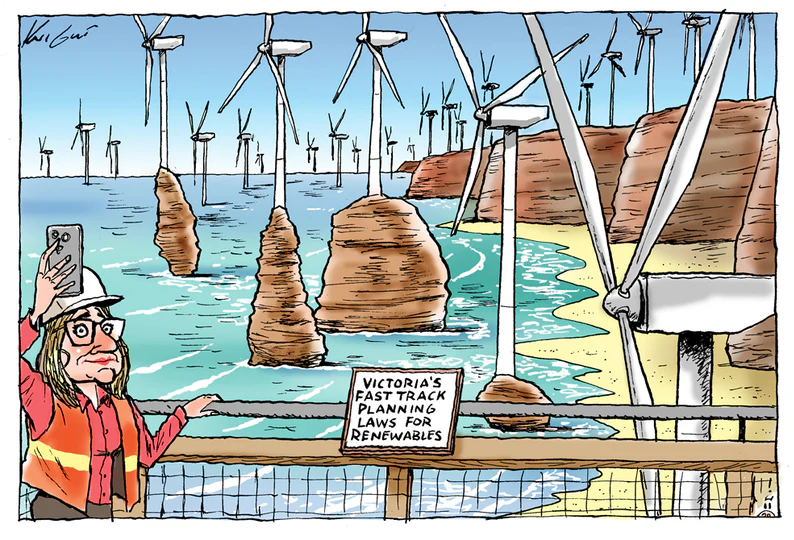
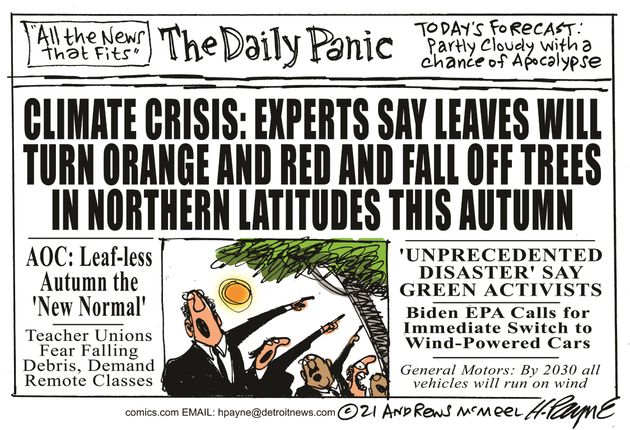
It’s just a short path from climate fueled extreme weather
to the noble lie at the heart of fear-based campaigns.

Conventional Wisdom

The phrase was popularized by John Kenneth Galbraith in his 1958 book, The Affluent Society, where he explained:

It will be convenient to have a name for the ideas which are esteemed at any time for their acceptability, and it should be a term that emphasizes this predictability. I shall refer to these ideas henceforth as the conventional wisdom.

The key point here is “acceptability” regardless of an idea’s conformance with truth. Conventional wisdom is that which everyone knows to be true whether actually true or not. Examples of beliefs that at one time or another were/are conventional wisdom include — Covid-19 did not come from a lab, Sudafed helps with hay fever, spinach is high in iron, and climate change is fueling extreme weather.

As the noble lie of climate fueled extreme weather has taken hold as conventional wisdom, few have been willing to offer correctives — Though there are important exceptions out in plain sight, like the IPCC Working Group 1 and the NOAA GFDL Hurricanes and Global Warming page.

Actively challenging conventional wisdom has professional and social costs. For instance, those who suggested that Covid-19 may have had a research-related origin were labeled conspiracy theorists and racists, those who suggested that President Biden was too old to serve another term were called Trump enablers, and those who accurately represent the science of climate and extreme weather are tarred as climate deniers and worse.

A few years ago I wrote an op-ed for a U.S. national newspaper and included a line about how hurricane landfalls had not increased in the U.S. in frequency or in their intensity since at least 1900. The editor removed the sentence and told me that while the statement was correct, most readers wouldn’t believe it and that would compromise the whole piece.

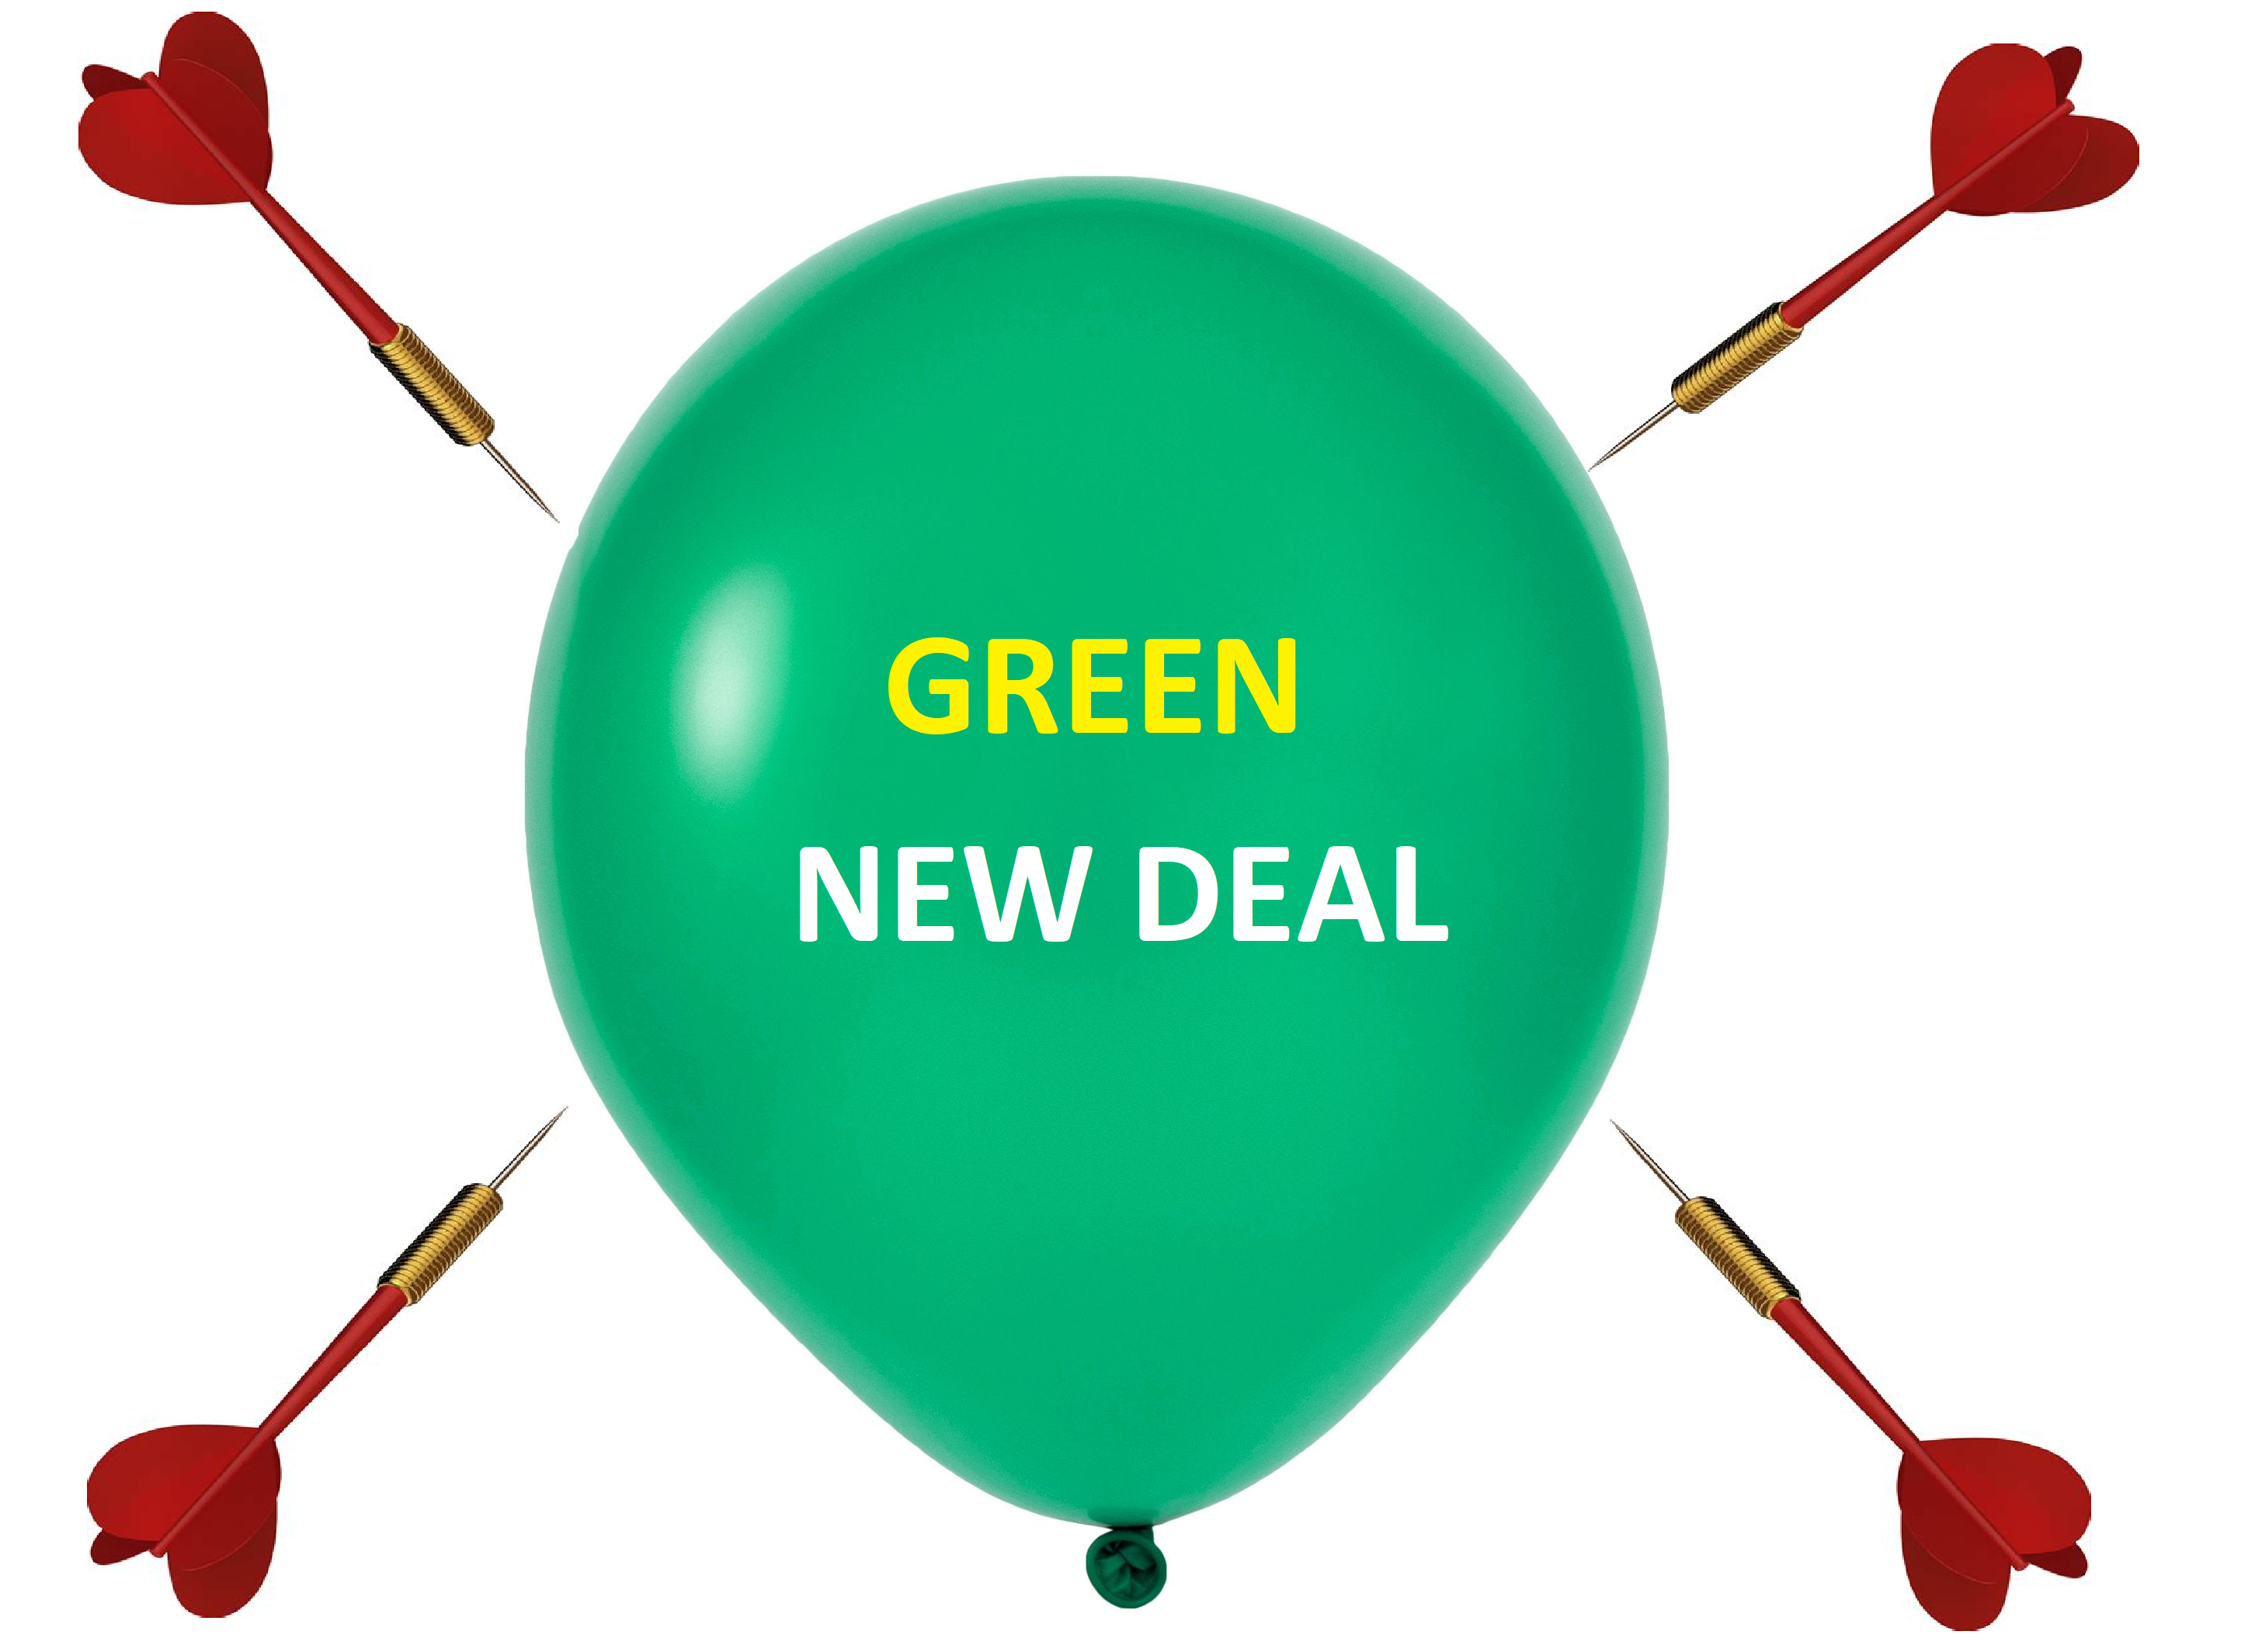
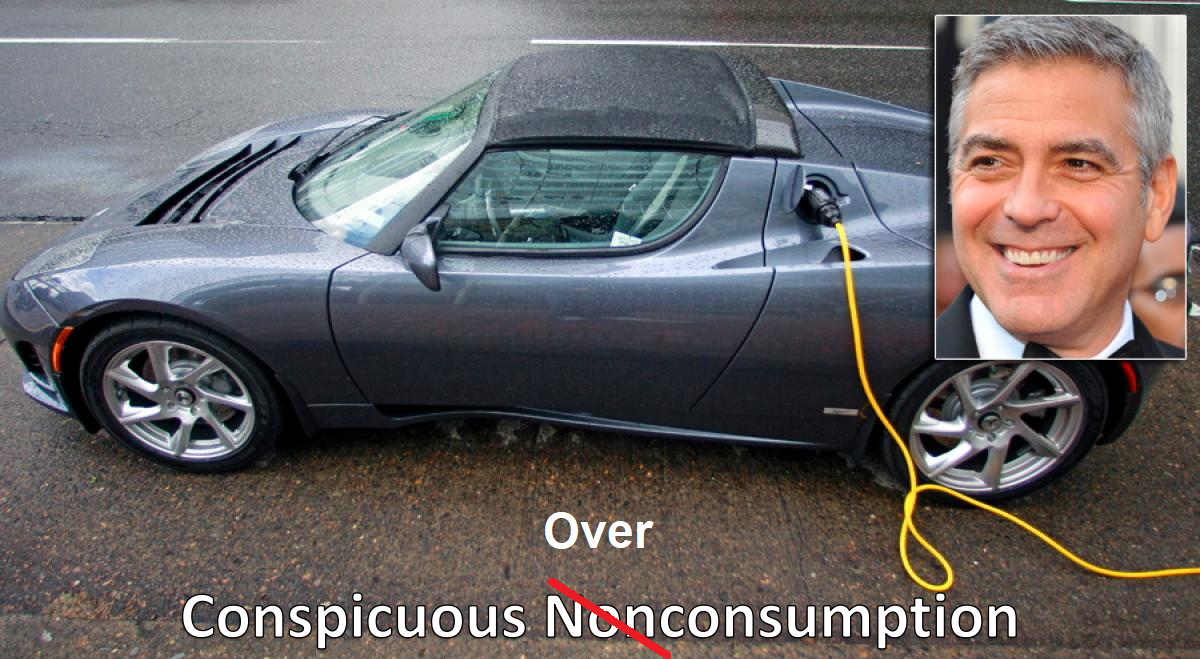
When noble lies become conventional wisdom,
they become harder to correct.

Luxury Beliefs

Yascha Mounk offers a useful definition:

Luxury beliefs are ideas professed by people who would be much less likely to hold them if they were not insulated from, and had therefore failed seriously to consider, their negative effects.

After all, what is the real harm if people believe in climate fueled extreme weather? If people believe that the extreme weather outside their window or on their feeds make aggressive climate policies more compelling, then that’s a good thing, right?

Surely there can only be positive outcomes that result from promoting misunderstandings of climate and extreme weather at odds with evidence and scientific assessments?

Well, no.

Last year I attended a forum at Lloyd’s of London — the event was held under the Chatham House rule, and in the event, later reported by the Financial Times, the company made a surprising admission contrary to the conventional wisdom (emphasis added):

Lloyd’s of London has warned insurers that the full impact of climate change has yet to translate into claims data despite annual natural catastrophe losses borne by the sector topping $100bn.

Insurance prices are surging as companies look to repair their margins after years of significant losses from severe weather to insured properties, exacerbated by inflation in rebuild costs. A warming planet has been identified by insurance experts and campaigners alike as a key factor.

But at a private event last month, one executive at the corporation that oversees the market told underwriters that it has not yet seen clear evidence that a warming climate is a major driver in claims costs.

It turns out that misunderstandings of the science of climate and extreme weather actually lead to unnecessary costs for people whose jobs involve making decisions about climate and extreme weather. Those unnecessary costs often trickle down to ordinary people. Kudos to Lloyd’s for calling things straight, even if only in a private forum — That is of course their professional responsibility.

Conclusion

In a classic paper in 2012, the late Steve Rayner explained that some forms of social ignorance are created and maintained on purpose:

To make sense of the complexity of the world so that they can act, individuals and institutions need to develop simplified, self-consistent versions of that world. The process of doing so means that much of what is known about the world needs to be excluded from those versions, and in particular that knowledge which is in tension or outright contradiction with those versions must be expunged. This is ‘uncomfortable knowledge’.

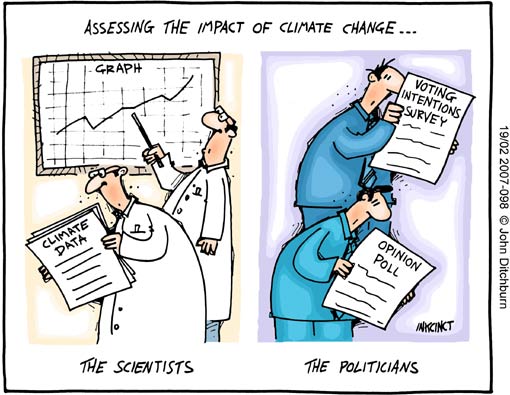
Climate fueled extreme weather is perhaps the canonical example
of dysfunctional socially constructed ignorance.  It may be
uncorrectable — a falsehood that persists permanently.

Here at THB, I am an optimist that science and policy are self-correcting, even if that takes a while. That means that the series on climate fueled extreme weather will keep going — Have a great weekend!


Power Density Physics Trump Energy Politics

A plethora of insane energy policy proposals are touted by clueless politicians, including the apparent Democrat candidate for US President.  So all talking heads need reminding of some basics of immutable energy physics.  This post is in service of restoring understanding of fundamentals that cannot be waved away.

The Key to Energy IQ

This brief video provides a key concept in order to think rationally about calls to change society’s energy platform.  Below is a transcript from the closed captions along with some of the video images and others added.

We know what the future of American energy will look like. Solar panels, drawing limitless energy from the sun. Wind turbines harnessing the bounty of nature to power our homes and businesses.  A nation effortlessly meeting all of its energy needs with minimal impact on the environment. We have the motivation, we have the technology. There’s only one problem: the physics.

The history of America is, in many ways, the history of energy. The steam power that revolutionized travel and the shipping of goods. The coal that fueled the railroads and the industrial revolution. The petroleum that helped birth the age of the automobile. And now, if we only have the will, a new era of renewable energy.

Except … it’s a little more complicated than that. It’s not really a matter of will, at least not primarily. There are powerful scientific and economic constraints on where we get our power from. An energy source has to be reliable; you have to know that the lights will go on when you flip the switch. An energy source needs to be affordable–because when energy is expensive…everything else gets more expensive too. And, if you want something to be society’s dominant energy source, it needs to be scalable, able to provide enough power for a whole nation.

Those are all incredibly important considerations, which is one of the reasons it’s so weird that one of the most important concepts we have for judging them … is a thing that most people have never heard of. Ladies and gentlemen, welcome to the exciting world of…power density.

Look, no one said scientists were gonna be great at branding. Put simply, power density is just how much stuff it takes to get your energy; how much land or other physical resources. And we measure it by how many watts you can get per square meter, or liter, or kilogram – which, if you’re like us…probably means nothing to you.

So let’s put this in tangible terms. Just about the worst energy source America has by the standards of power density are biofuels, things like corn-based ethanol. Biofuels only provide less than 3% of America’s energy needs–and yet, because of the amount of corn that has to be grown to produce it … they require more land than every other energy source in the country combined. Lots of resources going in, not much energy coming out–which means they’re never going to be able to be a serious fuel source.

Now, that’s an extreme example, but once you start to see the world in these terms, you start to realize why our choice of energy sources isn’t arbitrary. Coal, for example, is still America’s second largest source of electricity, despite the fact that it’s the dirtiest and most carbon-intensive way to produce it. Why do we still use so much of it? Well, because it’s significantly more affordable…in part because it’s way less resource-intensive.

An energy source like offshore wind, for example, is so dependent on materials like copper and zinc that it would require six times as many mineral resources to produce the same amount of power as coal. And by the way, getting all those minerals out of the ground…itself requires lots and lots of energy.

Now, the good news is that America has actually been cutting way down on its use of coal in recent years, thanks largely to technological breakthroughs that brought us cheap natural gas as a replacement. And because natural gas emits way less carbon than coal, that reduced our carbon emissions from electricity generation by more than 30%.

In fact, the government reports that switching over to natural gas did more than twice as much to cut carbon emissions as renewables did in recent years. Why did natural gas progress so much faster than renewables? It wasn’t an accident.

Energy is a little like money: You’ve gotta spend it to make it. To get usable natural gas, for example, you’ve first gotta drill a well, process and transport the gas, build a power plant, and generate the electricity. But the question is how much energy are you getting back for your investment? With natural gas, you get about 30 times as much power out of the system as you put into creating it.  By contrast, with something like solar power, you only get about 3 1/2 times as much power back.

Replacing the now closed Indian Point nuclear power plant would require covering all of Albany County NY with wind mills.

Hard to fuel an entire country that way. And everywhere you look, you see similarly eye-popping numbers. To replace the energy produced by just one oil well in the Permian Basin of Texas–and there are thousands of those–you’d need to build 10 windmills, each about 330 feet high. To meet just 10% of the country’s electricity needs, you’d have to build a wind farm the size of the state of New Hampshire. To get the same amount of power produced by one typical nuclear reactor, you’d need over three million solar panels, none of which means, by the way, that we shouldn’t be using renewables as a part of our energy future.

But it does mean that the dream of using only renewables is going to remain a dream,
at least given the constraints of current technology. We simply don’t know how
to do it while still providing the amount of energy that everyday life requires.

No energy source is ever going to painlessly solve all our problems. It’s always a compromise – which is why it’s so important for us to focus on the best outcomes that are achievable, because otherwise, New Hampshire’s gonna look like this.

Addendum from Michael J. Kelly

Energy return on investment (EROI)

The debate over decarbonization has focussed on technical feasibility and economics. There is one emerging measure that comes closely back to the engineering and the thermodynamics of energy production. The energy return on (energy) investment is a measure of the useful energy produced by a particular power plant divided by the energy needed to build, operate, maintain, and decommission the plant. This is a concept that owes its origin to animal ecology: a cheetah must get more energy from consuming his prey than expended on catching it, otherwise it will die. If the animal is to breed and nurture the next generation then the ratio of energy obtained from energy expended has to be higher, depending on the details of energy expenditure on these other activities. Weißbach et al. have analysed the EROI for a number of forms of energy production and their principal conclusion is that nuclear, hydro-, and gas- and coal-fired power stations have an EROI that is much greater than wind, solar photovoltaic (PV), concentrated solar power in a desert or cultivated biomass: see Fig. 2.

In human terms, with an EROI of 1, we can mine fuel and look at it—we have no energy left over. To get a society that can feed itself and provide a basic educational system we need an EROI of our base-load fuel to be in excess of 5, and for a society with international travel and high culture we need EROI greater than 10. The new renewable energies do not reach this last level when the extra energy costs of overcoming intermittency are added in. In energy terms the current generation of renewable energy technologies alone will not enable a civilized modern society to continue!

On Energy Transitions

Postscript

Fantasies of Clever Climate Policies

Chris Kenny writes at The Australian Facts at a premium in blustery climate debate. Excerpts in italics from text provided by John Ray at his blog, Greenie Watch.  My bolds and added images.

Collective Idiocy From Intellectual Vanity

We think we are so clever. The conceit of contemporary humankind is often unbearable.  Yet this modern self-regard has generated a collective idiocy, an inane confusion between feelings and facts, and an inability to distinguish between noble aims and hard reality.

This preference for virtue signalling over practical action can be explained only by intellectual vanity, a smugness that over-estimates humankind’s ability to shape the world it inhabits.

As a result we have a tendency to believe we are masters of the universe, that we can control the climate and regulate natural disasters. Too lazy or spoiled to weigh facts and think things through, we are more susceptible than ever to mass delusion.

We have seen this tendency play out in deeply worrying ways, such as the irrational belief in the communal benefits of Covid vaccination despite the distinct lack of scientific evidence. Too many people just wanted to believe the vaccine had this thing beaten.

Still, there is no area of public debate where rational thought is more readily cast aside than in the climate and energy debate. This is where alarmists demand that people “follow the science” while they deploy rhetoric, scare campaigns and policies that turn reality and science on their heads.

This nonsense is so widespread and amplified by so many authoritative figures that we have become inured to it. Teachers and children break from school to draw attention to what the UN calls a “climate emergency” as the world lives through its most populous and prosperous period in history, when people are shielded from the ill-effects of weather events better than they ever have been previously.

Politicians tell us in the same breath that producing clean energy is the most urgent and important task for the planet and reject nuclear energy, the only reliable form of emissions-free energy. The activists argue that reducing emissions is so imperative it is worth lowering living standards, alienating farmland, scarring forests and destroying industries, but it is not worth the challenge of boiling water to create energy-generating steam by using the tried and tested technology of nuclear fission.

Our acceptance of idiocy, unchecked and unchallenged, struck me in one interview this week given by teal MP Zali Steggall. In many ways it was an unexceptional interview; there are politicians and activists saying this sort of thing every day somewhere, usually unchallenged.

Steggall was preoccupied with Australia’s emissions reduction targets. “If we are going to be aligned to a science-based target and keep temperatures as close to 1.5 degrees as we can, we must have a minimum reduction of 75 per cent by 2035 as an interim target,” she said.

Steggall then patronised her audience by comparing meeting emissions targets to paying down a mortgage. The claim about controlling global temperatures is hard to take seriously, but to be fair it is merely aping the lines of the UN, which argues the increase in global average temperatures can be held to 1.5 degrees with emissions reductions of that size – globally.

We could talk all day about the imprecise nature of these calculations, the contested scientific debate about the role of other natural variabilities in climate, and the presumption that humankind, through policy imposed by a supranational authority, can control global climate as if with a thermostat. The simplistic relaying of this agenda as central to Australian policy decisions was not the worst aspect of Steggall’s presentation.

“The Coalition has no policy, so let’s be really clear, they are taking Australia out of the Paris Agreement if they fail to nominate an improvement with a 2035 target,” Steggall lectured, disingenuously.

This was Steggall promulgating the central lie of the national climate debatethat Australia’s emissions reduction policies can alter the climate. It is a fallacy embraced and advocated by Labor, the Greens and the teals, and which the Coalition is loath to challenge for fear of being tagged into a “climate denialism” argument.

It is arrant nonsense to suggest our policies can have any discernible effect on the climate or “climate risk”. Any politician suggesting so, directly or by implication, is part of a contemporary, fake-news-driven dumbing down of the public square, and injecting an urgency into our policy considerations that is hurting citizens already with high electricity prices, diminished reliability and a damaged economy.

Steggall went on to claim we were feeling the consequences of global warming already. “And for people wondering ‘How does that affect me?’, just look at your insurance premiums, our insurance premiums around Australia are going through the roof,” she extrapolated, claiming insurance costs were keeping people out of home ownership. “This is not a problem for the future,” Steggall stressed, “it is problem for now.”

It is a problem all right – it is unmitigated garbage masquerading as a policy debate. Taking it to its logical conclusion, Steggall claims if Australia reduced its emissions further we would lower the risk of natural disasters, leading to lower insurance premiums and improved housing affordability – it is surprising that world peace did not get a mention.

Mind you, these activists do like to talk about global warming as a security issue. They will say anything that heightens fears, escalates the problem and supports their push for more radical deindustrialisation.

Our national contribution to global emissions
is now just over 1 per cent and shrinking.

Australia’s annual emissions total less than 400 megatonnes while China’s are rising by more than that total each year and are now at 10,700Mt or about 30 times Australia’s. While our emissions reduce, global emissions are increasing. We could shut down our country, eliminating our emissions completely, and China’s increase would replace ours in less than a year.

So, whatever we are doing, it is not changing and cannot change the global climate. Our national chief scientist, Alan Finkel, clearly admitted this point in 2018, even though he was embarrassed by its implications in the political debate. Yet the pretence continues.

And before critics suggest I am arguing for inaction, I am not. But clearly, the logical and sensible baseline for our policy consideration should be a recognition that our national actions cannot change the weather. Therefore we should carefully consider adaptation to measured and verified climate change, while we involve ourselves as a responsible nation in global negotiations and action.

Obviously, we should not be leading that action but acting cautiously to protect our own interests and prosperity.

It is madness for us to undermine our cheap energy advantage to embark on a renewables-plus-storage experiment that no other country has dared to even try, when we know it cannot shift the global climate one iota. It is all pain for no gain.

Yet that is what this nation has done. So my question today is what has happened to our media, academia, political class and wider population so that it allows this debate and policy response to occur in a manner that is so divorced from reality?

Are we so complacent and overindulged that we accept post-rational debate to address our post-material concerns? Even when it is delivering material hardship to so many Australians and jeopardising our long-term economic security?

Should public debate accept absurd baseline propositions such as the idea that our energy transition sacrifice will improve the weather and reduce natural disasters, simply because they are being argued by major political groupings or the UN? Or should we not try to impose a dose of reality and stick to the facts?

This feebleness of our public debate has telling ramifications – there is no way this country could have embarked on the risky, expensive and doomed renewables-plus-storage experiment if policies and prognostications had been subject to proper scrutiny and debate.

Our media is now so polarised that the climate activists of Labor, the Greens and the teals are able to ensure their nonsensical advocacy is never challenged, and the green-left media, led by the publicly funded ABC, leads the charge in spreading misinformation.

Clearly, we are not as clever as we think. Our children need us to wise up.

Nine July Days Break Wind Power Bubble

Parker Gallant reports at his blog  Nine July Days Clearly Demonstrate Industrial Wind Turbines Intermittent Uselessness.  Excerpts in italics with my bolds and added image. H/T John Ray

The chart below uses IESO data for nine (9) July days and clearly demonstrates the vagaries of those IWT (Industrial Wind Turbines) which on their highest generation day operated at 39.7% of their capacity and on their lowest at 2.3%!  As the chart also notes, our natural gas plants were available to ramp up or down to ensure we had a stable supply of energy but rest assured IESO would have been busy either selling or buying power from our neighbours to ensure the system didn’t crash. [Independent Electricity System Operator for Ontario, Canada]

The only good news coming out of the review was that IESO did not curtail any wind generation as demand was atypical of Ontario’s summer days with much higher demand then those winter ones.

Days Gone By:         

Back and shortly after the McGuinty led Ontario Liberal Party had directed IESO to contract IWT as a generation source; theirAnnual Planning Outlook would suggest/guess those IWT would generate an average of 15% of their capacity during our warmer months (summer) and 45% of their capacity during our colder months (winter). For the full year they would be projecting an average generation of 30% of their capacity and presumably that assumption was based on average annual Ontario winds!

The contracts for those IWT offered the owners $135/MWh so over the nine days contained in the chart below those 125,275 MWh generated revenue for the owners of $16,912,125 even though they only generated an average of 11.8% of their capacity.  They are paid despite missing the suggested target IESO used because they rank ahead of most of Ontario’s other generation capacity with the exception of nuclear power due to the “first-to-the-grid” rights contained in their contracts at the expense of us ratepayers/taxpayers!

Should one bother to do the math as to the annual costs based on the 15% summer and 45% winter IESO previously used it would mean annual generation from those IWT in the summer would be about 3.9 TWh and 11.7 TWh in the winter with an annual cost of just over $2.1 billion for serving up frequently unneeded generation which is either sold off at a loss or curtailed!

Replacing Natural Gas Plants with BESS:

Anyone who has followed the perceived solution of ridding the electricity grid of fossil fuels such as natural gas will recognize ENGO [Environmental Non-Governmental Organizations] have convinced politicians that battery energy storage systems are the solution!  Well is it, and how much would Ontario have needed over those nine charted July days? One good example is July 9th and 10th and combining the energy generated by natural gas from the chart over those two days is the place to start. To replace that generation of 221,989 MW with BESS units the math is simple as those BESS units are reputed to store four (4) times their rated capacity. Dividing the MWh generated by Ontario’s natural gas generators by four over those two days therefore would mean we would need approximately 55,500 MW of BESS to replace what those natural gas plants generated.  That 55,500 MW of BESS storage is over 27 times what IESO have already contracted for and add huge costs to electricity generation in the province driving up the costs for all ratepaying classes. The BESS 2034 MW IESO already contracted are estimated to cost ratepayers $341 million annually meaning 55,500 MW of BESS to the grid would add over $9 billion annually to our costs to hopefully avoid blackouts!

The other interesting question is how would those 55,500 MW be able to recharge to be ready for future high demand days perhaps driven by EV recharging or those heating and cooling pumps operating?  The wind would have to be blowing strong and the sun would need to be shining but, as we know, both are frequently missing so bring us blackouts seems to be the theme proposed by those ENGO and our out of touch politicians and bureaucrats!

Just one simple example as to where we seem to be headed
based on the insane push to reach that “net-zero” emissions target!

IESO Ontario Electrical Energy Output by Source in 2023

Extreme Examples of Missing IWT generation:

What the chart doesn’t contain, or highlight is how those 4,900 MW of IWT capacity are undoubtedly consuming more power than they are generating on many occasions and the IESO data for those nine days contained some clear examples but less than a dozen are highlighted here!

To wit:

  • July 5th at Hour 11 they managed to deliver only 47 MWh!
  • July 7th at Hours 8, 9, and 10 they respectively generated 17 MWh, 3 MWh and 18 MWh! 
  • July 9th at Hour 9 they delivered 52 MWh!
  • July 12th at Hours 8, 9, 10 and 11 they respectively generated 33 MWh, 13 MWh, 13 MWh and 35 MWh. 
  • July 13th at Hours 9 and 10 they managed to generate 19 MWh and 39 MWh respectively! 

Conclusion:

Why politicians and bureaucrats around the world have been gobsmacked by those peddling the reputed concept of IWT generating cheap, reliable electricity is mind-blowing as the Chart coupled with the facts, clearly shows for just nine days and only looking at Ontario!

Much like the first electric car invented in 1839, by a Scottish inventor named Robert Davidson, the first electricity generated by a wind turbine came from another Scottish inventor, Sir James Blyth who in 1887 did exactly that. Neither of those old “inventions” garnered much global acceptance until those ENGO like Michael Mann and Greta arrived on the scene pontificating about “global warming” being caused by mankind’s use of fossil fuels!

As recent events have demonstrated both EV and IWT are not the panacea to save the world from either “global warming” or “climate change” even though both have “risen from the dead” due to the “net-zero” push by ENGO.

The time has come for our politicians to wake up and recognize they are supporting more then century old technology focused to try and rid the world of CO 2 emissions.  They fail to see without CO 2 mankind will be setback to a time when we had trouble surviving!

Stop the push and stop using ratepayer and taxpayer dollars for the fiction created by those pushing the “net-zero” initiative. That initiative is actually generating more CO 2 such as the 250 tons of concrete used for just one 2 MW IWT installation!   Reality Bites!

Happer: Cloud Radiation Matters, CO2 Not So Much

Earlier this month William Happer spoke on Radiation Transfer in Clouds at the EIKE conference, and the video is above.  For those preferring to read, below is a transcript from the closed captions along with some key exhibits.  I left out the most technical section in the latter part of the presentation. Text in italics with my bolds.

William Happer: Radiation Transfer in Clouds

People have been looking at Clouds for a very long time in in a quantitive way. This is one of the first quantitative studies done about 1800. And this is John Leslie,  a Scottish physicist who built this gadget. He called it an Aethrioscope, but basically it was designed to figure out how effective the sky was in causing Frost. If you live in Scotland you worry about Frost. So it consisted of two glass bulbs with a very thin capillary attachment between them. And there was a little column of alcohol here.

The bulbs were full of air, and so if one bulb got a little bit warmer it would force the alcohol up through the capillary. If this one got colder it would suck the alcohol up. So he set this device out under the clear sky. And he described that the sensibility of the instrument is very striking. For the liquor incessantly falls and rises in the stem with every passing cloud. in fine weather the aethrioscope will seldom indicate a frigorific impression of less than 30 or more than 80 millesimal degrees. He’s talking about how high this column of alcohol would go up and down if the sky became overclouded. it may be reduced to as low as 15 refers to how much the sky cools or even five degrees when the congregated vapours hover over the hilly tracks. We don’t speak English that way anymore but I I love it.

The point was that even in 1800 Leslie and his colleagues knew very well that clouds have an enormous effect on the cooling of the earth. And of course anyone who has a garden knows that if you have a clear calm night you’re likely to get Frost and lose your crops. So this was a quantitative study of that.

Now it’s important to remember that if you go out today the atmosphere is full of two types of radiation. There’s sunlight which you can see and then there is the thermal radiation that’s generated by greenhouse gases, by clouds and by the surface of the Earth. You can’t see thermal radiation but you you can feel it if it’s intense enough by its warming effect. And these curves practically don’t overlap so we’re really dealing with two completely different types of radiation.

There’s sunlight which scatters very nicely and off of not only clouds but molecules; it’s the blue sky the Rayleigh scattering. Then there’s the thermal radiation which actually doesn’t scatter at all on molecules so greenhouse gases are very good at absorbing thermal radiation but they don’t scatter it. But clouds scatter thermal radiation and plotted here is the probability that you will find Photon of sunlight between you know log of its wavelength and the log of in this interval of the wavelength scale.

Since Leslie’s day two types of instruments have been developed to do what he did more precisely. One of them is called a pyranometer and this is designed to measure sunlight coming down onto the Earth on a day like this. So you put this instrument out there and it would read the flux of sunlight coming down. It’s designed to see sunlight coming in every direction so it doesn’t matter which angle the sun is shining; it’s uh calibrated to see them all.

Let me show you a measurement by a pyranometer. This is a actually a curve from a sales brochure of a company that will sell you one of these devices. It’s comparing two types of detectors and as you can see they’re very good you can hardly tell the difference. The point is that if you look on a clear day with no clouds you see sunlight beginning to increase at dawn it peaks at noon and it goes down to zero and there’s no sunlight at night. So half of the day over most of the Earth there’s no sunlight in the in the atmosphere.

Here’s a day with clouds, it’s just a few days later shown by days of the year going across. You can see every time a cloud goes by the intensity hitting the ground goes down. With a little clear sky it goes up, then down up and so on. On average at this particular day you get a lot less sunlight than you did on the clear day.

But you know nature is surprising. Einstein had this wonderful quote: God is subtle but he’s not malicious. He meant that nature does all of sorts of things you don’t expect, and so let me show you what happens on a partly cloudy day. Here so this is data taken near Munich. The blue curve is the measurement and the red curve is is the intensity on the ground if there were no clouds. This is a partly cloudy day and you can see there are brief periods when the sunlight is much brighter on the detector on a cloudy day than it is on the clear day. And that’s because coming through clouds you get focusing from the edges of the cloud pointing down toward your detector. That means somewhere else there’s less radiation reaching the ground. But this is rather surprising to most people. I was very surprised to learn about it but it just shows that the actual details of climate are a lot more subtle than you might think.

We knnow that visible light only happens during the daytime and stops at night. There’s a second type of important radiation which is the thermal radiation which is measured by a similar divice. You have a silicon window that passes infrared, which is below the band gap of silicon, so it passes through it as though transparent. Then there’s some interference filters here to give you further discrimination against sunlight. So sunlight practically doesn’t go through this at all, so they call it solar solar blind since it doesn’t see the Sun.

But it sees thermal radiation very clearly with a big difference between this device and the sunlight sensing device I showed you. Because actually most of the time this is radiating up not down. Out in the open air this detector normally gets colder than the body of the instrument. And so it’s carefully calibrated for you to compare the balance of down coming radiation with the upcoming radiation. Upcoming is normally greater than downcoming.

I’ll show you some measurements of the downwelling flux here; these are actually in Greenland in Thule and these are are watts per square meter on the vertical axis here. The first thing to notice is that the radiation continues day and night you can you if you look at the output of the pyrgeometer you can’t tell whether it’s day or night because the atmosphere is just as bright at night as it is during the day. However, the big difference is clouds: on a cloudy day you get a lot more downwelling radiation than you do on a clear day. Here’s a a near a full day of clear weather there’s another several days of clear weather. Then suddenly it gets cloudy. Radiation rises because the bottoms of the clouds are relatively warm at least compared to the clear sky. I think if you put the numbers In, this cloud bottom is around 5° Centigrade so it was fairly low Cloud. it was summertime in Greenland and this compares to about minus 5° for the clear sky.

So there’s a lot of data out there and there really is downwelling radiation there no no question about that you measure it routinely. And now you can do the same thing looking down from satellites so this is a picture that I downloaded a few weeks ago to get ready for this talk from Princeton and it was from Princeton at 6 PM so it was already dark in Europe. So this is a picture of the Earth from a geosynchronous satellite that’s parked over Ecuador. You are looking down on the Western Hemisphere and this is a filtered image of the Earth in Blue Light at 47 micrometers. So it’s a nice blue color not so different from the sky and it’s dark where the sun has set. There’s still a fair amount of sunlight over the United States and the further west.

Here is exactly the same time and from the same satellite the infrared radiation coming up at 10.3 which is right in the middle of the infrared window where there’s not much Greenhouse gas absorption; there’s a little bit from water vapor but very little, trivial from CO2.

As you can see, you can’t tell which side is night and which side is day. So even though the sun has set over here it is still glowing nice and bright. There’s sort of a pesky difference here because what you’re looking at here is reflected sunlight over the intertropical Convergence Zone. There are lots of high clouds that have been pushed up by the convection in the tropics and uh so this means more visible light here. You’re looking at emission of the cloud top so this is less thermal light so white here means less light, white there means more light so you have to calibrate your thinking. to

But the Striking thing about all of this: if you can see the Earth is covered with clouds, you have to look hard to find a a clear spot of the earth. Roughly half of the earth maybe is clear at any given time but most of it’s covered with clouds. So if anything governs the climate it is clouds and and so that’s one of the reasons I admire so much the work that Svensmark and Nir Shaviv have done. Because they’re focusing on the most important mechanism of the earth: it’s not Greenhouse Gases, it’s Clouds. You can see that here.

Now this is a single frequency let me show you what happens if you look down from a satellite and do look at the Spectrum. This is the spectrum of light coming up over the Sahara Desert measured from a satellite. And so here is the infrared window; there’s the 10.3 microns I mentioned in the previous slide it’s it’s a clear region. So radiation in this region can get up from the surface of the Sahara right up to outer space.

Notice that the units on these scales are very different; over the Sahara the top unit is 200, 150 over the Mediterranean and it’s only 60 over the South Pole. But at least the Mediterranean and the Sahara are roughly similar so the right side here these three curves on the right are observations from satellites and the three curves on the left are are calculations modeling that we’ve done. The point here is that you can hardly tell the difference between a model calculation and observed radiation.

So it’s really straightforward to calculate radiation transfer. If someone quotes you a number in watts per square centimeter you should take it seriously; that probably a good number. If they tell you a temperature you don’t know what to make about it. Because there’s a big step between going from watts per square centimeter to a temperature change. All the mischief in the whole climate business is going from watts per square centimeter to to Centigrade or Kelvin.

Now I will say just a few words about clear sky because that is the simplest. Then we’ll get on to clouds, the topic of this talk. This is a calculation with the same codes that I showed you in the previous slide which as you saw work very well. It’s worth spending a little time because this is the famous Planck curve that was the birth of quantum mechanics. There is Max Planck who figured out what the formula for that curve is and why it is that way. This is what the Earth would radiate at 15° Centigrade if there were no greenhouse gases. You would get this beautiful smooth curve the Planck curve. If you actually look at the Earth from the satellites you get a raggedy jaggedy black curve. We like to call that the Schwarzchild curve because Carl Schwarzchild was the person who showed how to do that calculation. Tragically he died during World War I, a Big Big loss to science.

There are two colored curves that I want to draw your attention. The green curve is is what Earth would radiate to space if you took away all the CO2 so it only differs from the black curve you know in the CO2 band here this is the bending band of CO2 which is the main greenhouse effect of CO2. There’s a little additional effect here which is the asymmetric stretch but it it doesn’t contribute very much. Then here is a red curve and that’s what happens if you double CO2.

So notice the huge asymmetry. If taking all 400 parts per million of CO2 away from the atmosphere causes this enormous change 30 watts per square meter, the difference between this green 307 and and the black 277, that’s 30 watts per square meter. But if you double CO2 you practically don’t make any change. This is the famous saturation of CO2. At the levels we have now doubling CO2, a 100% Increase of CO2 only changes the radiation to space by 3 watts per square meter. The difference between 274 for the red curve and 277 for the curve for today. So it’s a tiny amount: for 100% increase in CO2 a 1% decrease of radiation to space.

That allows you to estimate the feedback-free climate sensitivity in your head. I’ll talk you through the feedback-free climate free sensitivity. So doubling CO2 is a 1% decrease of radiation to space. If that happens then the Earth will start to warm up. But it will radiate as the fourth power of the temperature. So temperature starts to rise but if you’ve got a fourth power, the temperature only has to rise by one-quarter of a percent absolute temperature. So a 1% forcing in watts per square centimeter is a one-quarter percent of temperature in Kelvin. Since the ambient Kelvin temperature is about 300 Kelvin (actually a little less) a quarter of that is 75 Kelvin. So the feedback free equilibrium climate sensitivity is less than 1 Degree. It’s 0.75 Centigrade. It’s a number you can do in your head.

So when you hear about 3 centigrade instead of .75 C that’s a factor of four, all of which is positive feedback. So how is there really that much positive feedback? Because most feedbacks in nature are negative. The famous Le Chatelier principle which says that if you perturb a system it reacts in a way to to dampen the perturbation not increase it. There are a few positive feedback systems that were’re familiar with for example High explosives have positive feedback. So if the earth’s climate were like other positive feedback systems, all of them are highly explosive, it would have exploded a long time ago. But the climate has never done that, so the empirical observational evidence from geology is that the climate is like any other feedback system it’s probably negative Okay so I leave that thought with you and and let me stress again:

This is clear skies no clouds; if you add clouds all this does is
suppress the effects of changes of the greenhouse gas.

So now let’s talk about clouds and the theory of clouds, since we’ve already seen clouds are very important. Here is the formidable equation of transfer which has been around since Schwarzchild’s day. So some of the symbols here relate to the intensity, another represents scattering. If you have a thermal radiation on a greenhouse gas where it comes in and immediately is absorbed, there’s no scattering at all. If you hit a cloud particle it will scatter this way or that way, or some maybe even backwards.

So all of that’s described by this integral so you’ve got incoming light at One Direction and you’ve got outgoing light at a second Direction. And then at the same time you’ve got thermal radiation so the warm particles of the cloud are are emitting radiation creating photons which are coming out and and increasing the Earth glow the and this is represented by two parameters. Even a single cloud particle has an albedo, this is is the fraction of radiation that hits the cloud that is scattered as opposed to absorbed and being converted to heat. It’s a very important parameter for visible light and white clouds, typically 99% of the encounters are scattered. But for thermal radiation it’s much less. So water scatters thermal radiation only half as efficiently as shorter wavelengths.

The big problem is that in spite of all the billions of dollars that we have spent, these things which should be known and and would have been known if there hadn’t been this crazy fixation on carbon dioxide and greenhouse gases. And so we’ve neglected working on these areas that are really important as opposed to the trivial effects of greenhouse gases. Attenuation in a cloud is both scattering and absorption. Of course you have to solve these equations for every different frequency of the light because especially for molecules, there’s a strong frequency dependence.

In summary,  let me show you this photo which was taken by Harrison Schmitt who was a friend of mine on one of the first moonshots. It was taken in December and looking at this you can see that they were south of Madagascar when the photograph was taken. You can see it was Winter because here the Intertropical Convergence Zone is quite a bit south of the Equator; it’s moved Way South of India and Saudi Arabia. By good luck they had the sun behind them so they had the whole earth Irradiated.

There’s a lot of information there and and again let me draw your attention to how much of the Earth is covered with clouds. So only very small parts of the Earth can actually be directly affected by greenhouse gases, of the order of half. The takeaway message is that clouds and water vapor are much more important than greenhouse gases for earth’s climate. The second point is the reason they’re much more important: doubling CO2 as I indicated in the middle of the talk only causes a 1% difference of radiation to space. It is a very tiny effect because of saturation. You know people like to say that’s not so, but you can’t really argue that one, even the IPCC gets the same numbers that we do.

And you also know that covering half of the sky with clouds will decrease solar heating by 50%. So for clouds it’s one to one, for greenhouse gases it’s a 100 to one. If you really want to affect the climate, you want to do something to the clouds. You will have a very hard time making any difference with Net Zero with CO2 if you are alarmed about the warmings that have happened.

So one would hope that with all the money that we’ve spent trying to turn CO2 into a demon that some good science has come out of it. Fom my point of view this is a small part of it, this scattering theory that I think will be here a long time after the craze over greenhouse gases has gone away. I hope there will be other things too. You can point to the better instrumentation that we’ve got, satellite instrumentation as well as ground instrumentation. So that’s been a good investment of money. But the money we’ve spent on supercomputers and modeling has been completely wasted in my view.


Tropics, SH Lead Oceans Cooler June 2024

The best context for understanding decadal temperature changes comes from the world’s sea surface temperatures (SST), for several reasons:

  • The ocean covers 71% of the globe and drives average temperatures;
  • SSTs have a constant water content, (unlike air temperatures), so give a better reading of heat content variations;
  • Major El Ninos have been the dominant climate feature in recent years.

HadSST is generally regarded as the best of the global SST data sets, and so the temperature story here comes from that source. Previously I used HadSST3 for these reports, but Hadley Centre has made HadSST4 the priority, and v.3 will no longer be updated.  HadSST4 is the same as v.3, except that the older data from ship water intake was re-estimated to be generally lower temperatures than shown in v.3.  The effect is that v.4 has lower average anomalies for the baseline period 1961-1990, thereby showing higher current anomalies than v.3. This analysis concerns more recent time periods and depends on very similar differentials as those from v.3 despite higher absolute anomaly values in v.4.  More on what distinguishes HadSST3 and 4 from other SST products at the end. The user guide for HadSST4 is here.

The Current Context

The chart below shows SST monthly anomalies as reported in HadSST4 starting in 2015 through June 2024.  A global cooling pattern is seen clearly in the Tropics since its peak in 2016, joined by NH and SH cycling downward since 2016.


Note that in 2015-2016 the Tropics and SH peaked in between two summer NH spikes.  That pattern repeated in 2019-2020 with a lesser Tropics peak and SH bump, but with higher NH spikes. By end of 2020, cooler SSTs in all regions took the Global anomaly well below the mean for this period.  

Then in 2022, another strong NH summer spike peaked in August, but this time both the Tropic and SH were countervailing, resulting in only slight Global warming, later receding to the mean.   Oct./Nov. temps dropped  in NH and the Tropics took the Global anomaly below the average for this period. After an uptick in December, temps in January 2023 dropped everywhere, strongest in NH, with the Global anomaly further below the mean since 2015.

Then came El Nino as shown by the upward spike in the Tropics since January 2023, the anomaly nearly tripling from 0.38C to 1.09C.  In September 2023, all regions rose, especially NH up from 0.70C to 1.41C, pulling up the global anomaly to a new high for this period. By December, NH cooled to 1.1C and the Global anomaly down to 0.94C from its peak of 1.10C, despite slight warming in SH and Tropics.

In January 2024 both Tropics and SH rose, resulting in Global Anomaly going higher. Since then Tropics have cooled from a  peak of 1.29C down to 0.84C.  SH also dropped down from 0.89C to 0.65C. NH lost ~0.4C as of March 2024, but has risen 0.2C over the last 3 months Despite that upward NH bump, the Global SST anomaly cooled further.  The next months will reveal the strength of 2024 NH warming spike, which could resemble summer 2020, or could rise to the 2023 level.

Comment:

The climatists have seized on this unusual warming as proof their Zero Carbon agenda is needed, without addressing how impossible it would be for CO2 warming the air to raise ocean temperatures.  It is the ocean that warms the air, not the other way around.  Recently Steven Koonin had this to say about the phonomenon confirmed in the graph above:

El Nino is a phenomenon in the climate system that happens once every four or five years.  Heat builds up in the equatorial Pacific to the west of Indonesia and so on.  Then when enough of it builds up it surges across the Pacific and changes the currents and the winds.  As it surges toward South America it was discovered and named in the 19th century  It is well understood at this point that the phenomenon has nothing to do with CO2.

Now people talk about changes in that phenomena as a result of CO2 but it’s there in the climate system already and when it happens it influences weather all over the world.   We feel it when it gets rainier in Southern California for example.  So for the last 3 years we have been in the opposite of an El Nino, a La Nina, part of the reason people think the West Coast has been in drought.

It has now shifted in the last months to an El Nino condition that warms the globe and is thought to contribute to this Spike we have seen. But there are other contributions as well.  One of the most surprising ones is that back in January of 2022 an enormous underwater volcano went off in Tonga and it put up a lot of water vapor into the upper atmosphere. It increased the upper atmosphere of water vapor by about 10 percent, and that’s a warming effect, and it may be that is contributing to why the spike is so high.

A longer view of SSTs

To enlarge, open image in new tab.

The graph above is noisy, but the density is needed to see the seasonal patterns in the oceanic fluctuations.  Previous posts focused on the rise and fall of the last El Nino starting in 2015.  This post adds a longer view, encompassing the significant 1998 El Nino and since.  The color schemes are retained for Global, Tropics, NH and SH anomalies.  Despite the longer time frame, I have kept the monthly data (rather than yearly averages) because of interesting shifts between January and July. 1995 is a reasonable (ENSO neutral) starting point prior to the first El Nino. 

The sharp Tropical rise peaking in 1998 is dominant in the record, starting Jan. ’97 to pull up SSTs uniformly before returning to the same level Jan. ’99. There were strong cool periods before and after the 1998 El Nino event. Then SSTs in all regions returned to the mean in 2001-2. 

SSTS fluctuate around the mean until 2007, when another, smaller ENSO event occurs. There is cooling 2007-8,  a lower peak warming in 2009-10, following by cooling in 2011-12.  Again SSTs are average 2013-14.

Now a different pattern appears.  The Tropics cooled sharply to Jan 11, then rise steadily for 4 years to Jan 15, at which point the most recent major El Nino takes off.  But this time in contrast to ’97-’99, the Northern Hemisphere produces peaks every summer pulling up the Global average.  In fact, these NH peaks appear every July starting in 2003, growing stronger to produce 3 massive highs in 2014, 15 and 16.  NH July 2017 was only slightly lower, and a fifth NH peak still lower in Sept. 2018.

The highest summer NH peaks came in 2019 and 2020, only this time the Tropics and SH were offsetting rather adding to the warming. (Note: these are high anomalies on top of the highest absolute temps in the NH.)  Since 2014 SH has played a moderating role, offsetting the NH warming pulses. After September 2020 temps dropped off down until February 2021.  In 2021-22 there were again summer NH spikes, but in 2022 moderated first by cooling Tropics and SH SSTs, then in October to January 2023 by deeper cooling in NH and Tropics.  

Then in 2023 the Tropics flipped from below to well above average, while NH produced a summer peak extending into September higher than any previous year.  Despite El Nino driving the Tropics January 2024 anomaly higher than 1998 and 2016 peaks, following months cooled in all regions, and the Tropics continued cooling in April, May and June along with SH dropping, suggesting that the peak likely has been reached, though NH warming is the outlier.

What to make of all this? The patterns suggest that in addition to El Ninos in the Pacific driving the Tropic SSTs, something else is going on in the NH.  The obvious culprit is the North Atlantic, since I have seen this sort of pulsing before.  After reading some papers by David Dilley, I confirmed his observation of Atlantic pulses into the Arctic every 8 to 10 years.

Contemporary AMO Observations

Through January 2023 I depended on the Kaplan AMO Index (not smoothed, not detrended) for N. Atlantic observations. But it is no longer being updated, and NOAA says they don’t know its future.  So I find that ERSSTv5 AMO dataset has current data.  It differs from Kaplan, which reported average absolute temps measured in N. Atlantic.  “ERSST5 AMO  follows Trenberth and Shea (2006) proposal to use the NA region EQ-60°N, 0°-80°W and subtract the global rise of SST 60°S-60°N to obtain a measure of the internal variability, arguing that the effect of external forcing on the North Atlantic should be similar to the effect on the other oceans.”  So the values represent sst anomaly differences between the N. Atlantic and the Global ocean.

The chart above confirms what Kaplan also showed.  As August is the hottest month for the N. Atlantic, its variability, high and low, drives the annual results for this basin.  Note also the peaks in 2010, lows after 2014, and a rise in 2021. Now in 2023 the peak was holding at 1.4C before declining.  An annual chart below is informative:

Note the difference between blue/green years, beige/brown, and purple/red years.  2010, 2021, 2022 all peaked strongly in August or September.  1998 and 2007 were mildly warm.  2016 and 2018 were matching or cooler than the global average.  2023 started out slightly warm, then rose steadily to an  extraordinary peak in July.  August to October were only slightly lower, but by December cooled by ~0.4C.

Now in 2024 the AMO anomaly started higher than any previous year, then leveled off for two months declining slightly into April.  Remarkably, May shows an upward leap putting this on a higher track than 2023, and rising slightly higher in June.  The next months will show us if that warming strengthens or levels off.

The pattern suggests the ocean may be demonstrating a stairstep pattern like that we have also seen in HadCRUT4. 

The purple line is the average anomaly 1980-1996 inclusive, value 0.18.  The orange line the average 1980-202404, value 0.39, also for the period 1997-2012. The red line is 2013-202404, value 0.66. As noted above, these rising stages are driven by the combined warming in the Tropics and NH, including both Pacific and Atlantic basins.

See Also:

2024 El Nino Collapsing

Curiosity:  Solar Coincidence?

The news about our current solar cycle 25 is that the solar activity is hitting peak numbers now and higher  than expected 1-2 years in the future.  As livescience put it:  Solar maximum could hit us harder and sooner than we thought. How dangerous will the sun’s chaotic peak be?  Some charts from spaceweatherlive look familar to these sea surface temperature charts.

Summary

The oceans are driving the warming this century.  SSTs took a step up with the 1998 El Nino and have stayed there with help from the North Atlantic, and more recently the Pacific northern “Blob.”  The ocean surfaces are releasing a lot of energy, warming the air, but eventually will have a cooling effect.  The decline after 1937 was rapid by comparison, so one wonders: How long can the oceans keep this up? And is the sun adding forcing to this process?

Space weather impacts the ionosphere in this animation. Credits: NASA/GSFC/CIL/Krystofer Kim

Footnote: Why Rely on HadSST4

HadSST is distinguished from other SST products because HadCRU (Hadley Climatic Research Unit) does not engage in SST interpolation, i.e. infilling estimated anomalies into grid cells lacking sufficient sampling in a given month. From reading the documentation and from queries to Met Office, this is their procedure.

HadSST4 imports data from gridcells containing ocean, excluding land cells. From past records, they have calculated daily and monthly average readings for each grid cell for the period 1961 to 1990. Those temperatures form the baseline from which anomalies are calculated.

In a given month, each gridcell with sufficient sampling is averaged for the month and then the baseline value for that cell and that month is subtracted, resulting in the monthly anomaly for that cell. All cells with monthly anomalies are averaged to produce global, hemispheric and tropical anomalies for the month, based on the cells in those locations. For example, Tropics averages include ocean grid cells lying between latitudes 20N and 20S.

Gridcells lacking sufficient sampling that month are left out of the averaging, and the uncertainty from such missing data is estimated. IMO that is more reasonable than inventing data to infill. And it seems that the Global Drifter Array displayed in the top image is providing more uniform coverage of the oceans than in the past.

uss-pearl-harbor-deploys-global-drifter-buoys-in-pacific-ocean

USS Pearl Harbor deploys Global Drifter Buoys in Pacific Ocean


Wind Energy Risky Business

The short video above summarizes the multiple engineering challenges involved in relying on wind and/or solar power.  Real Engineering produced The Problem with Wind Energy with excellent graphics.  For those who prefer reading, I made a transcript from the closed captions along with some key exhibits.

The Problem with Wind Energy

This is a map of the world’s wind Resources. With it we can see why the middle Plains of America has by far the highest concentrations of wind turbines in the country. More wind means more power.

However one small island off the mainland of Europe maxes out the average wind speed chart. Ireland is a wind energy Paradise. During one powerful storm wind energy powered the entire country for 3 hours, and it is not uncommon for wind to provide the majority of the country’s power on any single day. This natural resource has the potential to transform Ireland’s future.

But increasing wind energy on an energy grid comes with a lot of logistical problems which are all the more difficult for a small isolated island power grid. Mismanaged wind turbines can easily destabilize a power grid. From Power storage to grid frequency stabilization, wind energy is a difficult resource to build a stable grid upon.

To understand why, we need to take these engineering
Marvels apart and see how they work.

Hidden within the turbine cell is a Wonder of engineering. We cannot generate useful electricity with the low- speed high torque rotation of these massive turbine rotors. They rotate about 10 to 20 times a minute. The generator needs a shaft spinning around 1,800 times per minute to work effectively. So a gearbox is needed between the rotor shaft and the generator shaft.

The gearboxes are designed in stages. Planetary gears are directly attached to the blades to convert the extremely high torque into faster rotations. This stage increases rotational speed by four times. Planetary gears are used for high torque conversion because they have more contact points allowing the load to be shared between more gear teeth.

Moving deeper into the gearbox, a second stage set of helical gears multiplies the rotational speed by six. And the third stage multiplies It again by four to achieve the 1,500 to 1,800 revolutions per minute needed for the generator.

These heavy 15 tonne gearboxes have been a major source of frustration for power companies. Although they’ve been designed to have a 20-year lifespan, most don’t last more than 7 years without extensive maintenance. This is not a problem exclusive to gearboxes in wind turbines, but changing a gearbox in your car is different from having a team climb up over 50 meters to replace a multi-million dollar gearbox. Extreme gusts of wind, salty conditions and difficult to access offshore turbines increases maintenance costs even more. The maintenance cost of wind turbines can reach almost 20% of the levelized cost of energy.

In the grand scheme of things wind is still incredibly cheap. However we don’t know the precise mechanisms causing these gearbox failures. We do know that the wear shows up as these small cracks that form on the bearings,which are called White Edge cracks from the pale material that surrounds the damaged areas. This problem only gets worse when turbines get bigger and more powerful, requiring even more gear stages to convert the incredibly high torque being developed by the large diameter rotors.

One way of avoiding all of these maintenance costs is to skip the gearbox and connect the blades directly to the generator. But a different kind of generator is needed. The output frequency of the generator needs to match the grid frequency. Slower Revolutions in the generator need to be compensated for with a very large diameter generator that has many more magnetic poles meaning a single revolution of the generator passes through more alternating magnetic fields which increases the output frequency.

The largest wind turbine ever made, the Haliade X, uses a direct drive system. You can see the large diameter generator positioned directly behind the blades here. This rotor disc is 10 m wide with 200 poles and weighs 250 tons. But this comes with its own set of issues. Permanent magnets require neodium and dysprosium and China controls 90% of the supply of these rare earth metals. Unfortunately trade negotiations and embargos lead to fluctuating material costs that add extra risk and complexity to direct drive wind turbines. Ireland is testing these new wind turbines here in the Galway Wind Park. The blades were so large that this road passing underneath the Lough Atalia rail Bridge, which I use to walk home from school every day, had to be lowered to facilitate the transport of the blades from the nearby docks. It takes years to assess the benefit of new Energy Technologies like this, but as wind turbines get bigger and more expensive, direct drive systems become more attractive.

The next challenge is getting the electricity created inside these generators to match the grid frequency. When the speed of the wind constantly changes, the frequency of current created by permanent magnet generators matches the speed of the shaft. If we wanted the generator to Output the US Standard 60 HZ we could design a rotor to rotate 1,800 times per minute with four poles two North and two South. This will result in 60 cycles per second. This has to be exact; mismatched frequencies will lead to chaos on the grid, bringing the whole system down.

Managing grid frequency is a 24/7 job. In the UK, grid operators had to watch a popular TV show themselves so they could bring pumped Hydro stations online. Because a huge portion of the population went to turn on kettles to make tea during the ad breaks. This increased the load on the grid and without a matching increase in Supply, the frequency would have dropped. The grid is very sensitive to these shifts; a small 1 Herz change can bring a lot lot of Destruction.

During the 2021 freeze in Texas the grid fell Incredibly close to 59 Hertz. It was teetering on the edge of a full-scale blackout that would have lasted for months. Many people solely blamed wind turbines not running for causing this issue, but they were only partly to blame, as the natural gas stations also failed. Meanwhile the Texas grid also refuses to connect to the wider North American grid to avoid Federal Regulations. Rather oddly Texas is also an isolated power grid that has a large percentage of wind energy.

The problem with wind energy is that it is incapable of raising the grid frequency if it drops. Wind turbines are nonsynchronous and increasing the percentage of wind energy on the grid requires additional infrastructure to maintain a stable grid. To understand what nonsynchronous means, we need to dive into the engineering of wind turbines once again. The first electric wind turbines connected to the grid were designed to spin the generator shaft at exactly 1,800 RPM. The prevailing winds dictated the size and shape of the blades. The aim was to have the tips of the blades move at around seven times the speed of the prevailing wind. The tips of the blades were designed to stall if the wind speed picked up. This let them have a passive control and keep the blades rotating at a constant speed.

While this allowed the wind turbines to be connected straight to the grid, the constant rotational speed did induce large forces onto the blades. Gusts of wind would increase torque rapidly which was a recipe for fatigue failure in the drivetrain. So to extract more power, variable speed wind turbines were introduced. Instead of fixed blades that depended on a stall mechanism for control, the blades were attached to the hub with massive bearings that would allow the blades to change their angle of attack. This provided an active method of speed control, but now another problem emerged.

The rotor operated at different speeds and the frequency coming from the generator was variable. A wind turbine like this cannot be connected directly to the grid. Connecting a varying frequency generator to the grid means the power has to be passed through two inverters. The first converts the varying AC to DC using a rectifier; then the second converter takes the DC current and converts it back to AC at the correct frequency. This is done with electronic switches that rapidly turn on and off to create the oscillating wave.

We lose some power in this process but the larger issue for the grid as a whole is that this removes the benefit of the wind Turbine’s inerti. Slowing something heavy like a train is difficult because it has a lot of inertia. Power grids have inertia too. Huge rotating steam turbines connected directly to the grid are like these trains; they can’t be slowed down easily. So a grid with lots of large turbines like nuclear power and coal power turbines can handle a large load suddenly appearing and won’t experience a sudden drop in Grid frequency. This helps smooth out sudden increases in demand on the grid and gives grid operators more time to bring on new power sources.

Wind turbines of course have inertia, they are large rotating masses. But those inverters mean their masses aren’t connected directly to the grid, and so their inertia can’t help stabilize the grid. Solar panels suffer from the same problem, but they couldn’t add inertia anyway as they don’t move.

This is an issue for Renewables that can become a critical vulnerability when politicians push to increase the percentage of Renewables onto a grid without considering the impacts it can have on grid stability. Additional infrastructure is needed to manage this problem, especially as older energy sources, like coal power plants, that do provide inertia begin to shut down.

Ireland had a creative solution to this problem. In 2023 the world’s largest flywheel, a 120 ton steel shaft that rotates 3,000 times per minute, was installed in the location of a former coal power plant that already had all the infrastructure needed to connect to the grid. This flywheel takes about 20 minutes to get up to speed using grid power but it is kept rotating constantly inside a vacuum to minimize power lost to friction. When needed it can instantly provide power at the exact 50 HZ required by the grid. This flywheel provides the inertia needed to keep the grid stable, but it’s estimated that Ireland will need five more of these flywheels to reach its climate goals with increasing amounts of wind energy.

But they aren’t designed for long-term energy storage, they are purely designed for grid frequency regulation. Ireland’s next problem is more difficult to overcome. It’s an isolated island with few interconnections to other energy grids. Trading energy is one of the best ways to stabilize a grid. Larger grids are just inherently more stable. Ideally Ireland could sell wind energy to France when winds are high and buy nuclear energy when they are low. Instead right now Ireland needs to have redundancy in its grid with enough natural gas power available to ramp up when wind energy is forecasted to drop.

Currently Ireland has two interconnect connections with Great Britain but none to Mainland Europe. That is hopefully about to change with this 700 megawatt interconnection currently planned with France. With Ireland’s average demand at 4,000 megawatts, this interconnection can provide 17.5% of the country’s power needs when wind is low, or sell that wind to France when it is high. This would allow Ireland to remove some of that redundancy from its grid, while making it worthwhile to invest in more wind power as the excess then has somewhere to go.

The final piece of the puzzle is to develop long-term energy storage infrastructure. Ireland now has 1 gigawatt hour of energy storage, but this isn’t anywhere close to the amount needed. Ireland’s government has plans to develop a hydrogen fuel economy for longer term storage and energy export. In the National hydrogen plan they set up a pathway to become Europe’s main producer of green hydrogen, both for home use and for exports. With Ireland’s abundance of fresh water, thanks to our absolutely miserable weather, and our prime location along World shipping routes and being a hub for the third largest airline in the world, Ireland is very well positioned to develop a hydrogen economy.

These transport methods aren’t easily decarbonized and will need some form of renewably sourced synthetic fuel for which hydrogen will be needed, whether that’s hydrogen itself, ammonia or synthetic hydrocarbons. Synthetic hydrocarbons can be created using hydrogen and carbon dioxide captured from the air. Ireland’s winning combination of cheap renewable energy abundant fresh water and its strategically advantageous location positions it well for this future renewable energy economy. Ireland plans to begin the project by generating hydrogen with electrolysis with wind energy that has been shut off due to oversupply which is basically free energy.

As the market matures phase two of the plan is to finally begin tapping into Ireland’s vast offshore wind potential exclusively for hydrogen production with the lofty goal of 39 terrawatt hours of production by 2050 for use in energy storage fuel for transportation and for industrial heating. Ireland is legally Bound by EU law to achieve net zero emissions by 2050 but even without these lofty expectations it’s in Ireland’s best interest to develop these Technologies. Ireland has some of the most expensive electricity prices in Europe due to its Reliance on fossil fuel Imports which increased in price drastically due to the war in Ukraine. Making this transition won’t be easy and there are many challenges to overcome, but Ireland has the potential to not only become more energy secure but has the potential to develop its economy massively. Wind is a valuable resource by itself but in combination with its abundance of fresh water it could become one of the most energy rich countries in the world.

Comment

That’s a surprisingly upbeat finish boosting Irish prospects to be an energy powerhouse, considering all of the technical, logistical and economic issues highlighted along the way.  Engineers know more than anyone how complexity often results in fragility and unreliability in practice. Me thinks they are going to use up every last bit of Irish luck to pull this off. Of course the saddest part is that the whole transition is unnecessary, since more CO2 and warmth has been a boon for the planet and humankind.

See Also:

Replace Carbon Fuels with Hydrogen? Absurd, Exorbitant and Pointless

Bet Against “Energy Transition”

Mark P. Mills provides great gambling advice in his City Journal article  A Bet Against the “Energy Transition”. Excerpts in italics with my bolds and added images.

Modern civilization depends on abundant, affordable, and reliable energy.
Policies that ignore this won’t turn out well.

Starting this month, everyday citizens, not just hedge fund managers and traders, will be able to make direct bets on “big” issues ranging from basic economic indicators to the weather. Based in Greenwich, Connecticut, the global trading firm Interactive Brokers has won U.S. federal approval to run a “prediction market” platform allowing users to make bets on everything from consumer sentiment to the national debt to “atmospheric carbon dioxide.” As the Wall Street Journal reported, “Interactive Brokers said it believes that it ‘can help establish a collective view’ on ‘controversial issues.’”

Let’s hope for an opportunity to bet on whether the energy transition,
the linchpin of the ruling energy orthodoxy, will in fact happen.

The orthodox view, of course, is that it’s already underway, and the world will radically reduce, if not eliminate, the use of oil, natural gas, and coal. This narrative is firmly embedded in plans, policies, and rhetoric on both sides of the partisan divide. Conferences, studies, and consultancies are framed around the transition. Even “Big Oil,” from Exxon to Chevron, genuflects to the narrative. The only substantive debate about the energy transition concerns how fast it’s happening and what should or shouldn’t be subsidized to hasten the inevitable.

Meantime, hydrocarbons still supply over 80 percent of America’s and the world’s primary energy needs, roughly the same proportion as two decades ago. But that fact understates reality. Hydrocarbons are used, in one way or another, in everything we build and use to sustain civilization.

The goal of the energy transition is not only to eliminate the ubiquity of hydrocarbons but also to do it fast. That is the central objective of the misnamed Inflation Reduction Act (IRA). This is a government enterprise arguably unprecedented in American history, and certainly in the history of industrial programs.

A proper accounting of the IRA reveals that its real costs—$2 trillion to $3 trillion—will be far greater than the costs its advocates claim. For context, in inflation-adjusted terms, the U.S. spent about $4 trillion to prosecute World War II. This level of spending, complemented by similar pursuits in about two dozen states, makes the IRA one of the defining issues of our time. It is no exaggeration to say that the realities of energy systems—the physics, the engineering, and the economics—are now central to the future of the U.S. economy, and thus central to our policy and political debates.

Society as we know it would not exist if not for vast supplies of energy.

Energy is consumed by every invention, product, and service that makes life safe, interesting, convenient, enjoyable, and even beautiful. Energy policies are bets on whether there’s enough energy to meet people’s demands both now and in the future. But underlying that observation is a foundational truth relevant to forecasters and policymakers: throughout history, innovators have invented far more ways to consume energy than to produce it.

One of humanity’s remarkable capabilities is to invent future wants—that is, to invent new energy demands. There was no energy demand for air conditioning before its invention. We used no energy for flying until the airplane. The same is true for the car, pharmaceuticals, and computing. The global computing ecosystem now uses more energy than global aviation, and it is growing far faster. And now comes artificial intelligence: in energy terms, AI is to computers what jet engines are to aircraft.

Energy policies are thus also bets on what it is possible to build to supply those needs. Supply follows demand, but a lack of supply can also kill demand. The past and present offer ample evidence that the latent energy demands of billions of people across the globe remain underserved.

An ironclad hierarchy pertains when it comes to supplying energy. Call it a triumvirate of needs. First, you need enough energy. You can’t consume what you don’t produce. Energy abundance is key. Energy shortfalls stifle economic growth; severe shortfalls are lethal.

Second, abundant energy needs to be cheap. Affordability matters. The visible political touchstone for that reality is the price of a gallon of gasoline. More hidden is the industrial touchstone, which is the combined price of hydrocarbons and electricity. Ignoring this hidden reality has led the U.K. and Germany to sink into economically destructive deindustrialization.

Third, energy needs to be reliable at all scales and timeframes. Reliability is about meeting the energy demands of people, machines, and systems not only minute-by-minute but also over days, weeks, months, and years. The absence of energy when it is needed can crash both machines and economies.

Electical supply going from duck curve to canyon curve after adding solar and wind to the grids.

Reliability is the inverse of fragility in energy supply chains. It is the sine qua non that lets low-cost abundance be taken for granted. High reliability allows the energy issue seemingly to disappear from our daily concerns, but behind the scenes it is a Sisyphean struggle. A society must always be designing and building energy supply chains to combat the realities of relentless, often malevolent, interference from nature, accidents, or human choices.

It takes a complex and delicate dance to build systems that can simultaneously balance the triumvirate of needs: abundance, affordability, and reliability. The rules to that dance are dictated by the physics of energy and how it is manifested in the machinery we can build and afford. You could call it the physics of money.

You may have noticed that I’ve made no mention of the environment in the ironclad energy hierarchy. Abundant, affordable, and reliable energy creates the conditions for wealth that in turn make possible the time and capital required for everything beyond mere survival— from health care to entertainment to the modern luxury of environmental protection. Break the triumvirate of needs, and we know what happens. Throughout history and across the world, we see the correlation between environmental degradation and poverty.

When it comes to energy forecasts, the elephant in the room is the climate debate—the ultimate motivation for energy transition goals. But it doesn’t matter what one thinks about climate science when it comes to analyzing the physics and economics of the energy systems that we know how to build. They are entirely separate magisteria.

Thus, it was predictable that energy pundits would rediscover
the ironclad hierarchy with the rapid expansion of
the most recently invented energy-using infrastructure.

I’m referring of course to artificial intelligence. It’s a pure example of the invention of energy demands. Electric utilities around the country are now reporting epic jumps in forecasts for near-term power demand. The end of the interregnum of flat growth in electric usage comes not because of enthusiasm for electric vehicles (EVs), or because of the repatriation of semiconductor factories, though both are significant new demand vectors. It comes because the so-called virtual world of software can exist only within the physical world of energy-hungry hardware.

The cloud, whether measured in terms of the size of the network,
the capital deployed, or the energy used, is on track
to become the biggest infrastructure ever built by humanity.

Global capital spending on energy-using hardware to build the cloud and its networks now exceeds global capital spending by all electric utilities on energy-producing power plants and those networks. For context, today’s global cloud already consumes ten times more electricity than all the world’s EVs combined. Even if EV adoption expands at the rate that enthusiasts assume, the cloud will still significantly outpace that new demand for electricity, especially with the rush to buy AI hardware.

And we are still in the early days of AI adoption. To continue the AI and jet-engine analogy, the aviation industry had been booming for three decades before the 1958 introduction of the first viable commercial passenger jet, the Boeing 707. After that transformative event, flying, measured in passenger air-miles, grew more than tenfold in under a decade and kept soaring. Of course, energy use followed.

Marc Andreessen, Silicon Valley pioneer and venture capital potentate, said more than a decade ago that he expected “software would eat the world.” He meant that software would disrupt “large swathes of the economy.” He was right, but he may not have imagined that the hardware that makes the software possible would eat the grid.

And do you think AI is the last energy-using innovation that will ever emerge? The question answers itself—and that says nothing about the energy implications of billions of people who seek basic economic growth, to rise out of poverty and come to enjoy the benefits of yesterday’s inventions, from air conditioning to cars to airplanes. In timeframes that matter, new demands for energy are practically unlimited. And if we employ common sense, so, too, are new supplies.

To return to Andreessen: he has more recently issued a long, impassioned Techno-Optimist Manifesto which includes a specific exploration of energy. “We believe energy should be in an upward spiral,” he observes. “Energy is the foundational engine of our civilization. The more energy we have, the more people we can have, and the better everyone’s lives can be.” Amen.

Back to betting markets. I’d take the bets—and I hope Interactive Brokers will offer them—that in the near future we’ll see:

♦  global energy use rise, not shrink;
♦  global production and use of hydrocarbons expand, not contract;
♦  in parallel with rising alternative energy production;
♦  the abandonment of the idea of an “energy transition.”

These bets all derive from the iron law of the energy hierarchy.
Policymakers who bet against reality will face unpleasant consequences.

Footnote: The Problem Created By CO2 Hysteria

Our World in Data on The World’s Energy Problem


Intro to Climate Fallacies

First an example of how classical thought fallacies derail discussion from any search for meaning. H/T Jim Rose.

Then I took the liberty to change the discussion topic to climate change, by inserting typical claims heard in that context.

Below is a previous post taking a deeper dive into the fallacies that have plagued global warming/climate change for decades

Background Post Climatism is a Logic Fail

Two fallacies in particular ensure meaningless public discussion about climate “crisis” or “emergency.” H/T to Terry Oldberg for comments and writings prompting me to post on this topic.

One corruption is the numerous times climate claims include fallacies of Equivocation. For instance, “climate change” can mean all observed events in nature, but as defined by IPCC all are 100% caused by human activities.  Similarly, forecasts from climate models are proclaimed to be “predictions” of future disasters, but renamed “projections” in disclaimers against legal liability.  And so on.

A second error in the argument is the Fallacy of Misplaced Concreteness, AKA Reification. This involves mistaking an abstraction for something tangible and real in time and space. We often see this in both spoken and written communications. It can take several forms:

♦ Confusing a word with the thing to which it refers

♦ Confusing an image with the reality it represents

♦ Confusing an idea with something observed to be happening

Examples of Equivocation and Reification from the World of Climate Alarm

“Seeing the wildfires, floods and storms, Mother Nature is not happy with us failing to recognize the challenges facing us.” – Nancy Pelosi

Mother Nature’ is a philosophical construct and has no feelings about people.

“This was the moment when the rise of the oceans began to slow and our planet began to heal …”
– Barack Obama

The ocean and the planet do not respond to someone winning a political party nomination. Nor does a planet experience human sickness and healing.

“If something has never happened before, we are generally safe in assuming it is not going to happen in the future, but the exceptions can kill you, and climate change is one of those exceptions.” – Al Gore

The future is not knowable, and can only be a matter of speculation and opinion.

“The planet is warming because of the growing level of greenhouse gas emissions from human activity. If this trend continues, truly catastrophic consequences are likely to ensue. “– Malcolm Turnbull

Temperature is an intrinsic property of an object, so temperature of “the planet” cannot be measured. The likelihood of catastrophic consequences is unknowable. Humans are blamed as guilty by association.

“Anybody who doesn’t see the impact of climate change is really, and I would say, myopic. They don’t see the reality. It’s so evident that we are destroying Mother Earth. “– Juan Manuel Santos

“Climate change” is an abstraction anyone can fill with subjective content. Efforts to safeguard the environment are real, successful and ignored in the rush to alarm.

“Climate change, if unchecked, is an urgent threat to health, food supplies, biodiversity, and livelihoods across the globe.” – John F. Kerry

To the abstraction “Climate Change” is added abstract “threats” and abstract means of “checking Climate Change.”

Climate change is the most severe problem that we are facing today, more serious even than the threat of terrorism.” -David King

Instances of people killed and injured by terrorists are reported daily and are a matter of record, while problems from Climate Change are hypothetical


Corollary: Reality is also that which doesn’t happen, no matter how much we expect it to.

Climate Models Are Built on Fallacies


A previous post Chameleon Climate Models described the general issue of whether a model belongs on the bookshelf (theoretically useful) or whether it passes real world filters of relevance, thus qualifying as useful for policy considerations.

Following an interesting discussion on her blog, Dr. Judith Curry has written an important essay on the usefulness and limitations of climate models.

The paper was developed to respond to a request from a group of lawyers wondering how to regard claims based upon climate model outputs. The document is entitled Climate Models and is a great informative read for anyone. Some excerpts that struck me in italics with my bolds and added images.

Climate model development has followed a pathway mostly driven by scientific curiosity and computational limitations. GCMs were originally designed as a tool to help understand how the climate system works. GCMs are used by researchers to represent aspects of climate that are extremely difficult to observe, experiment with theories in a new way by enabling hitherto infeasible calculations, understand a complex system of equations that would otherwise be impenetrable, and explore the climate system to identify unexpected outcomes. As such, GCMs are an important element of climate research.

Climate models are useful tools for conducting scientific research to understand the climate system. However, the above points support the conclusion that current GCM climate models are not fit for the purpose of attributing the causes of 20th century warming or for predicting global or regional climate change on timescales of decades to centuries, with any high level of confidence. By extension, GCMs are not fit for the purpose of justifying political policies to fundamentally alter world social, economic and energy systems.

It is this application of climate model results that fuels the vociferousness
of the debate surrounding climate models.

Evolution of state-of-the-art Climate Models from the mid 70s to the mid 00s. From IPCC (2007)

Evolution of state-of-the-art Climate Models from the mid 70s to the mid 00s. From IPCC (2007)

The actual equations used in the GCM computer codes are only approximations of
the physical processes that occur in the climate system.

While some of these approximations are highly accurate, others are unavoidably crude. This is because the real processes they represent are either poorly understood or too complex to include in the model given the constraints of the computer system. Of the processes that are most important for climate change, parameterizations related to clouds and precipitation remain the most challenging, and are the greatest source of disagreement among different GCMs.

There are literally thousands of different choices made in the construction of a climate model (e.g. resolution, complexity of the submodels, parameterizations). Each different set of choices produces a different model having different sensitivities. Further, different modeling groups have different focal interests, e.g. long paleoclimate simulations, details of ocean circulations, nuances of the interactions between aerosol particles and clouds, the carbon cycle. These different interests focus their limited computational resources on a particular aspect of simulating the climate system, at the expense of others.


Overview of the structure of a state-of-the-art climate model. See Climate Models Explained by R.G. Brown

Human-caused warming depends not only on how much CO2 is added to the atmosphere, but also on how ‘sensitive’ the climate is to the increased CO2. Climate sensitivity is defined as the global surface warming that occurs when the concentration of carbon dioxide in the atmosphere doubles. If climate sensitivity is high, then we can expect substantial warming in the coming century as emissions continue to increase. If climate sensitivity is low, then future warming will be substantially lower.

In GCMs, the equilibrium climate sensitivity is an ‘emergent property’
that is not directly calibrated or tuned.

While there has been some narrowing of the range of modeled climate sensitivities over time, models still can be made to yield a wide range of sensitivities by altering model parameterizations. Model versions can be rejected or not, subject to the modelers’ own preconceptions, expectations and biases of the outcome of equilibrium climate sensitivity calculation.

Further, the discrepancy between observational and climate model-based estimates of climate sensitivity is substantial and of significant importance to policymakers. Equilibrium climate sensitivity, and the level of uncertainty in its value, is a key input into the economic models that drive cost-benefit analyses and estimates of the social cost of carbon.

Variations in climate can be caused by external forcing, such as solar variations, volcanic eruptions or changes in atmospheric composition such as an increase in CO2. Climate can also change owing to internal processes within the climate system (internal variability). The best known example of internal climate variability is El Nino/La Nina. Modes of decadal to centennial to millennial internal variability arise from the slow circulations in the oceans. As such, the ocean serves as a ‘fly wheel’ on the climate system, storing and releasing heat on long timescales and acting to stabilize the climate. As a result of the time lags and storage of heat in the ocean, the climate system is never in equilibrium.

The combination of uncertainty in the transient climate response (sensitivity) and the uncertainties in the magnitude and phasing of the major modes in natural internal variability preclude an unambiguous separation of externally forced climate variations from natural internal climate variability. If the climate sensitivity is on the low end of the range of estimates, and natural internal variability is on the strong side of the distribution of climate models, different conclusions are drawn about the relative importance of human causes to the 20th century warming.

Figure 5.1. Comparative dynamics of the World Fuel Consumption (WFC) and Global Surface Air Temperature Anomaly (ΔT), 1861-2000. The thin dashed line represents annual ΔT, the bold line—its 13-year smoothing, and the line constructed from rectangles—WFC (in millions of tons of nominal fuel) (Klyashtorin and Lyubushin, 2003). Source: Frolov et al. 2009

Anthropogenic (human-caused) climate change is a theory in which the basic mechanism is well understood, but whose potential magnitude is highly uncertain.

What does the preceding analysis imply for IPCC’s ‘extremely likely’ attribution of anthropogenically caused warming since 1950? Climate models infer that all of the warming since 1950 can be attributed to humans. However, there have been large magnitude variations in global/hemispheric climate on timescales of 30 years, which are the same duration as the late 20th century warming. The IPCC does not have convincing explanations for previous 30 year periods in the 20th century, notably the warming 1910-1945 and the grand hiatus 1945-1975. Further, there is a secular warming trend at least since 1800 (and possibly as long as 400 years) that cannot be explained by CO2, and is only partly explained by volcanic eruptions.

CO2 relation to Temperature is Inconsistent.

Summary

There is growing evidence that climate models are running too hot and that climate sensitivity to CO2 is on the lower end of the range provided by the IPCC. Nevertheless, these lower values of climate sensitivity are not accounted for in IPCC climate model projections of temperature at the end of the 21st century or in estimates of the impact on temperatures of reducing CO2 emissions.

The climate modeling community has been focused on the response of the climate to increased human caused emissions, and the policy community accepts (either explicitly or implicitly) the results of the 21st century GCM simulations as actual predictions. Hence we don’t have a good understanding of the relative climate impacts of the above (natural factors) or their potential impacts on the evolution of the 21st century climate.

Footnote:

There are a series of posts here which apply reality filters to attest climate models.  The first was Temperatures According to Climate Models where both hindcasting and forecasting were seen to be flawed.

Others in the Series are:

Sea Level Rise: Just the Facts

Data vs. Models #1: Arctic Warming

Data vs. Models #2: Droughts and Floods

Data vs. Models #3: Disasters

Data vs. Models #4: Climates Changing

Climate Medicine

Climates Don’t Start Wars, People Do

virtual-reality-1920x1200

Beware getting sucked into any model, climate or otherwise.


Another Fake Climate Case Bites the Dust

The decisive ruling against climate lawfare is reported at Washington Free Beacon Dem-Appointed Judge Tosses Major Climate Case Against Oil and Gas Producers in Blow to Environmental Activists. Excerpts in italics with my bolds and added images.

Baltimore judge deals blow to left-wing effort
to punish oil companies for global warming

A Baltimore judge tossed a landmark climate change lawsuit against more than two dozen oil and gas companies in a sizable defeat for environmental activists and Democrats that have touted the case.

Baltimore Circuit Court judge Videtta Brown—who was appointed to the bench by former Gov. Martin O’Malley (D., Md.)—ruled late Wednesday that the city cannot regulate global emissions and swatted down the city’s arguments that it merely sought climate-related damages from the defendants, not the abatement of their emissions. She further stated that the court does not accept the city’s contention that it does not seek to “directly penalize emitters.”

“Whether the complaint is characterized one way or another, the analysis and answer are the same—the Constitution’s federal structure does not allow the application of state law to claims like those presented by Baltimore,” Brown wrote in her opinion (July 11). “Global pollution-based complaints were never intended by Congress to be handled by individual states,” she added.

In a statement to the Washington Free Beacon, the Baltimore City Department of Law’s chief of affirmative litigation division Sara Gross said the city respectfully disagreed with the opinion and would seek review from a higher court.

The ruling represents the latest setback for a broader left-wing effort to penalize oil companies for allegedly spreading disinformation about the role their products play in causing climate change. Over the past several years, Democratic-led states, cities, and counties—which are home to more than 25 percent of all American citizens—have filed more than a dozen similar lawsuits.

Overall, if plaintiffs were to get their way, oil companies could be forced to pay billions of dollars in climate damages, a potentially catastrophic blow to their ability to stay in business.

Baltimore filed its original complaint in 2018, making it one of the first ever cases of its kind. After it was announced, former Democratic mayor Catherine Pugh said Baltimore was on the “front lines of climate change because melting ice caps, more frequent heat waves, extreme storms, and other climate consequences caused by fossil fuel companies are threatening our city and imposing real costs on our taxpayers.”

“These oil and gas companies knew for decades that their products would harm communities like ours, and we’re going to hold them accountable,” then-Baltimore city solicitor Andre Davis added at the time. “Baltimore’s residents, workers, and businesses shouldn’t have to pay for the damage knowingly caused by these companies.”

BP, Chevron, ExxonMobil, CITGO, ConocoPhillips, Marathon Oil, and Hess
were among the 26 entities listed as defendants in the filing.

“The Court’s well-reasoned opinion recognizes that climate policy cannot be advanced by the unconstitutional application of state law to regulate global emissions,” Theodore Boutrous, who serves as counsel for Chevron, said in a written statement to the Free Beacon. “The meritless state tort cases now being orchestrated by a small group of plaintiffs’ lawyers only detract from legitimate progress toward a lower carbon global energy system.”

The majority of the cases filed by Democratic prosecutors against the fossil fuel industry remain pending and are working their way through local courts, even as the oil industry has pushed for them to be litigated in federal courts.

In a ruling similar to the Baltimore court decision issued Wednesday, a Delaware state court in January delivered a setback to the State of Delaware’s lawsuit against oil producers filed in 2020. That court found that alleged injuries stemming from out-of-state or global greenhouse gas emissions are preempted by the federal Clean Air Act.

Delaware, Baltimore, and most other jurisdictions pursuing the climate cases across the U.S. are being represented by the San Francisco-based law firm Sher Edling. The firm was founded to specifically spearhead these novel cases, but has received criticism for its dark money funding.

In 2022 alone, the most recent year with publicly available data, Sher Edling received grants worth a total of $2.5 million from the New Venture Fund, a pass-through fund managed by dark money behemoth Arabella Advisors, according to tax filings analyzed by the Free Beacon. That funding adds to the more than $8 million the firm received in prior years from dark money groups.

Although Sher Edling’s individual donors remain unknown, past funding for the firm has flowed from the Leonardo DiCaprio Foundation, MacArthur Foundation, William and Flora Hewlett Foundation, and Rockefeller Brothers Fund.

Sher Edling didn’t respond to a request for comment.