 The images above come from AARI (Arctic and Antarctic Research Institute) St. Petersburg, Russia. Note how the location of remaining ice at late August varies greatly from year to year. The marginal seas are open water, including the Pacific basins, Canadian Bays (Hudson and Baffin), and the Atlantic basins for the most part. Note ice extent fluctuations especially in Eurasian seas (lower right) and in Can-Am seas (upper right). Notice the much greater ice extent in 2021 compared to 2018. As discussed later on, some regions retain considerable ice at the annual minimum, with differences year to year. [Note: Images prior to 2009 are in a different format. AARI Charts are (here)

The annual competition between ice and water in the Arctic ocean is approaching the maximum for water, which typically occurs mid September. After that, diminishing energy from the slowly setting sun allows oceanic cooling causing ice to regenerate. Those interested in the dynamics of Arctic sea ice can read numerous posts here. This post provides a look at end of August from 2007 to yesterday as a context for anticipating this year’s annual minimum. Note that for climate purposes the annual minimum is measured by the September monthly average ice extent, since the daily extents vary and will go briefly lowest on or about day 260. In a typical year the overall ice extent will end September slightly higher than at the beginning.
The melting season mid July to mid August shows 2024 melted at nearly the average rate, while retaining more ice extent at the end than some other recent years of note.
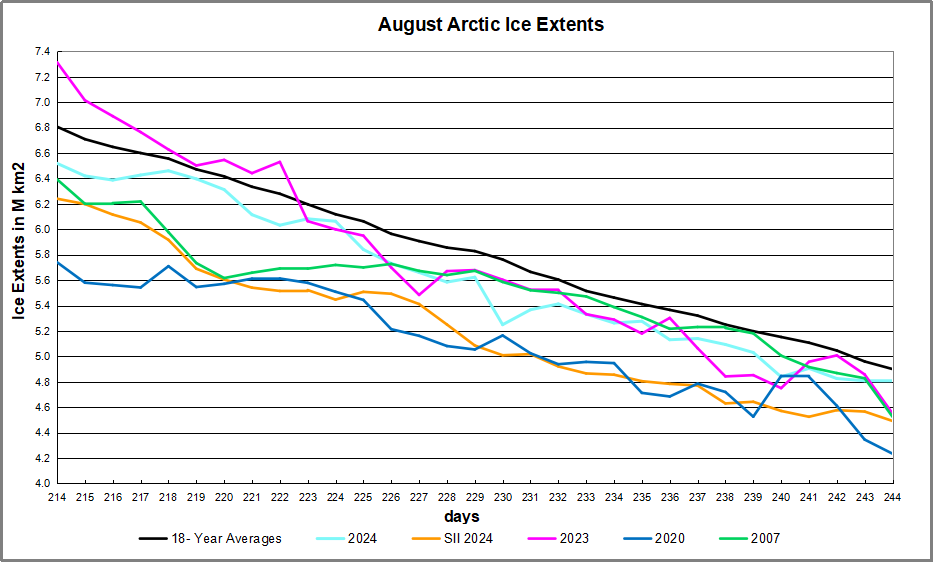
Firstly note that on average August shows ice declining 1.8M km2 down to 4.9M km2. 2024 started 288k km2 below average and on day 244 was only 98k km2 or 2% in deficit to average. The extents in Sea Ice Index in orange were considerably lower during August, meaning that SII August 2024 monthly average will be ~400k km2 lower than MASIE., nearly half a Wadham.
The table for day 244 shows how large how the ice is distributed across the various seas comprising the Arctic Ocean.
| Region | 2024244 | Day 244 ave | 2024-Ave. | 2007244 | 2024-2007 |
| (0) Northern_Hemisphere | 4802455 | 4900416 | -97962 | 4525136 | 277319 |
| (1) Beaufort_Sea | 331017 | 568911 | -237894 | 629454 | -298437 |
| (2) Chukchi_Sea | 508350 | 261504 | 246846 | 96232 | 412118 |
| (3) East_Siberian_Sea | 476831 | 342187 | 134644 | 196 | 476635 |
| (4) Laptev_Sea | 209967 | 163938 | 46029 | 245578 | -35612 |
| (5) Kara_Sea | 253 | 47999 | -47746 | 74307 | -74054 |
| (6) Barents_Sea | 0 | 15867 | -15867 | 11061 | -11061 |
| (7) Greenland_Sea | 101048 | 171695 | -70647 | 288223 | -187174 |
| (8) Baffin_Bay_Gulf_of_St._Lawrence | 51428 | 26156 | 25272 | 32804 | 18624 |
| (9) Canadian_Archipelago | 224943 | 301460 | -76516 | 234389 | -9445 |
| (10) Hudson_Bay | 3868 | 19658 | -15790 | 28401 | -24533 |
| (11) Central_Arctic | 2893622 | 2980244 | -86622 | 2883200.58 | 10421 |
The largest deficit to average is in Beaufort Sea, followed by smaller losses in Greenland Sea, CAA and Central Arctic. Hudson Bay and Barents Sea are mostly open water. The offsetting surpluses are in Chukchi, East Siberian and Laptev seas.

For context, note that the average maximum has been 15M, so on average the extent shrinks to 30% of the March high before growing back the following winter. Presently 2024 is at 32% of last March maximum. In this context, it is foolhardy to project any summer minimum forward to proclaim the end of Arctic ice.
Resources: Climate Compilation II Arctic Sea Ice

