The annual competition between ice and water in the Arctic ocean has reached the maximum for water, which typically occurs mid September. After that, diminishing energy from the slowly setting sun allows oceanic cooling causing ice to regenerate. Those interested in the dynamics of Arctic sea ice can read numerous posts here. This post provides a look at mid September from 2007 to yesterday as a context for understanding this year’s annual minimum.
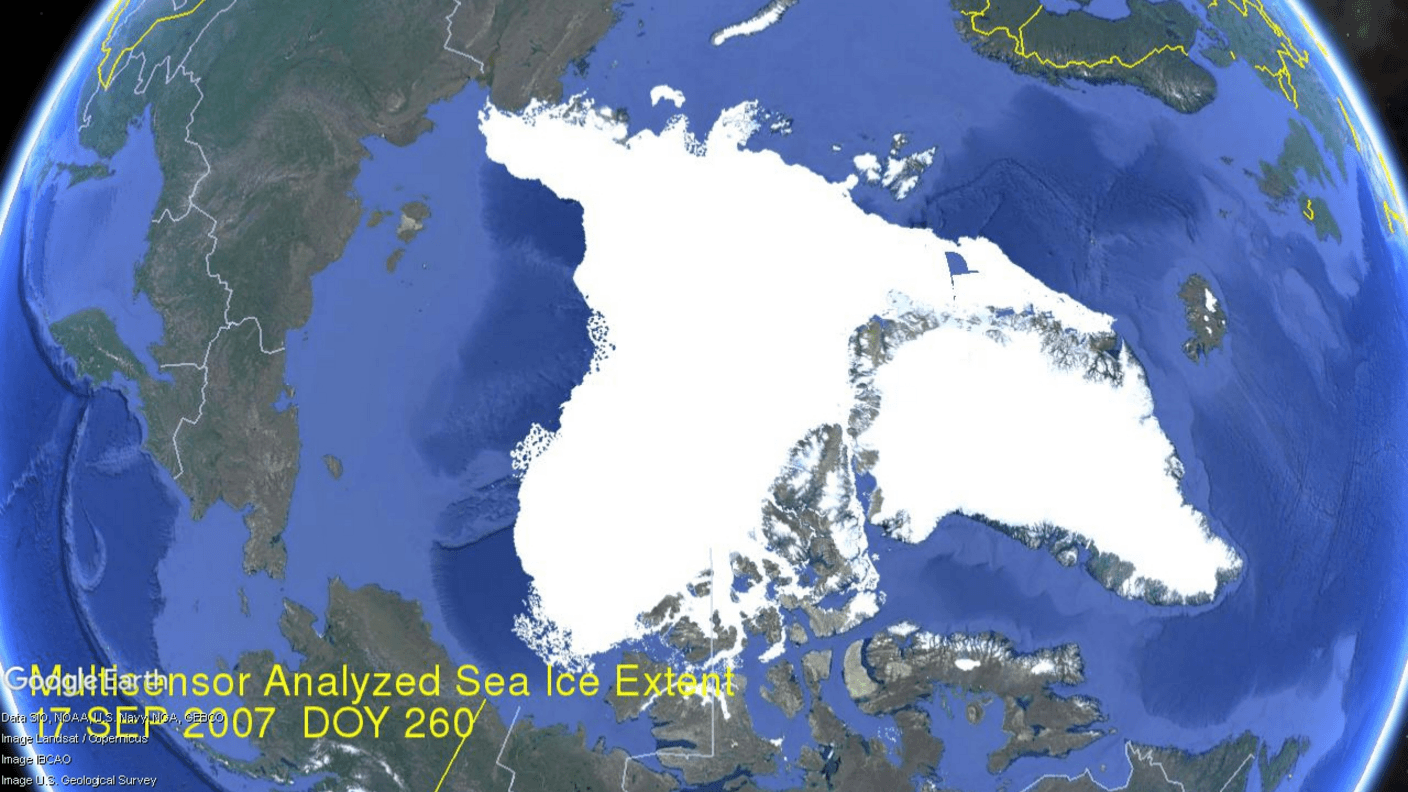
The image above shows Arctic ice extents on day 260 (lowest annual daily extent on average) from 2007 to 2024 yesterday. Obviously, the regions vary as locations for ice, discussed in more detail later on. The animation shows the ice deficits in years 2007, 2012, 2016, and 2020, as well as surplus years like 2010, 2014, 2022 and 2024.
Note that for climate purposes the annual minimum is measured by the September monthly average ice extent, since the daily extents vary and will go briefly lowest on or about day 260. In a typical year the overall ice extent will end September slightly higher than at the beginning. 2024 September ice extent averaged 4.6M over the first 16 days, and is likely to end the month with at least that amount for the entire month. For comparison, the 17 year average for Sept. 1-16 is 4.7M.
The melting season to mid September shows 2024 tracked lower than average but ended the period slightly above.
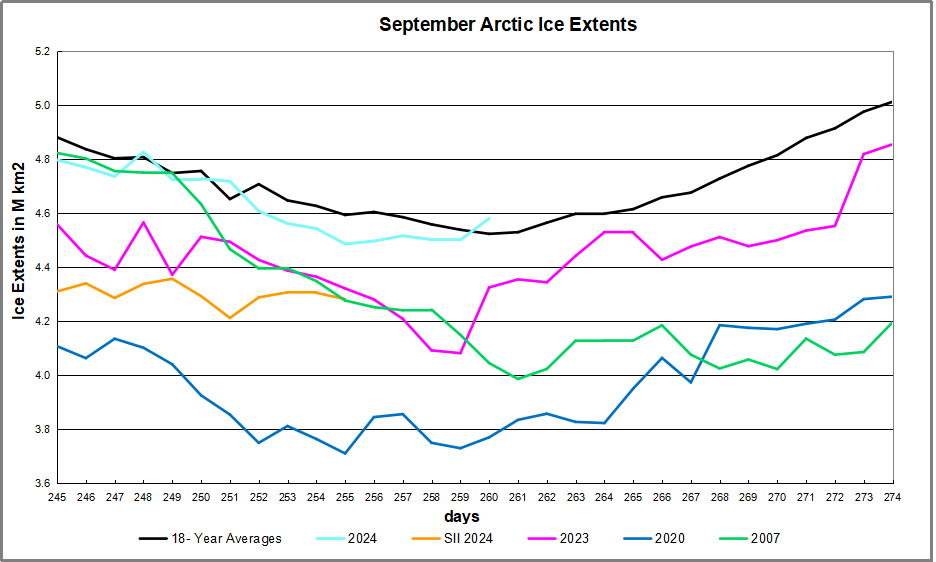
The graph above shows September daily ice extents for 2024 compared to 18 year averages, and some years of note. Day 260 has been the lowest daily ice extent on average for the last 18 years.
The black line shows on average Arctic ice extents during September decline 358k km2 down to 4.5M Km2 by day 260. The average increase from now on is 490k km2 up to 5.0M km2 end of September. 2024 tracked a little lower than the 18-year average in the second week reaching a low of 4.49M km2 on day 255, before going above average on day 260.
SII was reporting deficits as high as 0.5M km2 (half a Wadham) compared to MASIE early in September. For some reason, apparently data access issues, that dataset has not been updated for the last five days. 2023 bottomed out at 4.1M while 2007 daily minimum hit 4.0M, ended ~ 0.5M km2 in deficit to average and 535k km2 less than MASIE on day 260. 2020 ice on day 260 was ~740k km2 in deficit to average.
The main deficit to average is in CAA with a smaller loss in Chukchi, overcome by surpluses almost everywhere, especially in Central Arctic along with Laptev and Greenland seas. And as discussed below, the marginal basins have little ice left to lose.
The Bigger Picture
We are close to the annual Arctic ice extent minimum, which typically occurs on or about day 260 (mid September). Some take any year’s slightly lower minimum as proof that Arctic ice is dying, but the image above shows the Arctic heart is beating clear and strong.
Over this decade, the Arctic ice minimum has not declined, but since 2007 looks like fluctuations around a plateau. By mid-September, all the peripheral seas have turned to water, and the residual ice shows up in a few places. The table below indicates where we can expect to find ice this September. Numbers are area units of Mkm2 (millions of square kilometers).
| Day 260 | 17 year | ||||||||||
| Arctic Regions | 2007 | 2010 | 2014 | 2016 | 2018 | 2020 | 2021 | 2022 | 2023 | Average | 2024 |
| Central Arctic Sea | 2.67 | 3.16 | 2.98 | 2.92 | 2.91 | 2.50 | 2.95 | 3.08 | 2.96 | 2.92 | 2.95 |
| BCE | 0.50 | 1.08 | 1.38 | 0.52 | 1.16 | 0.65 | 1.55 | 0.99 | 0.50 | 0.88 | 1.02 |
| LKB | 0.29 | 0.24 | 0.19 | 0.28 | 0.02 | 0.00 | 0.13 | 0.20 | 0.39 | 0.18 | 0.16 |
| Greenland & CAA | 0.56 | 0.41 | 0.55 | 0.45 | 0.41 | 0.59 | 0.50 | 0.43 | 0.44 | 0.47 | 0.39 |
| B&H Bays | 0.03 | 0.03 | 0.02 | 0.03 | 0.05 | 0.02 | 0.04 | 0.02 | 0.04 | 0.04 | 0.05 |
| NH Total | 4.05 | 4.91 | 5.13 | 4.20 | 4.56 | 3.76 | 5.17 | 4.73 | 4.33 | 4.49 | 4.58 |
The table includes some early years of note along with the last 4 years compared to the 17 year average for five contiguous arctic regions. BCE (Beaufort, Chukchi and East Siberian) on the Asian side are quite variable as the largest source of ice other than the Central Arctic itself. Greenland Sea and CAA (Canadian Arctic Archipelago) together hold almost 0.5M km2 of ice at annual minimum, fairly consistently. LKB are the European seas of Laptev, Kara and Barents, a smaller source of ice, but a difference maker some years, as Laptev was in 2016 and 2023. Baffin and Hudson Bays are inconsequential as of day 260.
2024 extent of 4.58 is 1.3% over average, mainly due to surpluses in Chukchi and East Siberian seas.

For context, note that the average maximum has been 15M, so on average the extent shrinks to 30% of the March high (31% in 2022) before growing back the following winter. In this context, it is foolhardy to project any summer minimum forward to proclaim the end of Arctic ice.
Resources: Climate Compilation II Arctic Sea Ice


The Iceman cometh (yet.)
LikeLike
Just so!
LikeLike