Ocean Cooling Resumes September 2024

The best context for understanding decadal temperature changes comes from the world’s sea surface temperatures (SST), for several reasons:

  • The ocean covers 71% of the globe and drives average temperatures;
  • SSTs have a constant water content, (unlike air temperatures), so give a better reading of heat content variations;
  • Major El Ninos have been the dominant climate feature in recent years.

HadSST is generally regarded as the best of the global SST data sets, and so the temperature story here comes from that source. Previously I used HadSST3 for these reports, but Hadley Centre has made HadSST4 the priority, and v.3 will no longer be updated.  HadSST4 is the same as v.3, except that the older data from ship water intake was re-estimated to be generally lower temperatures than shown in v.3.  The effect is that v.4 has lower average anomalies for the baseline period 1961-1990, thereby showing higher current anomalies than v.3. This analysis concerns more recent time periods and depends on very similar differentials as those from v.3 despite higher absolute anomaly values in v.4.  More on what distinguishes HadSST3 and 4 from other SST products at the end. The user guide for HadSST4 is here.

The Current Context

The chart below shows SST monthly anomalies as reported in HadSST4 starting in 2015 through September 2024.  A global cooling pattern is seen clearly in the Tropics since its peak in 2016, joined by NH and SH cycling downward since 2016, followed by rising temperatures in 2023 and 2024.

Note that in 2015-2016 the Tropics and SH peaked in between two summer NH spikes.  That pattern repeated in 2019-2020 with a lesser Tropics peak and SH bump, but with higher NH spikes. By end of 2020, cooler SSTs in all regions took the Global anomaly well below the mean for this period.  A small warming was driven by NH summer peaks in 2021-22, but offset by cooling in SH and the tropics, By January 2023 the global anomaly was again below the mean.

Now in 2023-24 comes an event resembling 2015-16 with a Tropical spike and two NH spikes alongside. There was also a coinciding rise in SH, and the Global anomaly was pulled up to 1.1°C last year, ~0.3°C higher than the 2015 peak. After several months of cooling in SH and the Tropics, now NH and the Global anomaly resume starting down.

Comment:

The climatists have seized on this unusual warming as proof their Zero Carbon agenda is needed, without addressing how impossible it would be for CO2 warming the air to raise ocean temperatures.  It is the ocean that warms the air, not the other way around.  Recently Steven Koonin had this to say about the phonomenon confirmed in the graph above:

El Nino is a phenomenon in the climate system that happens once every four or five years.  Heat builds up in the equatorial Pacific to the west of Indonesia and so on.  Then when enough of it builds up it surges across the Pacific and changes the currents and the winds.  As it surges toward South America it was discovered and named in the 19th century  It iswell understood at this point that the phenomenon has nothing to do with CO2.

Now people talk about changes in that phenomena as a result of CO2 but it’s there in the climate system already and when it happens it influences weather all over the world.   We feel it when it gets rainier in Southern California for example.  So for the last 3 years we have been in the opposite of an El Nino, a La Nina, part of the reason people think the West Coast has been in drought.

It has now shifted in the last months to an El Nino condition that warms the globe and is thought to contribute to this Spike we have seen. But there are other contributions as well.  One of the most surprising ones is that back in January of 2022 an enormous underwater volcano went off in Tonga and it put up a lot of water vapor into the upper atmosphere. It increased the upper atmosphere of water vapor by about 10 percent, and that’s a warming effect, and it may be that is contributing to why the spike is so high.

A longer view of SSTs

The graph above is noisy, but the density is needed to see the seasonal patterns in the oceanic fluctuations.  Previous posts focused on the rise and fall of the last El Nino starting in 2015.  This post adds a longer view, encompassing the significant 1998 El Nino and since.  The color schemes are retained for Global, Tropics, NH and SH anomalies.  Despite the longer time frame, I have kept the monthly data (rather than yearly averages) because of interesting shifts between January and July. 1995 is a reasonable (ENSO neutral) starting point prior to the first El Nino. 

The sharp Tropical rise peaking in 1998 is dominant in the record, starting Jan. ’97 to pull up SSTs uniformly before returning to the same level Jan. ’99. There were strong cool periods before and after the 1998 El Nino event. Then SSTs in all regions returned to the mean in 2001-2. 

SSTS fluctuate around the mean until 2007, when another, smaller ENSO event occurs. There is cooling 2007-8,  a lower peak warming in 2009-10, following by cooling in 2011-12.  Again SSTs are average 2013-14.

Now a different pattern appears.  The Tropics cooled sharply to Jan 11, then rise steadily for 4 years to Jan 15, at which point the most recent major El Nino takes off.  But this time in contrast to ’97-’99, the Northern Hemisphere produces peaks every summer pulling up the Global average.  In fact, these NH peaks appear every July starting in 2003, growing stronger to produce 3 massive highs in 2014, 15 and 16.  NH July 2017 was only slightly lower, and a fifth NH peak still lower in Sept. 2018.

The highest summer NH peaks came in 2019 and 2020, only this time the Tropics and SH were offsetting rather adding to the warming. (Note: these are high anomalies on top of the highest absolute temps in the NH.)  Since 2014 SH has played a moderating role, offsetting the NH warming pulses. After September 2020 temps dropped off down until February 2021.  In 2021-22 there were again summer NH spikes, but in 2022 moderated first by cooling Tropics and SH SSTs, then in October to January 2023 by deeper cooling in NH and Tropics.  

Then in 2023 the Tropics flipped from below to well above average, while NH produced a summer peak extending into September higher than any previous year.  Despite El Nino driving the Tropics January 2024 anomaly higher than 1998 and 2016 peaks, following months cooled in all regions, and the Tropics continued cooling in April, May and June along with SH dropping.  After July and August NH warming again pulled the global anomaly higher, September resumed cooling in all regions.

What to make of all this? The patterns suggest that in addition to El Ninos in the Pacific driving the Tropic SSTs, something else is going on in the NH.  The obvious culprit is the North Atlantic, since I have seen this sort of pulsing before.  After reading some papers by David Dilley, I confirmed his observation of Atlantic pulses into the Arctic every 8 to 10 years.

Contemporary AMO Observations

Through January 2023 I depended on the Kaplan AMO Index (not smoothed, not detrended) for N. Atlantic observations. But it is no longer being updated, and NOAA says they don’t know its future.  So I find that ERSSTv5 AMO dataset has current data.  It differs from Kaplan, which reported average absolute temps measured in N. Atlantic.  “ERSST5 AMO  follows Trenberth and Shea (2006) proposal to use the NA region EQ-60°N, 0°-80°W and subtract the global rise of SST 60°S-60°N to obtain a measure of the internal variability, arguing that the effect of external forcing on the North Atlantic should be similar to the effect on the other oceans.”  So the values represent sst anomaly differences between the N. Atlantic and the Global ocean.

The chart above confirms what Kaplan also showed.  As August is the hottest month for the N. Atlantic, its variability, high and low, drives the annual results for this basin.  Note also the peaks in 2010, lows after 2014, and a rise in 2021. Then in 2023 the peak was holding at 1.4C before declining.  An annual chart below is informative:

Note the difference between blue/green years, beige/brown, and purple/red years.  2010, 2021, 2022 all peaked strongly in August or September.  1998 and 2007 were mildly warm.  2016 and 2018 were matching or cooler than the global average.  2023 started out slightly warm, then rose steadily to an  extraordinary peak in July.  August to October were only slightly lower, but by December cooled by ~0.4C.

Now in 2024 the AMO anomaly started higher than any previous year, then leveled off for two months declining slightly into April.  Remarkably, May showed an upward leap putting this on a higher track than 2023, and rising slightly higher in June.  In July, August and September 2024 the anomaly declined and is now lower than the peak reached in 2023.

The pattern suggests the ocean may be demonstrating a stairstep pattern like that we have also seen in HadCRUT4. 

The purple line is the average anomaly 1980-1996 inclusive, value 0.18.  The orange line the average 1980-202404, value 0.39, also for the period 1997-2012. The red line is 2013-202409, value 0.69. As noted above, these rising stages are driven by the combined warming in the Tropics and NH, including both Pacific and Atlantic basins.

See Also:

2024 El Nino Collapsing

Curiosity:  Solar Coincidence?

The news about our current solar cycle 25 is that the solar activity is hitting peak numbers now and higher  than expected 1-2 years in the future.  As livescience put it:  Solar maximum could hit us harder and sooner than we thought. How dangerous will the sun’s chaotic peak be?  Some charts from spaceweatherlive look familar to these sea surface temperature charts.

Summary

The oceans are driving the warming this century.  SSTs took a step up with the 1998 El Nino and have stayed there with help from the North Atlantic, and more recently the Pacific northern “Blob.”  The ocean surfaces are releasing a lot of energy, warming the air, but eventually will have a cooling effect.  The decline after 1937 was rapid by comparison, so one wonders: How long can the oceans keep this up? And is the sun adding forcing to this process?

Space weather impacts the ionosphere in this animation. Credits: NASA/GSFC/CIL/Krystofer Kim

Footnote: Why Rely on HadSST4

HadSST is distinguished from other SST products because HadCRU (Hadley Climatic Research Unit) does not engage in SST interpolation, i.e. infilling estimated anomalies into grid cells lacking sufficient sampling in a given month. From reading the documentation and from queries to Met Office, this is their procedure.

HadSST4 imports data from gridcells containing ocean, excluding land cells. From past records, they have calculated daily and monthly average readings for each grid cell for the period 1961 to 1990. Those temperatures form the baseline from which anomalies are calculated.

In a given month, each gridcell with sufficient sampling is averaged for the month and then the baseline value for that cell and that month is subtracted, resulting in the monthly anomaly for that cell. All cells with monthly anomalies are averaged to produce global, hemispheric and tropical anomalies for the month, based on the cells in those locations. For example, Tropics averages include ocean grid cells lying between latitudes 20N and 20S.

Gridcells lacking sufficient sampling that month are left out of the averaging, and the uncertainty from such missing data is estimated. IMO that is more reasonable than inventing data to infill. And it seems that the Global Drifter Array displayed in the top image is providing more uniform coverage of the oceans than in the past.

uss-pearl-harbor-deploys-global-drifter-buoys-in-pacific-ocean

USS Pearl Harbor deploys Global Drifter Buoys in Pacific Ocean


Legal Fight to Stop EPA Rule Closing Power Plants

Update on ominous overreach by Biden/Harris regime comes from Just the News  While the SCOTUS denies request to block EPA power plant rule, challengers vow to continue fight.  As explained below, EPA intends to require expensive and impractical CO2 Capture and Storage on all power plants using carbon fuels, thereby forcing shutdowns. Excerpts in italics with my bolds and added images,

Analysts say that if the rule is implemented, more than 5 million
people could experience blackouts, some lasting for 41 hours.

The Supreme Court ruled against a bid to block the EPA’s power plant rule while legal challenges make their way through the courts, but West Virginia, which is leading the coalition of states challenging the rule, vows the fight isn’t over. 

In a brief order, Justices Brett Kavanaugh and Neil Gorsuch said that the applicants “have shown a strong likelihood of success on the merits as to at least some of the challenges to the” EPA’s rule.

However, the justices explained, the stay wasn’t needed because compliance requirements wouldn’t begin until June 2025, which means the applicants wouldn’t “suffer irreparable harm” before the Court of Appeals for the D.C. Circuit decides the merits of the case. Injunctive relief, such as sought here, requires clear and convincing proof that the harm be immediate and irreparable.

The lower court is expediting the case, the justices noted, meaning it would be resolved in the court’s current term. Afterward, the case would still have time to return to the Supreme Court, if it’s warranted. 

The EPA rule, which was finalized in April, requires that coal-fired power plants be fitted with carbon capture technology controlling 90% of their carbon dioxide emissions by 2039, and new gas-fired power plants will need to do the same starting in 2035, depending on the amount of runtime they have.

Energy analysts Isaac Orr and Mitch Rolling revealed that the EPA failed to do a proper analysis of the impacts of the rule, and if implemented, over 5 million people will experience blackouts, some lasting for 41 hours. While the EPA has defended the rule and argues that carbon capture is “well proven,” its own modeling showed it expected only one coal plant and no gas plants to be fitted with the technology as far out as 2055.

Two dozen states led by West Virginia filed a lawsuit against the EPA in May, arguing that the agency exceeded its authority with the rule. Utilities and industry groups also filed legal challenges to the rule. In July, the U.S. Court of Appeals for the D.C. Circuit denied the parties’ requests to block the rules while the courts considered the challenges, and the court ruled the applicants wouldn’t succeed on the merits of their case.

In court filings, the EPA noted that the lower court ruled the applicants are unlikely to succeed in arguing the agency exceeded its authority, and it stood by the rule and its carbon capture requirements, arguing that the technology has been “adequately demonstrated.”

West Virginia Attorney General Patrick Morrisey said in a
statement on the high court’s ruling that the fight isn’t over.

“This is not the end of this case: we will continue to fight through the merits phase and prove this rule strips the states of important discretion while forcing plants to use technologies that don’t work in the real world,” Morrisey said.

In 2022, the Supreme Court had sided with West Virginia and other states in a challenge to the Obama-era “Clean Power Plan.” Morrisey said that the high court had made clear limits to what the EPA can do, and the Biden administration’s “green new deal agenda” is ignoring those limits.

“This rule is yet another attempt of unelected bureaucrats to push something the law doesn’t allow,” Morrisey said.

Indiana, Alabama, Alaska, Arkansas, Florida, Georgia, Idaho, Iowa, Kentucky, Louisiana, Mississippi, Missouri, Montana, Nebraska, New Hampshire, North Dakota, Oklahoma, South Carolina, South Dakota, Tennessee, Texas, Utah, Virginia, and Wyoming joined the application to the Supreme Court.

Harris Not Pro-Choice for Cars or Appliances

Kenin M Spivak warns us in his Real Clear Energy article For Harris Pro-Choice Does Not Include Cars and Appliances.  Excerpts in italics with my bolds and added images.

Kamala Harris wants to deprive Americans of the right to choose cars and household appliances. When she claims, as she did at a rally last week in Michigan, that “I will never tell you what kind of car you have to drive” she is guilty of two of the Democrats’ most reviled offenses, malinformation (failure to contextualize a statement) and misinformation (lying).

Combating climate by changing infrastructure, consumer goods,
and lifestyle is one of Harris’s core values.

As recently as this year, the Biden-Harris administration continued to issue regulations and battle in court for the right to reduce consumer options for automobiles and home appliances. Harris favors consumers having choices, just so long as those choices are limited to those she pre-approves.

Then Senator Harris co-sponsored the Senate version of Alexandira Ocasio-Cortez’ Green New Deal. Harris believed that mandating priorities and choices to limit emissions was so important that she advocated ending the filibuster to do so. Harris also co-sponsored the Zero Admissions Vehicles Act to require that all cars be EVs, or otherwise zero-emissions, by 2040. When she ran for president in 2019, she issued a plan to phase out new gas-powered cars even sooner – by 2035.

In April 2023, the Biden-Harris administration proposed rules that would ensure that EVs accounted for about 67 percent of all new car sales by 2032 (just eight years from now). After objections from nearly every sector and region of the country, the EPA issued final rules on March 20 of this year that require from 31 percent to 44 percent of new cars, SUVs, and pickup trucks manufactured in 2027 be EVs, with the final percentage to be based on emissions from other vehicles. The EPA rules require that by 2032, EVs account for at least 56 percent of new car sales, and at least another 13 percent be hybrids, leaving not more than 31% as gas powered.

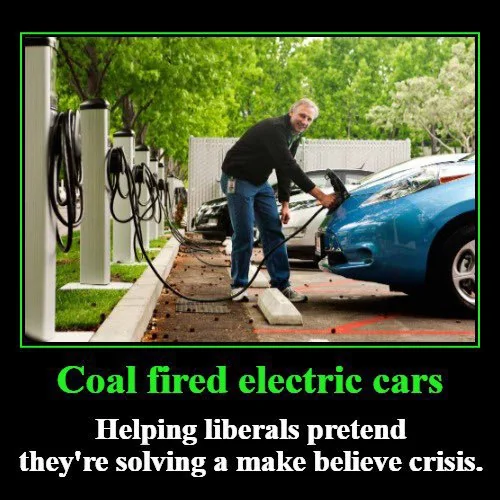
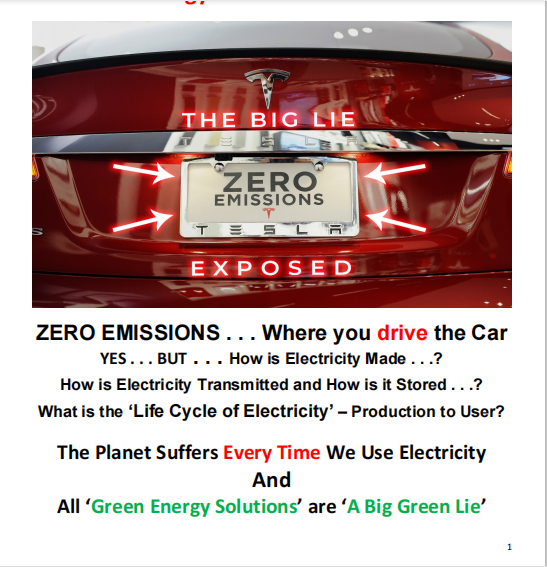
In 2023, EVs accounted for only 7.6 percent of new car sales. That is because, despite subsidies and massive pressure from government and the Left, consumers dislike EVs. EVs have limited range, particularly in the cold. They take a long time to charge, and it is difficult for those who live in apartments to do so. They are costly. EVs maynot even be particularly good for the environment once the electrical grid and generating capacity are expanded to support mandates, and disposal of lithium ion batteries is considered. It also is unlikely the U.S. could have sufficient generating capacity without brownouts, blackouts, and other conservation measures.

EV mandates imperil national security by replacing fossil fuels, in which the U.S. is the world leader, with minerals found in China. China also is the low cost manufacturer of EVs, meaning that EV mandates will send American jobs and profits to China.

Energy expert Mark P. Mills warns that “All the world’s mines, both currently operating and planned, can supply only a small fraction of the… increase in various minerals that will be needed to meet the wildly ambitious EV goals,” while the UN Trade Development Agency advises there will be considerable shortages in lithium, cobalt, and copper if EV requirements are not slowed.

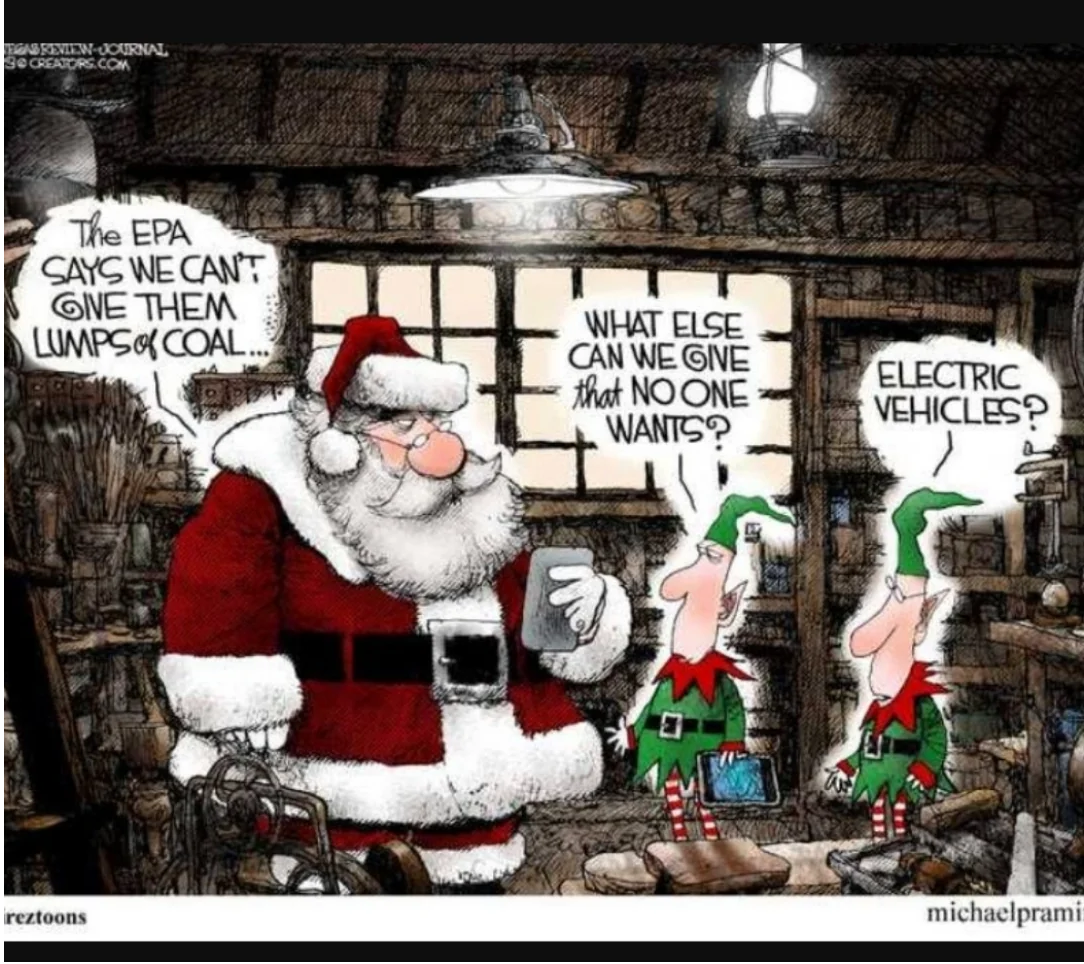
The strong disfavor in which consumers hold EVs is seen in two numbers. As Fortune observed, “no one wants to buy used EVs,” destroying resale value, and second, EVs are the least likely cars to be stolen. Numerous major automobile manufacturers are cutting EV production targets, and earlier this year Hertz announced that it was disposing of a third of its almost new EV fleet. The 2024 Deloitte Global Automotive Consumer Study found that EVs were never very popular among consumers, and familiarity is breeding contempt, with a 9% increase in the popularity of gas powered cars. A Gallup survey in April found that among Democrats who don’t yet own an EV, the percent saying they would never purchase an EV rose 10 points, compared to a year ago.

Harris not only wants to deprive Americans of the opportunity to choose gas-powered cars and most hybrids, but she also supports the Green New Deal’s goal of prohibiting sales of home appliances that do not meet draconian emissions standards. To date, the Biden-Harris administration has sought to take off the market most home dishwashersheatersair conditioners, and gas stoves. A federal appeals court struck down the Department of Energy’s action targeting dishwashers.

In May, the House passed the Hands Off Our Home Appliances Act on a bipartisan basis. That bill is intended to restrain the administration from banning home appliances that run on natural gas.

Next time Kamala Harris claims that she won’t tell you what to buy,
just keep in mind that she intends to eliminate most options,
leaving you with a Hobson’s choice of poorly performing alternatives.


Arctic Shipping Update: NSR Flash Freezing

The previous post below sounded the alarm about ice halting Arctic shipping early.  Now the two choke points are blocked nine days later. Chukchi sea (left) is blocking entrance to Bering sea.  Laptev (right) is blocking traffic into European Barents and Kara seas.

Ice-strengthened supramax Kumpula (Arc 4) on the NSR being escorted by nuclear icebreaker Vaygach. (Source: Courtesy of ESL Shipping)

The report comes from Malte Humpert at gCaptain  Early Winter Ice Halts Arctic Shipping Traffic Weeks Ahead of Schedule.  Excerpts in italics with my bolds.

The summer shipping window on Russia’s Northern Sea Route is coming to a rapid close weeks ahead of schedule. A number of vessels and convoys are rushing to complete their transits before the route shuts down in the next three weeks.

Source: Northern Sea Route Information Office

Unlike the last couple of summers when Russia’s Arctic coastal waterways were fully clear of sea ice, residual winter ice persisted in the eastern section this year. This has resulted in the early onset of ice formation especially in the Laptev, East Siberian, and Chukchi Seas.

NSRIO: Ice is still present in the eastern sector of the NSR preventing free passage of ships without ice class. The nuclear icebreaker Sibir has been operating in the East Siberian and Chukchi Seas since the end of June together with the nuclear icebreaker Vaygach, which has been in the area since mid-July. In several areas of the Chukchi and East Siberian Seas heavy ice conditions are still observed, which directly affects the admission of low ice class vessels to these areas. The western part of the NSR is mostly ice-free. Above is a map of ice conditions as of August 7, 2024.

Russia’s Northern Sea Route Administration announced that vessels with no ice class will have to vacate the waterway by October 15, around 2-3 weeks ahead of schedule. For vessels with light and medium ice classifications the navigation season will end on October 20 and October 31 respectively.

The last permitted start of convoys heading east will be October 10, leaving just one more week for vessels to begin their Arctic transit.

This year’s early shutdown comes three years after narrowly avoiding a major incident three years ago. In October 2021 Russian authorities reacted too late to begin closing down the NSR as winter sea ice drifted into the main shipping channel and trapped two dozen vessels for more than a month. A 30 centimeter or one foot thick ice layer had formed by the end of October across hundreds of miles of Arctic Ocean.
 
Several icebreakers, including the powerful nuclear vessel Yamal, rushed to the scene from Murmansk over 3,000 nautical miles away to help free the stranded vessels. Over the course of more than 6 weeks several icebreakers worked to break the vessels free and escort them to safety out of the eastern section of the Northern Sea Route. The situation did not fully resolve until the end of December when the last vessels were freed.

Vessels stuck in thick winter sea ice in November 2021 awaiting rescue. (Source: Rosatomflot)

Currently a number of container ships, oil tankers, bulk carriers
and LNG tankers are passing through the route.

In the Far East two LNG carriers and two oil tankers, including the Suezmax tanker Sai Baba, are currently passing through the waters adjacent to the Bering Strait. They are staying clear of multi-year ice around Wrangel Island which has persisted and troubled shipping all summer. A nuclear icebreaker had remained on standby for much of the summer keeping the shipping lane open.

Select container ships, crude oil tankers, and bulk and LNG carriers currently on the NSR. (Source: Shipatlas)

Further west along the route, the first-ever conventional Panamax container ship in the Arctic is about halfway through its transit. The vessel had originally intended to also conduct its return voyage via the Arctic, but will now likely have to return to Asia via the Suez Canal or South Africa route.

A massive Capesize bulk carrier without any ice class, Dodo, is also rushing to complete its eastbound voyage to Caofeidian, China.

Here’s ice activity in last week in the NSR from Chukchi Sea in the east (left side), and threatening in Laptev Sea (right).

White Guys, it’s not personal. It’s Western Civilization They Hate.

White privilege gave us Western civilization, the middle class,
and the nuclear family—you’re welcome! This book is dedicated
to the very fine people that made it all happen.

I just became aware of A.J. Rice from this American Greatness article Rice: Woke initiatives were ‘one uppercut to the face after another’ for Gen Z.  Excerpts in italics with my bolds and added images.

A J Rice said Gen Z is a generation that struggles with human connection because of the mass social justice movements they grew up with. He made the comments on a recent episode of The Greatness Conversation.

“You had one uppercut to the face after another here for Gen Z where, first, it’s the Me Too movement, males are told to take it down a notch, toxic masculinity,” Rice said on a recent episode of The Greatness Conversation. “You might be a predator, you might be a rapist. And then, and then all of a sudden, George Floyd dies. You’re now a racist. All of your history stinks.”

“And then when that’s all over, they’re going to drop on you that there are 72 genders and Gary and Tim and Bill are coming into the women’s locker room and the girl’s bathroom,” Rice said. “So, you know, if you wonder why Gen Z has a hard time being authentically human.”

Rice joined the podcast to discuss his new book, “The White Privilege Album,” the use of comedy to talk about progressive “wokeness,” and the future of what society looks like for younger generations.

Who’s A. J. Rice? More from American Spectator A.J. Rice’s White Privilege Album Is a Vaccine for the Woke Mind Virus. Excerpts in italics with my bolds and added images.

Rice exposes what actual white privilege looks like
and why you don’t have it.

You already know this, but we live in deeply stuffy, oppressive times. You can get canceled for saying the wrong thing, not saying the right thing, or even looking at someone in a way they don’t like. Don’t believe me? Go to the gym and glance for more than three seconds at that 20-something girl in the bralette and bike shorts; woe betide you if you’re not in better shape than she is.

One minute you’re on top of the world — the next minute, you’re canceled and your whole world is turned upside down. It would be no small thing to just say forget all this and say and do whatever you want without fear. A younger Mel Brooks or Woody Allen might relish taking the fight to wokeness, but few others around would.

The digital gulag awaits us all, it seems. A hunger for thus imprisoning one’s fellow man is what the woke mind virus instills in its victims.

Into this climate of fear and loathing comes a writer, an entrepreneur, a madcap thinker with the sand to call the entire woke-industrial complex “zombies” and then follow that up with a book that quotes from Blazing Saddles on its opening page.

You remember Blazing Saddles, don’t you? It’s one of the funniest and most controversial movies ever made, a cultural sacrament for Generation X if ever there was one. It uses racism to mock racism, stupidity to rip stupidity, and comedy to take a sledgehammer to anyone who takes themselves too seriously — and in ways and from angles that make it an impossible movie to get produced today.

But back to the book. Its title is — mischievously —The White Privilege Album, and it’s A.J. Rice’s newest exploration of the insanity of our times.

The Worst of Times and the Worse of Times

According to Rice, we live in the worst of times, and, well, also the worse of times. Sure, we have all the technology we’ll probably ever need and the whole world’s knowledge at our fingertips at any given moment. You can explore the finest works of art, delve into the achievements of the Maya, study the miraculous founding of America — anything you want.

But millions merely use all this technology and knowledge we’re privileged to have to attack America relentlessly every hour of the day. We pay for public schools through our taxes, and those schools are filled with woke activists masquerading as teachers, indoctrinating our kids with ESG, DEI, and transgenderist trash and telling them that every generation before them was hopelessly racist and evil.

Well, only if they were white. Everyone else gets a free pass even if their ancestors owned slaves, committed genocide, or did other terrible things. Only white people need apply for the re-education camps Hillary Clinton wants, and only white people would be subject to the censorship regime that the entire Democratic Party so openly wants.

There’s your white privilege, Rice says. You’ll be subject to the whims of woke wackos and their digital shock troops. Your leaders will be cast as villains. You’ll be lied to, hoaxed, and perhaps doxxed and canceled. And you’ll like it or they’ll call you a racist and cancel you again.

Rice Exposes Hoaxes and Lies as the Foundation of the Left

As Rice documents and exposes in this extremely well-researched and written book, the major movements of our time are based on hoaxes, lies, smears, and bullying. Wokeness incorporates all of that — it’s a hoax against America and Western values, based on lies and half-truths taken out of context, aimed at smearing and undermining our history and culture, and weaponizes organized bullying to intimidate the weak-minded into submission.

Likewise, Joe Biden’s very reason for running for president was, according to him, based on the Trump “very fine people” quote — which was torn out of context and twisted into a hoax in which he is said to have praised neo-Nazis.Spoiler: He didn’t. Biden lied. A lot.

These hoaxes and lies are the foundation of the entire left now, Rice writes. Chapter by chapter, Rice takes on and tears apart the woke NBA, California Gov. Gavin Newsom’s Marxist racism, Barack Obama’s stealth wokeness, Ibrahim X. Kendi’s lucrative race-hustling grift, and so much more. Along the way, you will see actual white privilege, in the form of a ne’er-do-well crackhead who suspiciously stays out of jail no matter what while black and brown offenders end up in prison for years on similar offenses. You’ll also learn why Aunt Jemima and Uncle Ben were really fired. In fact, you’ll get 12 months of “white privilege” in this amazing book.

But The White Privilege Album isn’t just about mowing down woke zombies. There’s plenty of that, but it’s also about lifting up heroes who deserve it and rebuilding the sense that America is great and good and always has been. A.J. Rice delivers the triumphs amid the seemingly overwhelming evil, through chapter after chapter that you won’t be able to put down.

Rice: The left hates Western civilization, the middle class, children

“Here’s the takeaway,” he said. “I’m abducting their language and using it against them.”

It started with so-called “white privilege,” he said.

“When you hear these terms, ‘white privilege,’ ‘intersectionality,’ or ‘check your privilege,’ or these constructs of white privilege, when you hear the left, do that what they’re really talking about is three things,” he said.

“One, Western civilization, and I mean Greco-Roman Judeo-Christian civilization, which has to go, they want it to go away,” the author said. “That’s why it’s not just about tearing down statues. It’s everything from Columbus to Winston Churchill — it has to go.”

The second thing is the middle class, Rice said. “The left cultural Marxists and economic Marxists have been trying to destroy the middle class for 100 years,” he said.

“They know to do that because they want a peasant class because Marxism has never thrived,” he said. “Not in Venezuela, not North Korea, none of these places when there’s been a healthy middle class — so middle class has to go.”

The third thing is children, he said.  “I believe happy people have more children; of course, more children mean more global warming, so the third thing that they have to destroy is the nuclear family,” he said.

“We know they have to destroy it because Black Lives Matter told us that they wanted to destroy it on their website.”

Rice: America is a multi-ethnic country

Rice said he is trying to untangle Americans from the labels that the left uses to confuse us.

“Let me just say, we are not a multicultural country,” he said.

We are a multi-ethnic country, and the middle class and Western civilization in the nuclear family are colorblind,” he said.

“They’re not white, black, or anything else, and if you want to come here and you do it legally, you can come here and participate in this great experiment,” Rice said.

“As long as the cultural Marxists don’t destroy it.”

Arctic Ice In Perspective 2024

With Arctic ice melting season winding down, warmists again stoked fears about ice disappearing in the North. In fact, the pattern of Arctic ice seen in historical perspective is not alarming. People are over-thinking and over-analyzing Arctic Ice extents, and getting wrapped around the axle (or should I say axis).  So let’s keep it simple and we can all readily understand what is happening up North.

I have noticed at some other blogs people complain about my monthly Arctic ice updates focusing on extents starting in 2007. This post will show why that time period is entirely reasonable as a subject for analysis. I will use the ever popular NOAA dataset derived from satellite passive microwave sensors.  It sometimes understates the ice extents, but everyone refers to it and it is complete from 1981 to present.  Here’s what NOAA reports (in M km2):

We are frequently told that only the March maximums and the September minimums matter, since the other months are only transitional between the two.  So the graph above shows the mean ice extent, averaging the two months March and September.  The data comes from Sea Ice Index (SII).

If I were adding this to the Ice House of Mirrors, the name would be The X-Ray Ice Mirror, because it looks into the structure of the time series.   For even more clarity and simplicity, here is the table:

NOAA NH Annual Average Ice Extents (in M km2).  Sea Ice Index v3.0 (here)

Year Average Change Rate of Change
1981 11.385    
1997 11.077 -0.308 -0.019 per year
2007 9.405 -1.672 -0.167 per year
2024 9.626  +0.221 +0.013 per year

The satellites involve rocket science, but this does not.  There was a small loss of ice extent over the first 16 years, then a dramatic downturn for 10 years, 9 times the rate as before. That was followed by the current 17-year plateau with a slight gain comparable to the beginning loss.  All the fuss is over that middle period, and we know what caused it.  A lot of multi-year ice was flushed out through the Fram Strait, leaving behind more easily melted younger ice. The effects from that natural occurrence bottomed out in 2007.

Kwok et al say this about the Variability of Fram Strait ice flux:

The average winter area flux over the 18-year record (1978–1996) is 670,000 km2, ;7% of the area of the Arctic Ocean. The winter area flux ranges from a minimum of 450,000 km2 in 1984 to a maximum of 906,000 km2 in 1995. . .The average winter volume flux over the winters of October 1990 through May 1995 is 1745 km3 ranging from a low of 1375 km3 in the 1990 flux to a high of 2791 km3 in 1994.

https://www.researchgate.net/publication/261010602/download

Conclusion:

Some complain it is too soon to say Arctic Ice is recovering, or that 2007 is a true change point.  The same people were quick to jump on a declining period after 1996 as evidence of a “Death Spiral.”

Footnote:

No one knows what will happen to Arctic ice.

Except maybe the polar bears.

And they are not talking.

Except, of course, to the admen from Coca-Cola


Bureaucrats Against Democracy

David Blackmon provides the background in his Daily Caller article Bureaucrats Worry Democracy Will Get In The Way Of Their Climate Agenda.  As the above image suggests some of those in power have not shied away from acting in defiance of democratic norms. By imposing climate policies and regulations they have diminished the livelihoods and freedoms of the public they supposedly serve. Excerpts in italics with my bolds and added images.

I have frequently written over the last several years that the agenda of the climate-alarm lobby in the western world is not consistent with the maintenance of democratic forms of government.

Governments maintained by free elections, the free flow of communications and other democratic institutions are not able to engage in the kinds of long-term central planning exercises required to force a transition from one form of energy and transportation systems to completely different ones.

Why? Because once the negative impacts of vastly higher prices for all forms of energy begin to impact the masses, the masses in such democratic societies are going to rebel, first at the ballot box and if that is not allowed by the elites to work, then by more aggressive means.

This is not a problem for authoritarian or totalitarian forms of government, like those in Saudi Arabia, China and Russia, where long-term central planning projects invoking government control of the means of production is a long-ingrained way of life. If the people revolt, then the crackdowns are bound to come.

This societal dynamic is a simple reality of life that the pushers of the climate alarm narrative and forced energy transition in western societies have been loath to admit. But, in recent days, two key figures who have pushed the climate alarm narrative in both the United States and Canada have agreed with my thesis in public remarks.

In so doing, they are uttering the quiet part about
the real agenda of climate alarmism out loud.

Last week, former Obama Secretary of State and Biden climate czar John Kerry made remarks about the “problem” posed by the First Amendment to the U.S. Constitution that should make every American’s skin crawl. Speaking about the inability of the federal government to stamp out what it believes to be misinformation on big social media platforms, Kerry said: “Our First Amendment stands as a major block to the ability to be able to just, you know, hammer it out of existence,” adding, “I think democracies are, are very challenged right now and have not proven they can move fast enough or big enough to deal with the challenges that we are facing.”

Never mind that the U.S. government has long been the most focused purveyor of disinformation and misinformation in our society, Kerry wants to stop the free flow of information on the Internet.

The most obvious targets are Elon Musk and X, which is essentially the only big social media platform that does not willingly submit to the government’s demands for censoring speech.

Kerry’s desired solution is for Democrats to “win the ground, win the right to govern by hopefully having, you know, winning enough votes that you’re free to be able to, to, implement change.” The change desired by Kerry and Vice President Kamala Harris and other prominent Democrats is to obtain enough power in Congress and the presidency to revoke the Senate filibuster, pack the Supreme Court, enact the economically ruinous Green New Deal, and do it all before the public has any opportunity to rebel.

Not to be outdone by Kerry, Deputy Prime Minister Chrystia Freeland of Canada, who is a longtime member of the board of trustees of the World Economic Forum, was quoted Monday as saying: “Our shrinking glaciers, and our warming oceans, are asking us wordlessly but emphatically, if democratic societies can rise to the existential challenge of climate change.

It should come as no surprise to anyone that the central governments of both Canada and the United States have moved in increasingly authoritarian directions under their current leadership, both of which have used the climate-alarm narrative as justification. This move was widely predicted once the utility of the COVID-19 pandemic to rationalize government censorship and restrictions of individual liberties began to fade in 2021.

Two sides of the same coin.

Frustrated by their perceived need to move even faster to restrict freedoms and destroy democratic levers of public response to their actions, these zealots are now discarding their soft talking points in favor of more aggressive messaging.

This new willingness to say the quiet part out loud
should truly alarm anyone who values their freedoms.

Alarmists Attack IPCC Not Linking Disasters to CO2


Chris Morrison reports on the flap over Climate Crisis™ media tactics in his Daily Sceptic article Climate Activists Frustrated by IPCC’s Refusal to Link Extreme Weather With Carbon Emissions.  Excerpts in italics with my bolds and added images.

Last June, the state-reliant BBC reported that human-caused climate change had made U.S. and Mexico heatwaves “35 times more likely”. Nothing out of the ordinary here in mainstream media with everyone from climate comedy turn ‘Jim’ Dale to UN chief Antonio ‘Boiling’ Guterres making these types of bizarre attributions. But for those who closely follow climate science and the assessments of the Intergovernmental Panel on Climate Change (IPCC), “such headlines can be difficult to make sense of”, observes the distinguished science writer Roger Pielke. In a hard-hitting attack on the pseudo-scientific industry of weather attribution, he states:

“neither the IPCC nor the underlying scientific literature comes anywhere close to making such strong and“ certain claims of attribution”.

Pielke argues that the extreme position of attributing individual bad weather events is “roughly aligned” with the far Left. “Climate science is not, or at least should not serve as a proxy for political tribes,” he cautions. But of course it is. The Net Zero fantasy is a collectivist national and supra-national agenda that increasingly relies on demonising bad weather. With global temperatures rising at most only 0.1°C a decade, laughter can only be general and side-splitting when IPCC boss Jim Skea claims that British summers will be 6°C hotter in less than 50 years. Two extended temperature pauses since 2000 have not helped the cause of global boiling. In addition there are increasing doubts about the reliability of temperature recordings by many meteorological organisations that seem unable to properly account for massive urban heat corruptions.

The big problem for ‘far Left’ climate extremists is that event attribution is a form, in Pielke’s words, of “tactical science”. Such science serves legal and political ends and is not always subject to peer review. As the BBC and other media outlets can attest, the work is “generally promoted via press release”. It has been developed in response to the failure of the IPCC to detect and attribute most types of extreme weather including drought, flooding, storms and wildfires to human involvement, notes Pielke. Worse, the IPCC can find little sign of human involvement going forward to 2100.

Scientists cannot answer directly whether particular events are
caused by climate change since extremes occur naturally.

Meanwhile the IPCC is somewhat dismissive about weather attribution, or as Pielke terms it, “weather attribution alchemy”. It notes: “The usefulness or applicability of available extreme event attribution methods for assessing climate-related risks remains subject to debate.” The IPCC is a biased body full of climate alarmists, but its inability to attribute single events to humans is obviously highly irritating and somewhat inconvenient for activists and their media counterparts.

Dr. Friederike Otto speaking with reporter at Oxford.

Dr. Friederike Otto runs World Weather Attribution (WWA) out of Imperial College London and is a frequent presence on the BBC. WWA is behind many of the immediate attributions of bad weather to human causes and its motives are clear. As Dr. Otto has noted: “Unlike every other branch of climate science or science in general, event attribution was actually originally suggested with the courts in mind.” Otto is clear that the main function of such studies, part-funded by Net Zero-supporting billionaires and heavily pushed by aligned mainstream media, is to support lawsuits against fossil fuel companies. She explains this strategy in detail in the interview, ‘From Extreme Event Attribution to Climate Litigation‘.

The inability of the IPCC to attribute bad weather to humans has been viewed by climate advocates as “politically problematic”, continues Pielke. He notes the work of climate activists Elizabeth Lloyd and Naomi Oreskes who are worried that the lack of attribution “conveys the impression that we just do not know, which feeds into uncertainty, doubt or incompleteness, and the general tendency of humans to discount threats that are not imminent”.

Perish the thought that there should be uncertainty, doubt
or incompleteness in the settled world of climate science.

It is of course different from all other branches of science in that all its opinions are right and consequently there is no need for the unhelpful process of constant inquiry and experiment. It need hardly be added that no doubt exists at the BBC, where former Radio 4 Today Editor Sarah Sands wrote the foreword to a WWA guide for journalists. Recalling when the late Nigel Lawson suggested there had been no increase in extreme weather, Sands noted: “I wish we had this guide for journalists to help us mount a more effective challenge to his claim.” These days, Sands enthused, attribution studies have given us “significant insight into the horsemen of the climate apocalypse”.

For her part, Otto is keen to crack down on the heretics. She was at the forefront of the recent notorious retraction of a paper in a Springer Nature journal that stated there was no evidence that the climate was breaking down. Written by four Italian scientists and led by Professor Gianluca Alimonti, they argued that a climate emergency was not supported by the data. Otto, who had previously worked in the Oxford School of Geography for 10 years, claimed the scientists were not writing in good faith. “If the journal cares about science they should withdraw it loudly and publicly saying it should never have been published,” she demanded.

A recent scientific study has confirmed that natural and climate-related disasters are declining during the 21st century. Getty Images/iStcokphoto

Declining Weather Disasters Prove Doomsters Wrong (Alimonti et al.)

Benny Peiser makes the case in his NY Post article Despite climate-change hysterics, weather disasters have decreased.  Excerpts in italics with my bolds and added images.

A recent scientific study has confirmed what climate realists have been highlighting for some time: Natural and climate-related disasters have been declining rather than increasing during the 21st century.

In a paper published this year in one of the world’s leading journals on environmental hazards, Italian scientists Gianluca Alimonti and Luigi Mariani analyzed the number and temporal trends of natural disasters reported since 1900.

A 2015 study by 22 scientists from around the world found that cold kills over 17 times more people than heat. Thus the planet’s recent modest warming has been saving millions of lives.

Based on the best available data, the two scientists concluded the 21st century has seen “a decreasing trend [of natural disasters] to 2022” which is “characterized by a significant decline in number of events.”

The researchers emphasized that their conclusion “sits in marked contradiction to earlier analyses by UN bodies which predict an increasing number of natural disasters and impacts in concert with global warming.”

“Our analyses strongly refute this assertion,” they wrote.

For years, international agencies such as the UN Office for Disaster Risk Reduction, the Food and Agriculture Organization of the United Nations, the World Meteorological Organization and the International Red Cross have claimed that climate-related disasters are escalating.

Floods lead a near doubling of disaster events from 1980 to 1999 compared to 2000 to 2019, according to a report by the UN Office for Disaster Risk Reduction.

“Weather disasters are striking the world four to five times more often and causing seven times more damage than in the 1970s,” the WMO reported in 2021.

Disaster and weather officials affiliated with the UN claim this dramatic rise is due to global warming: The changing climate, they say, is making weather disasters stronger and more frequent.

Fourth National Climate Assessment, Volume II: Impacts, Risks, and Adaptation in the United States.

The increased frequency of heat waves, droughts, flooding, winter storms, hurricanes, wildfires and other extreme weather events prove the negative impact of a warming world, according to various UN agencies and nongovernmental organizations.

Yet, as the actual data used by these organizations reveals, the last 20 years have in fact seen a significant decline in such events.

It turns out that climate alarmists have based their claims on a highly misleading comparison of disaster data of the late 20th and the early 21st centuries.

By their tally, the period from 1980 to 2000 saw about 4,200 natural disasters —with the number increasing sharply, to more than 8,000, during the first 20 years of this century.

This conclusion, however, is fatally flawed: It fails to take into account the huge increase in the global reporting of disasters engendered by the invention and rapid global dissemination of new communication technologies since the 1980s.

The arrival of the internet and other new communication tools has undoubtedly accelerated the reporting of disasters from all corners of the world — events that were significantly underreported in earlier decades.

As well, the number of people killed by natural and climate-related disasters has fallen steadily over the past 120 years — from 500,000 deaths per decade in the early 20th century down to less than 50,000 per decade in the last ten years.

And, contrary to claims by NGOs and government officials, climate-related disaster losses have also declined as a percentage of global GDP during the last 30 years — from about 0.25% of GDP in 1990 to less than 0.20% in 2023.

The study by Alimonti and Mariani vindicates what we at the Global Warming Policy Foundation have been pointing out for a long time: Climate-related disasters are not on the rise, despite warming temperatures.

International agencies and the news media have hyped climate disasters for far too long, while ignoring the factual downward trend.

”First they ignore you, then they laugh at you, then they fight you, then you win,” as the saying goes.  UN agencies and NGOs have been misleading the public for years. It’s past time for the truth to win out.

Benny Peiser is the director of the London-based Global Warming Policy Foundation.

See also

Our Weather Extremes Are Customary in History

Figure27: Annual count of EF3 and above tornadoes in the US, 1950–2021. Source: Source: NOAA/NCEI.106, 107


UAH September 2024: NH Land Up, SH Land Down

The post below updates the UAH record of air temperatures over land and ocean. Each month and year exposes again the growing disconnect between the real world and the Zero Carbon zealots.  It is as though the anti-hydrocarbon band wagon hopes to drown out the data contradicting their justification for the Great Energy Transition.  Yes, there has been warming from an El Nino buildup coincidental with North Atlantic warming, but no basis to blame it on CO2.  

As an overview consider how recent rapid cooling  completely overcame the warming from the last 3 El Ninos (1998, 2010 and 2016).  The UAH record shows that the effects of the last one were gone as of April 2021, again in November 2021, and in February and June 2022  At year end 2022 and continuing into 2023 global temp anomaly matched or went lower than average since 1995, an ENSO neutral year. (UAH baseline is now 1991-2020). Now we have an usual El Nino warming spike of uncertain cause, unrelated to steadily rising CO2 and now moderating.

For reference I added an overlay of CO2 annual concentrations as measured at Mauna Loa.  While temperatures fluctuated up and down ending flat, CO2 went up steadily by ~60 ppm, a 15% increase.

Furthermore, going back to previous warmings prior to the satellite record shows that the entire rise of 0.8C since 1947 is due to oceanic, not human activity.

gmt-warming-events

The animation is an update of a previous analysis from Dr. Murry Salby.  These graphs use Hadcrut4 and include the 2016 El Nino warming event.  The exhibit shows since 1947 GMT warmed by 0.8 C, from 13.9 to 14.7, as estimated by Hadcrut4.  This resulted from three natural warming events involving ocean cycles. The most recent rise 2013-16 lifted temperatures by 0.2C.  Previously the 1997-98 El Nino produced a plateau increase of 0.4C.  Before that, a rise from 1977-81 added 0.2C to start the warming since 1947.

Importantly, the theory of human-caused global warming asserts that increasing CO2 in the atmosphere changes the baseline and causes systemic warming in our climate.  On the contrary, all of the warming since 1947 was episodic, coming from three brief events associated with oceanic cycles. And now in 2024 we have seen an amazing episode with a temperature spike driven by ocean air warming in all regions, along with rising NH land temperatures, now oscillating near its peak.

Chris Schoeneveld has produced a similar graph to the animation above, with a temperature series combining HadCRUT4 and UAH6. H/T WUWT

image-8


mc_wh_gas_web20210423124932

See Also Worst Threat: Greenhouse Gas or Quiet Sun?

September 2024 NH Land Spike Warms More than SH Land Drops

 banner-blog

With apologies to Paul Revere, this post is on the lookout for cooler weather with an eye on both the Land and the Sea.  While you heard a lot about 2020-21 temperatures matching 2016 as the highest ever, that spin ignores how fast the cooling set in.  The UAH data analyzed below shows that warming from the last El Nino had fully dissipated with chilly temperatures in all regions. After a warming blip in 2022, land and ocean temps dropped again with 2023 starting below the mean since 1995.  Spring and Summer 2023 saw a series of warmings, continuing into October, followed by cooling. 

UAH has updated their tlt (temperatures in lower troposphere) dataset for September 2024. Posts on their reading of ocean air temps this month are ahead of the update from HadSST4.  I posted last month on SSTs using NH Pulls Oceans Warmer August 2024.  These posts have a separate graph of land air temps because the comparisons and contrasts are interesting as we contemplate possible cooling in coming months and years.

Sometimes air temps over land diverge from ocean air changes. In July 2024 all oceans were unchanged except for Tropical warming, while all land regions rose slightly. Then in August we saw a warming leap in SH land, slight Land cooling elsewhere, a dip in Tropical Ocean temp and slightly elsewhere. Now in September a dramatic drop in SH land, overcome by a greater NH land increase. End result is an upward bump in Global anomaly.

Note:  UAH has shifted their baseline from 1981-2010 to 1991-2020 beginning with January 2021.  In the charts below, the trends and fluctuations remain the same but the anomaly values changed with the baseline reference shift.

Presently sea surface temperatures (SST) are the best available indicator of heat content gained or lost from earth’s climate system.  Enthalpy is the thermodynamic term for total heat content in a system, and humidity differences in air parcels affect enthalpy.  Measuring water temperature directly avoids distorted impressions from air measurements.  In addition, ocean covers 71% of the planet surface and thus dominates surface temperature estimates.  Eventually we will likely have reliable means of recording water temperatures at depth.

Recently, Dr. Ole Humlum reported from his research that air temperatures lag 2-3 months behind changes in SST.  Thus cooling oceans portend cooling land air temperatures to follow.  He also observed that changes in CO2 atmospheric concentrations lag behind SST by 11-12 months.  This latter point is addressed in a previous post Who to Blame for Rising CO2?

After a change in priorities, updates are now exclusive to HadSST4.  For comparison we can also look at lower troposphere temperatures (TLT) from UAHv6 which are now posted for September.  The temperature record is derived from microwave sounding units (MSU) on board satellites like the one pictured above. Recently there was a change in UAH processing of satellite drift corrections, including dropping one platform which can no longer be corrected. The graphs below are taken from the revised and current dataset.

The UAH dataset includes temperature results for air above the oceans, and thus should be most comparable to the SSTs. There is the additional feature that ocean air temps avoid Urban Heat Islands (UHI).  The graph below shows monthly anomalies for ocean air temps since January 2015.

Note 2020 was warmed mainly by a spike in February in all regions, and secondarily by an October spike in NH alone. In 2021, SH and the Tropics both pulled the Global anomaly down to a new low in April. Then SH and Tropics upward spikes, along with NH warming brought Global temps to a peak in October.  That warmth was gone as November 2021 ocean temps plummeted everywhere. After an upward bump 01/2022 temps reversed and plunged downward in June.  After an upward spike in July, ocean air everywhere cooled in August and also in September.   

After sharp cooling everywhere in January 2023, all regions were into negative territory. Then there is a remarkable spiking of Tropical ocean temps from -0.4 up to + 1.3 in January 2024.  The rise was matched by other regions in 2024 January through May, before dropping lower. Now in September comes an upward bump in NH and Tropics pulling up Global anomaly.

Land Air Temperatures Tracking in Seesaw Pattern

We sometimes overlook that in climate temperature records, while the oceans are measured directly with SSTs, land temps are measured only indirectly.  The land temperature records at surface stations sample air temps at 2 meters above ground.  UAH gives tlt anomalies for air over land separately from ocean air temps.  The graph updated for September is below.

Here we have fresh evidence of the greater volatility of the Land temperatures, along with extraordinary departures by SH land.  Land temps are dominated by NH with a 2021 spike in January,  then dropping before rising in the summer to peak in October 2021. As with the ocean air temps, all that was erased in November with a sharp cooling everywhere.  After a summer 2022 NH spike, land temps dropped everywhere, and in January, further cooling in SH and Tropics offset by an uptick in NH. 

Remarkably, in 2023, SH land air anomaly shot up 2.1C, from  -0.6C in January to +1.5 in September, then dropped sharply to 0.6 in January 2024, matching the SH peak in 2016. Then through May 2024 NH and Tropical land temps spiked to new highs, before dropping down.  Now in August SH land spiked up, then reversed down in September.  NH and Tropics bumped upward, and Global land anomaly rose slightly

The Bigger Picture UAH Global Since 1980

The chart shows monthly Global anomalies starting 01/1980 to present.  The average monthly anomaly is -0.04, for this period of more than four decades.  The graph shows the 1998 El Nino after which the mean resumed, and again after the smaller 2010 event. The 2016 El Nino matched 1998 peak and in addition NH after effects lasted longer, followed by the NH warming 2019-20.   An upward bump in 2021 was reversed with temps having returned close to the mean as of 2/2022.  March and April brought warmer Global temps, later reversed

With the sharp drops in Nov., Dec. and January 2023 temps, there was no increase over 1980. Then in 2023 the buildup to the October/November peak exceeded the sharp April peak of the El Nino 1998 event. It also surpassed the February peak in 2016. In 2024 March and April took the Global anomaly to a new peak of 1.05C.  The cool down started with May dropping to 0.90C, and in June a further decline to 0.80C.  The warming level rose again and has persisted through September.

The graph reminds of another chart showing the abrupt ejection of humid air from Hunga Tonga eruption.

TLTs include mixing above the oceans and probably some influence from nearby more volatile land temps.  Clearly NH and Global land temps have been dropping in a seesaw pattern, nearly 1C lower than the 2016 peak.  Since the ocean has 1000 times the heat capacity as the atmosphere, that cooling is a significant driving force.  TLT measures started the recent cooling later than SSTs from HadSST4, but are now showing the same pattern. Despite the three El Ninos, their warming had not persisted prior to 2023, and without them it would probably have cooled since 1995.  Of course, the future has not yet been written.


Arctic Shipping Ends Early Due to Growing Ice

Ice-strengthened supramax Kumpula (Arc 4) on the NSR being escorted by nuclear icebreaker Vaygach. (Source: Courtesy of ESL Shipping)

The report comes from Malte Humpert at gCaptain  Early Winter Ice Halts Arctic Shipping Traffic Weeks Ahead of Schedule.  Excerpts in italics with my bolds.

The summer shipping window on Russia’s Northern Sea Route is coming to a rapid close weeks ahead of schedule. A number of vessels and convoys are rushing to complete their transits before the route shuts down in the next three weeks.

Source: Northern Sea Route Information Office

Unlike the last couple of summers when Russia’s Arctic coastal waterways were fully clear of sea ice, residual winter ice persisted in the eastern section this year. This has resulted in the early onset of ice formation especially in the Laptev, East Siberian, and Chukchi Seas.

NSRIO: Ice is still present in the eastern sector of the NSR preventing free passage of ships without ice class. The nuclear icebreaker Sibir has been operating in the East Siberian and Chukchi Seas since the end of June together with the nuclear icebreaker Vaygach, which has been in the area since mid-July. In several areas of the Chukchi and East Siberian Seas heavy ice conditions are still observed, which directly affects the admission of low ice class vessels to these areas. The western part of the NSR is mostly ice-free. Above is a map of ice conditions as of August 7, 2024.

Russia’s Northern Sea Route Administration announced that vessels with no ice class will have to vacate the waterway by October 15, around 2-3 weeks ahead of schedule. For vessels with light and medium ice classifications the navigation season will end on October 20 and October 31 respectively.

The last permitted start of convoys heading east will be October 10, leaving just one more week for vessels to begin their Arctic transit.

This year’s early shutdown comes three years after narrowly avoiding a major incident three years ago. In October 2021 Russian authorities reacted too late to begin closing down the NSR as winter sea ice drifted into the main shipping channel and trapped two dozen vessels for more than a month. A 30 centimeter or one foot thick ice layer had formed by the end of October across hundreds of miles of Arctic Ocean.
 
Several icebreakers, including the powerful nuclear vessel Yamal, rushed to the scene from Murmansk over 3,000 nautical miles away to help free the stranded vessels. Over the course of more than 6 weeks several icebreakers worked to break the vessels free and escort them to safety out of the eastern section of the Northern Sea Route. The situation did not fully resolve until the end of December when the last vessels were freed.

Vessels stuck in thick winter sea ice in November 2021 awaiting rescue. (Source: Rosatomflot)

Currently a number of container ships, oil tankers, bulk carriers
and LNG tankers are passing through the route.

In the Far East two LNG carriers and two oil tankers, including the Suezmax tanker Sai Baba, are currently passing through the waters adjacent to the Bering Strait. They are staying clear of multi-year ice around Wrangel Island which has persisted and troubled shipping all summer. A nuclear icebreaker had remained on standby for much of the summer keeping the shipping lane open.

Select container ships, crude oil tankers, and bulk and LNG carriers currently on the NSR. (Source: Shipatlas)

Further west along the route, the first-ever conventional Panamax container ship in the Arctic is about halfway through its transit. The vessel had originally intended to also conduct its return voyage via the Arctic, but will now likely have to return to Asia via the Suez Canal or South Africa route.

A massive Capesize bulk carrier without any ice class, Dodo, is also rushing to complete its eastbound voyage to Caofeidian, China.

Here’s ice activity in last week in the NSR from Chukchi Sea in the east (left side), and threatening in Laptev Sea (right).