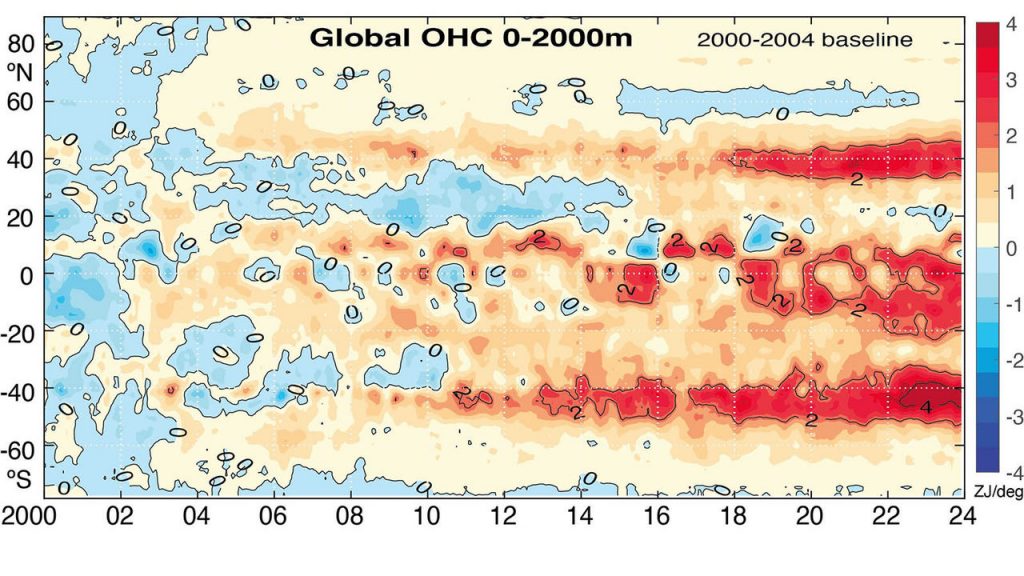
Chart shows two red heating bands, one in the northern hemisphere and one in the south. A more variable area including high temperatures lies between the two bands.
A paper analyzing changes in Ocean Heat Content (OHC) since 2000 was published at University of Auckland, summarized here: Unexpected ocean heat patterns show NZ in extreme zone. Excerpts in italics with my bolds and added images.
The world’s oceans are heating faster in two bands stretching around the globe and New Zealand is in one of them, according to new research led by climate scientist Dr Kevin Trenberth.
In both hemispheres, the areas are near 40 degrees latitude. The first band at 40 to 45 degrees south is heating at the world’s fastest pace, with the effect especially pronounced around New Zealand, Tasmania, and Atlantic waters east of Argentina. The second band is around 40 degrees north, with the biggest effects in waters east of the United States in the North Atlantic and east of Japan in the North Pacific.
“This is very striking,” says Trenberth, of the University of Auckland and the National Center of Atmospheric Research (NCAR) in Boulder, Colorado. “It’s unusual to discover such a distinctive pattern jumping out from climate data,” he says. “What is unusual is the absence of warming in the subtropics, near 20 degrees latitude, in both hemispheres.”
The heat bands have developed since 2005 in tandem with poleward shifts in the jet stream, the powerful winds above the Earth’s surface that blow from west to east, and corresponding shifts in ocean currents, according to Trenberth and his co-authors in the Journal of Climate.
Besides the two key zones, sizeable increases in heat took place in the area from 10 degrees north to 20 degrees south, which includes much of the tropics. However, the effect was less distinct because of variations caused by the El Niño-Southern Oscillation climate pattern, Trenberth says.
The scientists processed an “unprecedented” volume of atmospheric and ocean data to assess 1 degree latitude strips of ocean to a depth of 2000m for the period from 2000 to 2023, Trenberth says. Changes in heat content, measured in zettajoules, were compared with a 2000-04 baseline.
The AMS paper is Distinctive Pattern of Global Warming in Ocean Heat Content by Trenberth et al (2025). Excerpts in italics with my bolds and added images.
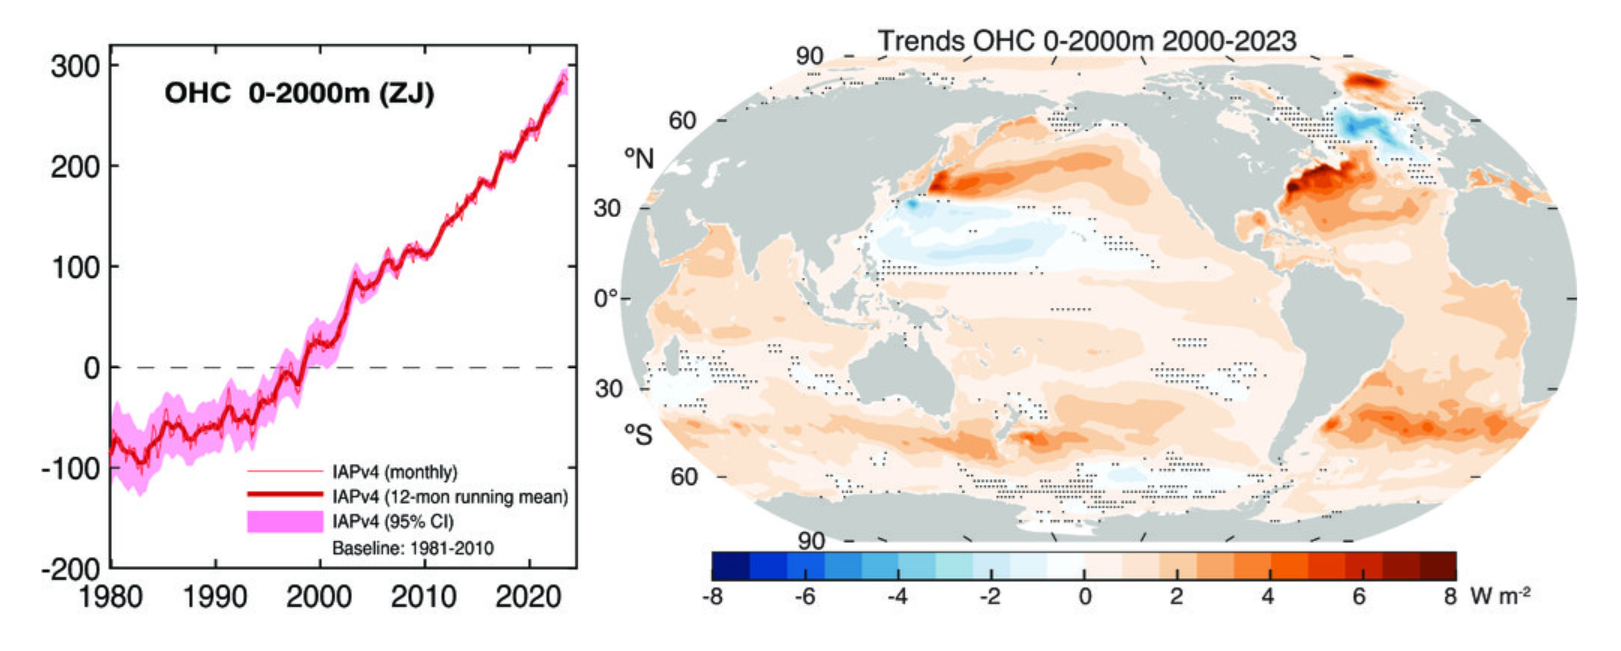
Fig. 1. (left) Global mean OHC (Cheng et al. 2024a) for 0–2000 m relative to a base period 1981–2010 (ZJ). The 95% confidence intervals are shown (sampling and instrumental uncertainties). (right) Trend from 2000 to 2023 in OHC for 0–2000 m (W m−2). The stippled areas show places where the trend is not significant at the 5% level.
The focus of this paper is from 2000 through 2023, as 2000 is when reliable TOA radiation data became available. Accordingly, the OHC for the 0–2000-m depth is shown not only for the global mean but also as spatial trends over the 2000–23 period (Fig. 1); see methods in section 2. The global values from 1980 show increased confidence after 2005 or so, when Argo data became available globally (Cheng et al. 2017, 2024b). The spatial patterns of trends are of considerable interest because, although the ocean is warming nearly everywhere, by far the greatest increases are in the midlatitudes: in western boundary currents east of Japan in the Kuroshio Extension region of the Pacific and in the Gulf Stream extension in the Atlantic, and nearly everywhere from 35° to 50°S in the Southern Hemisphere (SH). Wu et al. (2012) earlier noted that the warming rate in subtropical western boundary currents in all ocean basins far exceeds the globally averaged surface ocean warming rate. Of particular interest is why the midlatitudes are warming the most.
Conclusions
Heating in the climate system from 2000 to 2023 is most clearly manifested in zonal mean OHC for 0–2000-m depth. It occurs primarily in the top 300 m and is evident in SSTs. The SST changes emphasize surface warming in the NH, but the strongest energy increases are in the SH, where ocean area and volume are greater. In the NH, heating occurs at all latitudes in the Atlantic with some modulation and slightly reduced MHT from the south, but in the North Pacific, strong warming near 40°N is countered by cooling near 20°N. The zonal mean across all oceans is more robust than a focus on any particular ocean basin.
Estimates of TOA radiation, atmospheric energy transports, surface fluxes of energy, and redistribution of energy by surface winds and ocean currents reveal that the patterns of OHC warming are mostly caused by systematic changes in the atmospheric circulation, which alters ocean currents. The coupled atmospheric changes have resulted in a striking pattern of changes in the vertically integrated atmospheric energy divergence which is strongly reflected in surface wind stress and anomalous net surface heat fluxes into and out of the ocean.
In response to the wind changes, the ocean redistributes heat meridionally, especially in western boundary currents in the NH. Hence, the patterns are not directly related to TOA radiation imbalances but arise primarily from coupled atmosphere–ocean changes. In turn, those influence storms and cloudiness, and thus TOA radiation. Changes in atmospheric aerosols and associated clouds may have played a role in the North Pacific and North Atlantic, likely in amplifying SST anomalies, although, because land is warming a lot more than the oceans, advection of warmer air from continents over the northern oceans may also be in play.
In the NH, changes are associated with the western boundary currents, but the associated atmospheric changes require analysis of more than a zonal mean framework, as continents play a major role. Nonetheless, it is clear that the atmosphere and ocean currents are systematically redistributing heat from global warming, profoundly affecting local climates.
My Comment:
The final sentence read literally refers to heat released by oceanic activity under the influence of solar radiation and atmospheric circulations such as jet streams. However, the term “global warming” can taken by some to mean planetary higher temperatures due to humans burning hydrocarbons. The leap of faith to attribute human agency to natural processes serves an agenda against society’s traditional energy platform.
Further, the graph showing zettajoules can be misleading. Ocean heat graphs labelled in Zettajoules make it look scary, but the actual temperature changes involved are microscopic, and impossible to measure to such accuracy in pre-ARGO days.
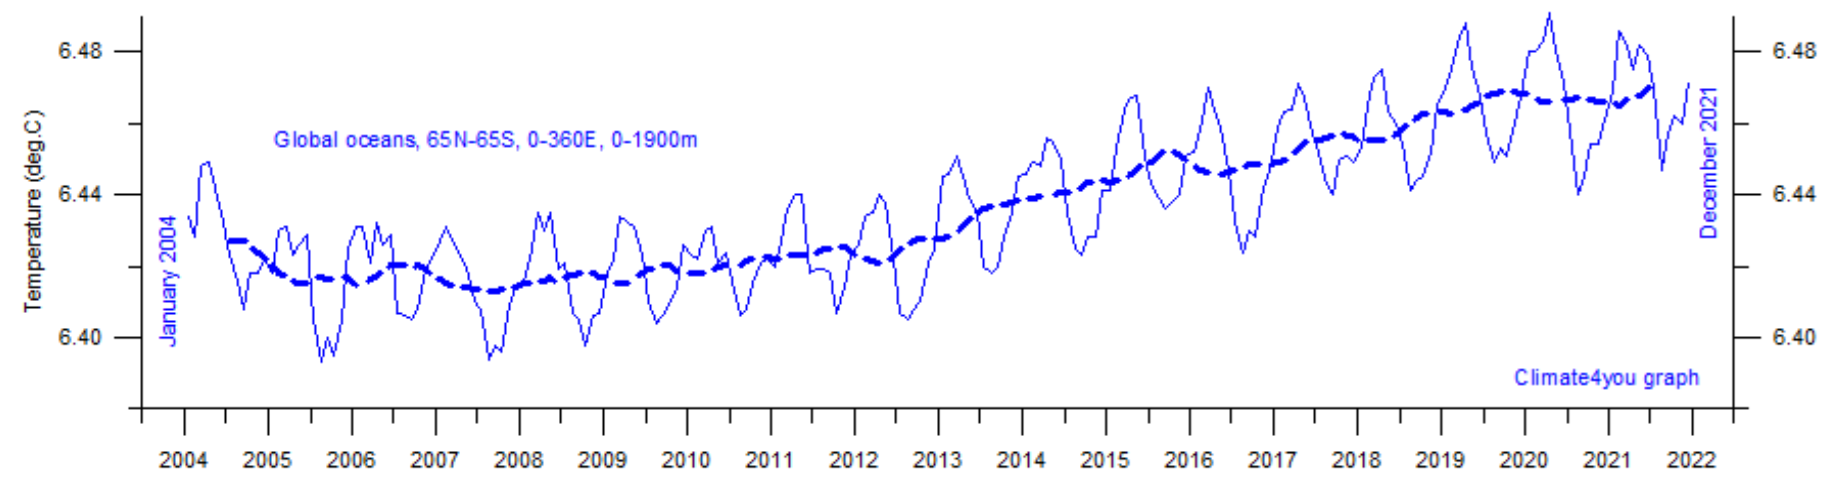
Since 2004, for instance, ARGO data shows an increase of about two hundredths of a degree.

For some time now, I’m asking myself if it could be possible that the temperatures of oceans and seas are also determined by vulcanic activities under the seabed. I mean, if in a coal mine at a depth of 2 km., temperatures rise up to 90 degrees Celsius, how warm then can be the heat radiation at sea depths of 5 to 10 km.? F.i. in the Mediterranean growing vulcanic activities seem to occur. Could these excessively have warmed the Mediterranean Sea and have lately caused the severe weather in Sevillia and the surrounding area? Not sure, just asking.Best regards,GB
LikeLike
Thanks for commenting, Gerard. Here’s some material on seafloor heating:
LikeLike
Dear mr. Ron Clutz,Thank you very much for your interesting enlightening article. I’ll read it carefully and thouroughly, but a short reading already gives me the hope that the political assumption that human CO2-emissions are NOT the angry culprit that causes global warming. A ‘truth’ which I — as a non-scientist with the input of scientists — have been trying to refute for years now. I once loosely translated a Dutch saying: ‘Where politics and science sleep on one pillow, delusion will sleep between them.’Thanks again for you reply and I wish you all the best and succes in your great challenge, to keep more and more people awake!Best RegardsGerard Brummer
LikeLike
Gerard, your words are much appreciated. Let me suggest one other article that addresses the flawed thinking leading to CO2 hysteria.
https://rclutz.com/2021/11/23/2021-update-climate-reductionism/
LikeLike
Thank you so much!Let’s put hope out the saying: ‘The steady drop hollows the hardest stone.’SUCCESS!Gerard
LikeLike
Dear mr. Ron Clutz, Hope this e-mail reaches you well. Herewith I send you a .pdf of the third edition (2022) of a book I wrote in 2013. It’s a ‘Google Translate’ translation, so there surely will be some ‘translating-issues’ in the text. For instance the translation of the dutch title ‘O, Ondergankelijke Mens’ should be something like ‘O, Perishable Man(kind)’ not: ‘O, Transient Man!’ Anyway, I suspect you don’t have the time to read it, so please absolutely don’t feel obliged to do so because I sent you the document.
In 2011 I started to give room for my ebullience on Al Gores ‘An Inconvenient Truth’. It resulted, actually unintentionally, in a book. In short, my ‘conclusion’ is that humanity differs from animals in only one thing: GREED. Greed resulted in human ‘intelligence’, not the other way around. And this greed will ensure that the earth will get rid of the almost unstoppable ‘bacteria plague’, called humanity. Then Earth will become the natural and peaceful planet that it was before humans entered it. The second part in the book is more hopeful.ð
Keep smiling, these are just some thoughts.ð
Best Regards, Gerard Brummer
LikeLike
NASA/RSS have been measuring water vapor content since 1988. The reported data (last report thru 2023) shows an increasing trend of about 1.4 % per decade. Weekly sea surface temperature trend in the central equatorial pacific (area 3.4 in the ENSO program) has been flat since before 1982. How do you explain these observations?
LikeLike
That suggests warming elsewhere, North Atlantic comes to mind.
LikeLike
Population and especially irrigation made a substantial increase in rate around 1965. https://watervaporandwarming.blogspot.com
LikeLike
LikeLike