Merit-Based Energy: Best of the Above, Not All

Steve Milloy puts things in context in his Daily Caller article  ‘All Of The Above’ Is DEI For Energy.  Excerpts in italics with my bolds and added images.

The Restoring Energy Dominance (RED) Coalition recently produced an ad advocating for “all forms of energy.” “You voted for it, you got it,” the ad starts. It features a clip of President Trump saying “All forms of energy, yep…” What exactly does “all forms of energy,” or its 21st century shorthand, “all of the above” really mean? Is it good policy” And, is President Trump for it?

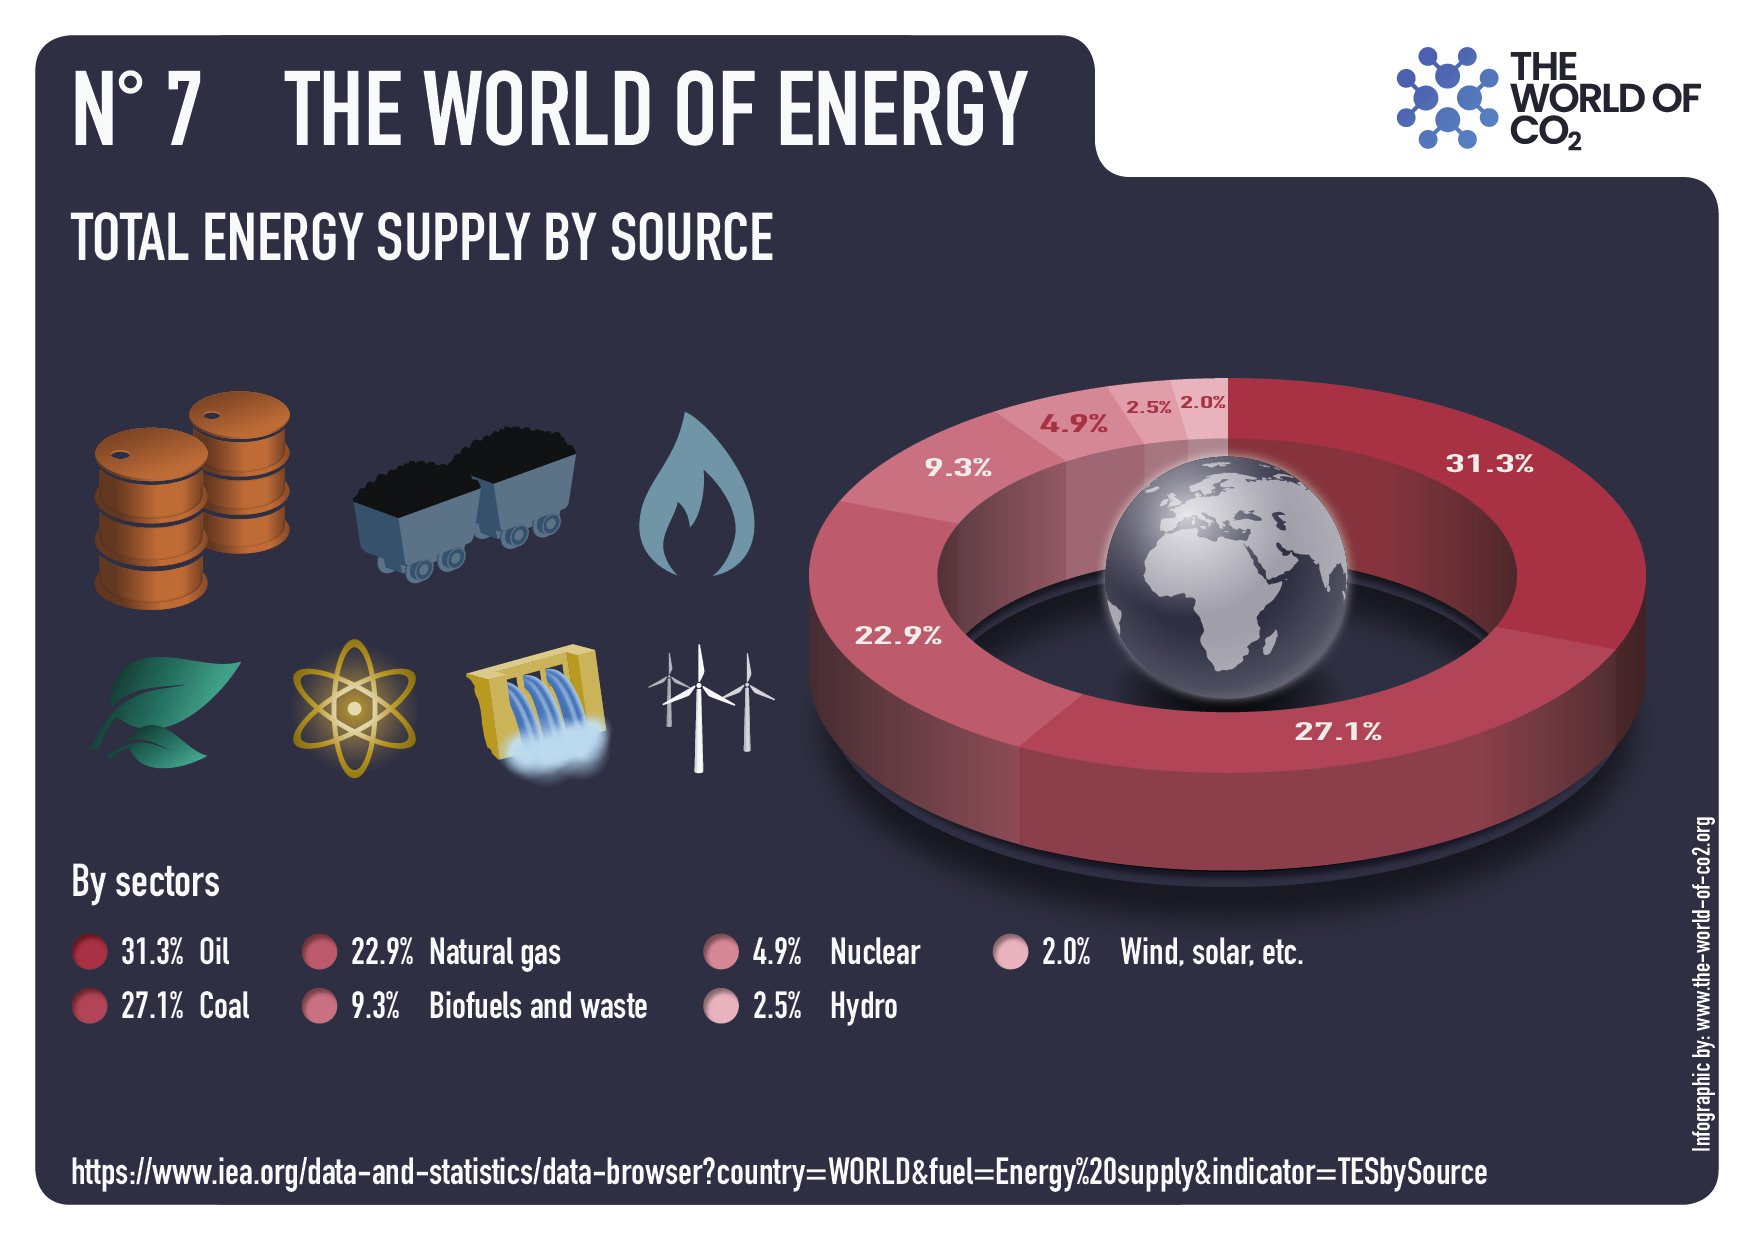
The concept of ‘all of the above’ dates back to a mid-2000s convergence of energy-related events including: (1) the then emerging but imaginary “climate crisis” and (2) an actual energy crisis caused by a combination of factors including the Iraq war, US dependence on OPEC, the rise of energy-hungry China and India, the notion of Peak Oil and more. Congress’s solution to this was the Energy Policy Act of 2005 signed into law by President Bush. It called for expanding domestic energy production, including: oil, natural gas, coal, nuclear, and renewables. “All of the above” wasn’t in common usage at the time, but the law essentially embodied it.

“All of the above” subsequently came into more common use, albeit with different variations, during President Obama’s “war on coal” and his embrace of Executive action to cut emissions because of “climate change.” For President Obama, “all of the above” meant all forms of energy except for coal, which he tried to regulate into extinction. To counter Obama, the coal industry and its Republican supporters used “all of the above” as a desperate means of including coal in the US energy equation.

But the tables have now turned. President Trump supports:
the booming oil and gas industry;
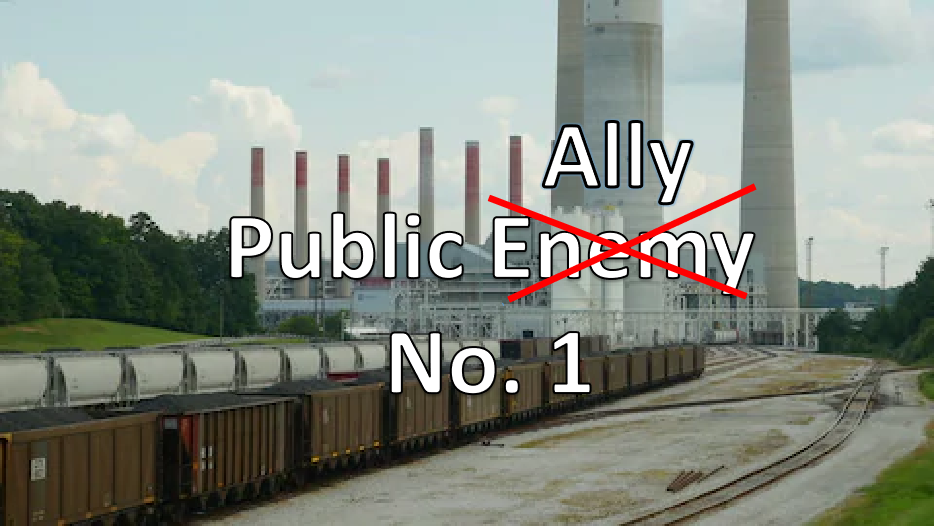
the now-crippled coal industry;
the flailing nuclear industry, and
solar power.

He campaigned and has repeatedly spoken against the onshore and offshore wind industry. He has also issued an executive order to review offshore wind projects and has, thus far, paused one specific project. It is now the wind industry’s turn to scream “all of the above” in hopes of remaining part of the US energy equation.

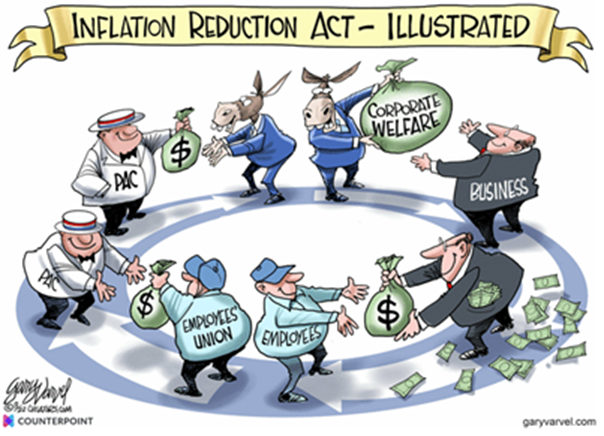
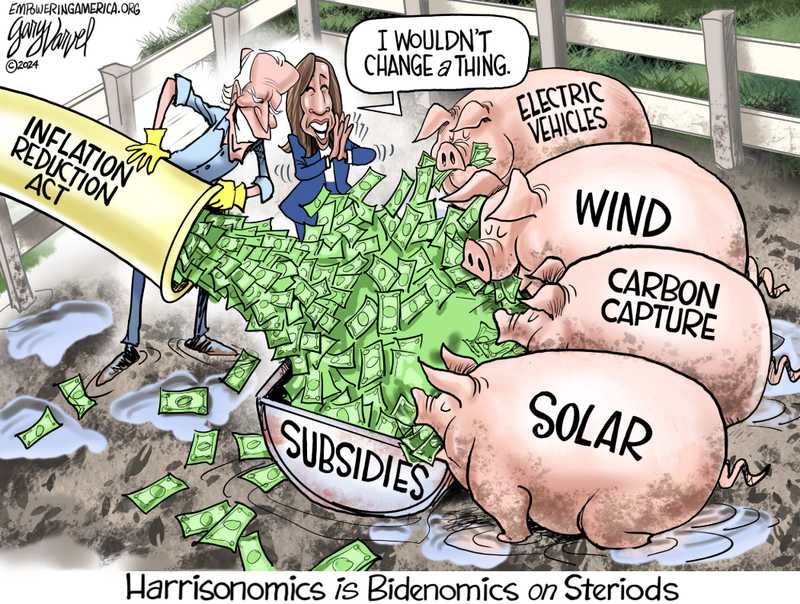
President Trump also campaigned and has taken executive action against what he often calls the “Green New Scam,” which means the climate spending and energy subsidies contained in President Biden’s 2022 Inflation Reduction Act. Opponents of the Green New Scam hope to repeal the subsidies in President Trump’s upcoming Big Beautiful Bill.

The RED Coalition ad would take us back to the days of the Energy Policy Act and its focus on producing domestic energy from all sources. While that may sound reasonable, it ignores the realities we’ve experienced and lessons we’ve learned over the past 20 years.

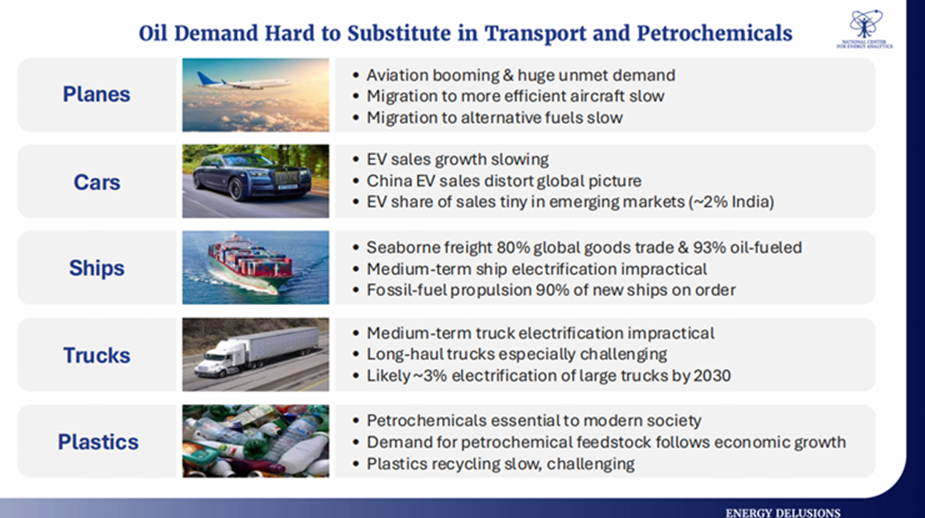
First, Energy Policy Act proponents did not foresee the late-2000s advent and impact of fracking for oil and gas. Whereas in 2005 we were dependent on imports of natural gas and were running out of cheap oil production options, fracking changed the global energy situation almost overnight. Fracking gave the US essentially a limitless supply of oil and gas. That has essentially crushed OPEC’s ability to control the global price of oil. Thanks to fracking, we probably have enough oil and gas to run the entire US economy without any other form of energy.

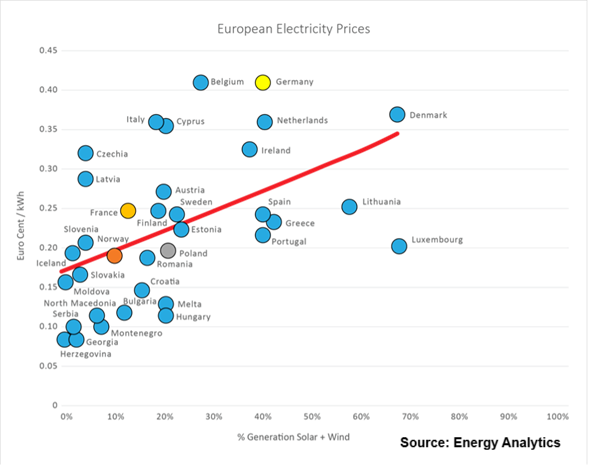
Second, we have been told for decades that wind and solar were cheaper than fossil fuels and were a solution to the alleged “climate crisis.” Both claims have been proven to be false. Wind and solar have not reduced the price of electricity for anyone. At best, they have only reallocated energy costs to taxpayers. Wind and solar have only increased the price of electricity for consumers, even when it is subsidized by taxpayers.

Worse, solar and wind have jeopardized the reliability of our grid. Grid operators now routinely warn of possible grid failure during peak demand. A February winter storm in Texas froze the wind turbines, resulting in hundreds of deaths and almost causing catastrophic grid failure. Too much solar and wind caused a similar grid crisis in Spain and Portugal just last month.

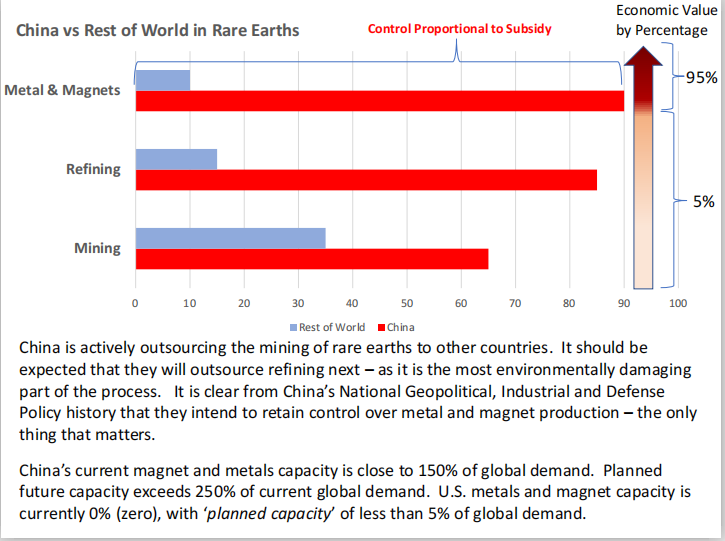
Wind and solar have never been economically viable without subsidies. That’s why wind and solar supporters oppose the end of the Green New Scam. Not only do wind and solar require taxpayer subsidies, they are also intrinsically subsidized by government mandates, and the sourcing of materials and labor from Communist China. This has also had the national security-imperiling effect of making our electricity grid dependent on our geopolitical rival.

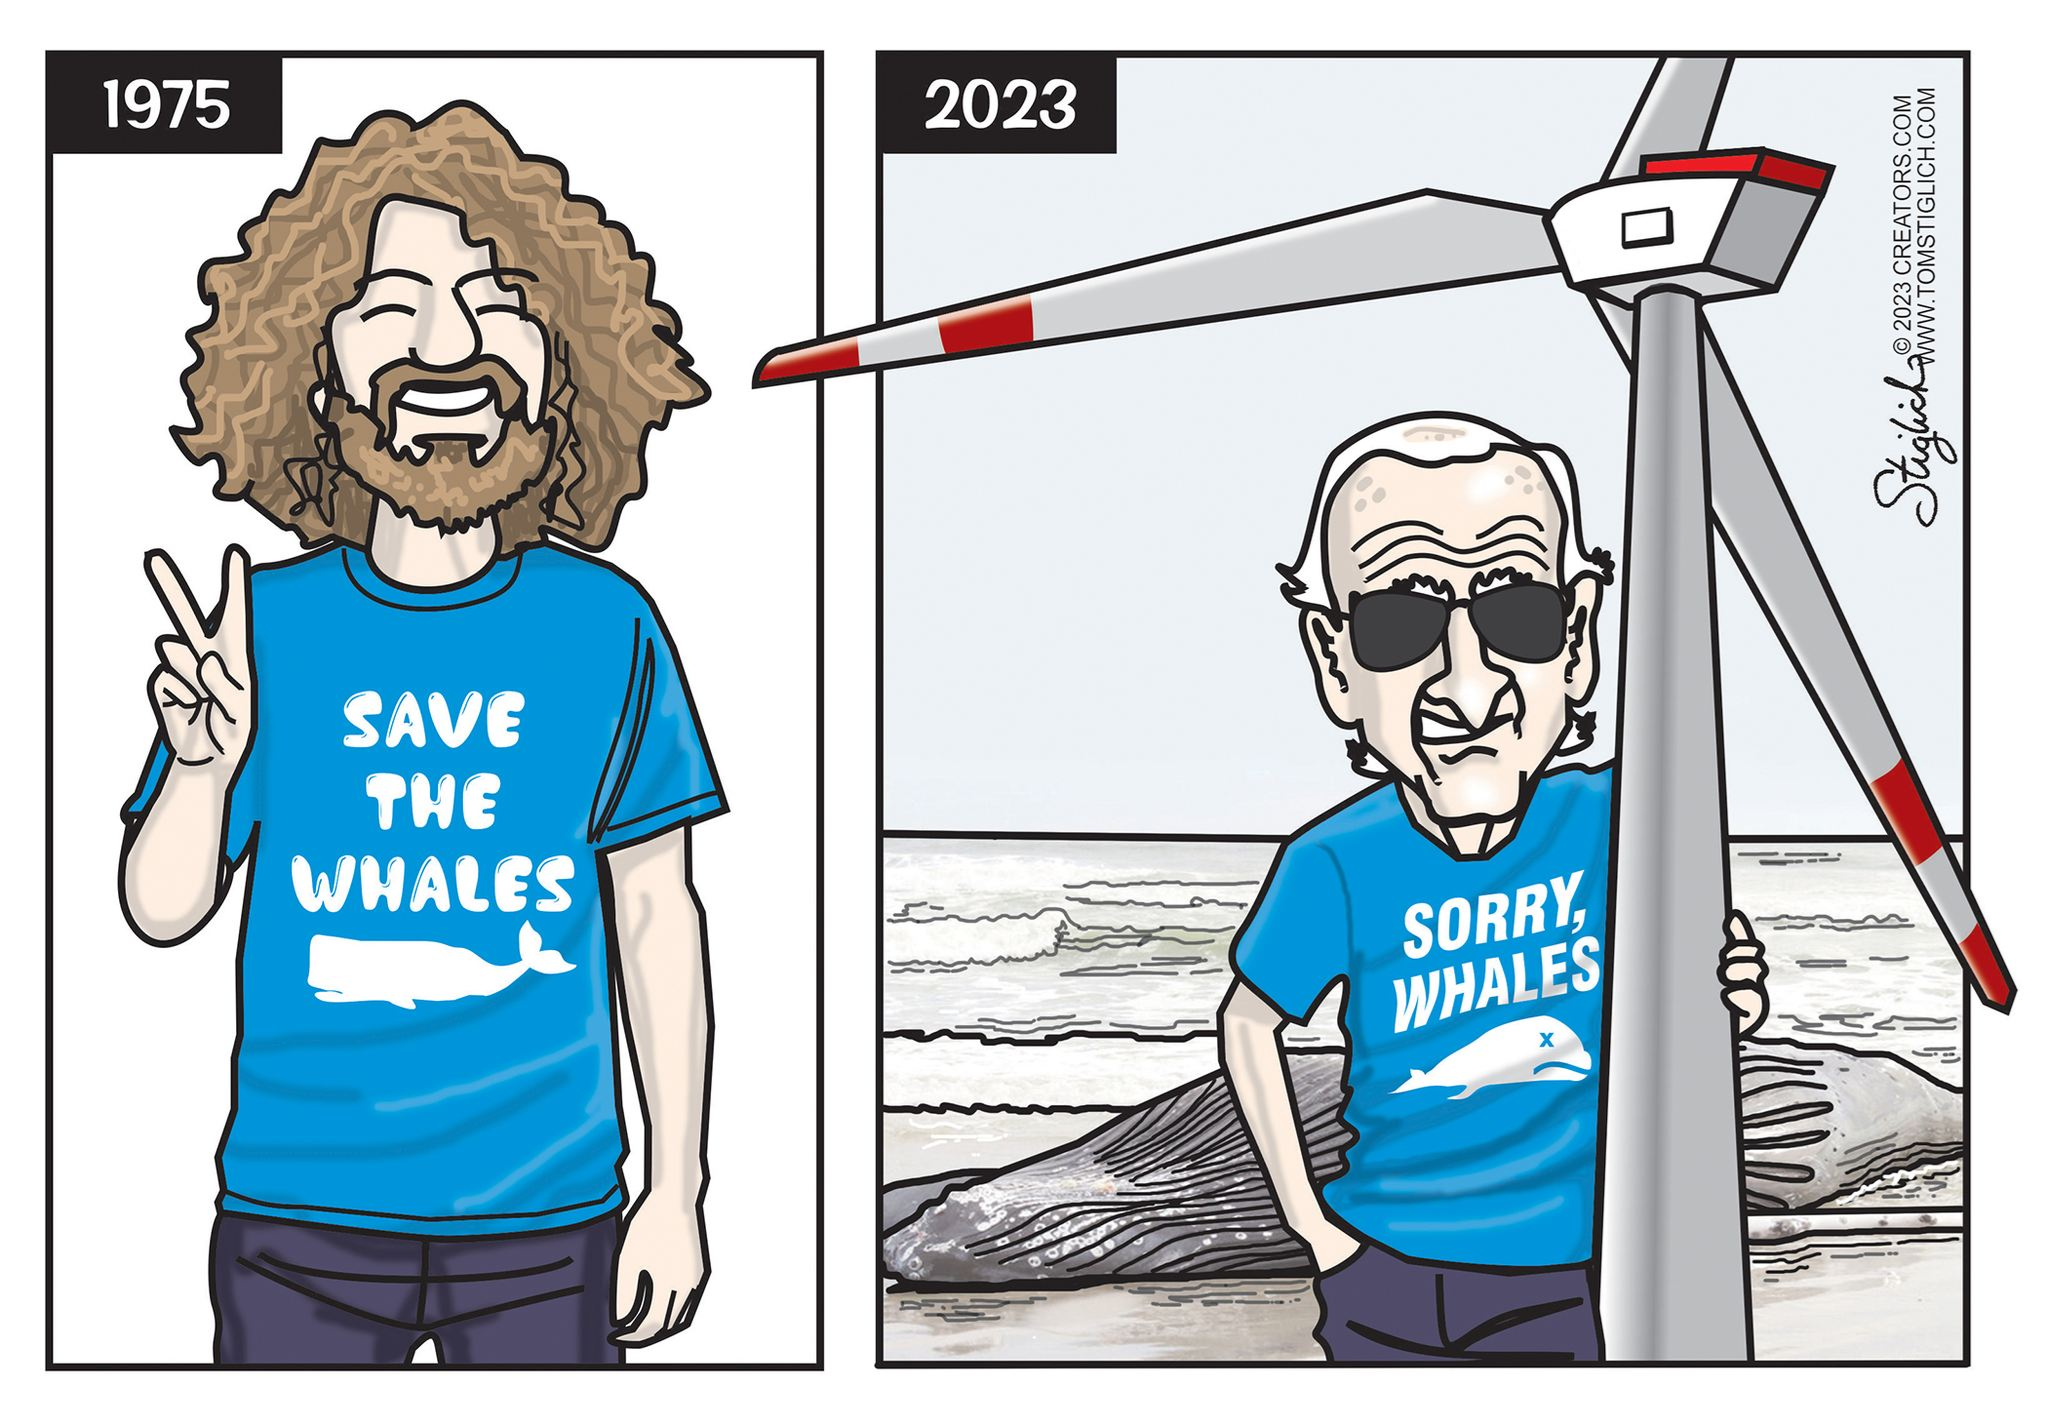
Finally, wind and solar have also been an environmental disaster in terms of great birds, bats, whales and much other marine life killed. Their oversized footprints are made essentially a permanent part of the environment because of the vast amounts of concrete and iron rebar used in their foundations. There are also national security concerns with offshore wind.

We need energy that works. After 20 years of experience,
“all of the above” is just affirmative action for wind and solar energy.

If energy decisions were made on the basis of standard economic merit, like cost and functionality, then oil, gas, coal and nuclear power would win hands down. President Trump occasionally says kind things about solar, but not about wind. He saves his lavish praise and attention for those most deserving: oil, gas and coal.

W. J. Lee expands on this topic in his AMAC article Spain’s Green Energy Blackout Proves Trump is Right about Energy.  Excerpts in italics with my bolds and added images.

Last week’s sweeping blackouts across Spain and Portugal
delivered a stark reminder: energy policy rooted in ideology,
not engineering, has real-world consequences.

Days before the lights went out, Spanish leadership celebrated their power grid’s high reliance on renewables. But when solar and wind faltered—as all intermittent sources eventually do—the system buckled. Their mistake should give Americans added confidence that President Donald Trump’s all-of-the-above energy vision will lead to American energy dominance and dependability.

As large swaths of the Iberian Peninsula went dark, Europe came face-to-face with the instability that results from over-reliance on wind and solar power. The irony? This chaos unfolded on a sunny, wind-swept day—exactly the kind of day when renewables are supposed to dominate.

At the heart of the disruption was a grid built not on resilience, but on fashionable climate politics. Spain’s grid operator reported that just before the outage, solar power provided nearly 60 percent of the country’s electricity. Wind contributed another 9 percent. Together, these intermittent sources accounted for over two-thirds of supply—and when the system folded, it did so calamitously.

Spanish Prime Minister Pedro Sánchez stubbornly holds to the belief that the country’s high reliance on renewable energy had nothing to do with the extensive blackout, but several experts disagree. Leading former International Energy Agency board member Jorge Sanz told the press that the grid did not have enough support from nuclear and fossil fuel power plants to fill in when a sudden drop in power occurred from solar and wind power plants.

André Merlin, a former executive of France’s power grid, warned Europe against following Spain. “We need to be careful about the policy of maximum development and maximum use of intermittent renewable energy to the detriment of more conventional means,” he said.

It’s no coincidence that President Trump’s all-of-the-above energy policy—embracing fossil fuels, nuclear, renewables, and hydro—is giving the economy supreme confidence in our energy future. By diversifying America’s energy mix instead of putting all our eggs in the wind-and-solar basket, Trump ensures stability, affordability, and national security.

In contrast, the European Union is marching toward a self-defeating future where 69 percent of electricity must come from renewables by 2030, regardless of the consequences. Technocrats in Brussels may pat themselves on the back, but grid operators are still scrambling to solve basic technical challenges—like how to keep the lights on when clouds roll in or the wind dies.

One of the key technical problems is the loss of grid “inertia”—the momentum in spinning turbines at coal, gas, and nuclear plants that help stabilize voltage and frequency. When a solar farm goes offline, the output vanishes instantly. There’s no cushion, no time to react. This is precisely the kind of fragility President Trump warned about in 2018 when he pushed back on radical energy mandates and shutdowns of baseload power plants.

British energy expert Professor David Brayshaw of the University of Reading, summed it up: future blackouts will likely become “more significant and widespread” as renewables dominate the grid. Europe is learning that the hard way. Meanwhile, American energy independence—secured under Trump through expanded oil and gas production—offers the flexibility and robustness that Europe sorely lacks.

Back in Spain, grid operator Red Eléctrica wouldn’t say for sure what caused the outage, but all eyes turned to solar. The system collapsed in broad daylight, when solar production was at its peak. Two rapid losses of power—just 1.5 seconds apart—threw the grid into chaos and severed Spain’s connection with the wider European system.

And when it came time to reboot the grid, what energy sources did authorities rely on? Not wind. Not solar. It was hydroelectric and natural gas—energy sources vilified by climate activists but proven once again to be essential. President Trump understands this dynamic and refuses to bow to the environmental lobby’s demand for a total shift to intermittent renewables.

His administration is supporting investment in solar and wind
—when and where it makes sense—
but never at the expense of coal, oil, gas, or nuclear.

That balance, that pragmatism, ensures that America stays competitive, keeps utility bills low, and avoids the kind of disaster Europe just experienced. Spain’s blackout was not the result of a freak accident—it was the predictable outcome of an energy policy that treats physics as optional.

Spain is still moving forward with its plans to shut down its nuclear plants, the most reliable sources of zero-emissions power, and doubling down on wind and solar. That decision defies common sense. Nuclear energy is precisely the kind of carbon-free, high-output technology we should all support—technology that delivers stability and allows us to be good stewards of natural resources.

Europe’s push for a continent-wide “supergrid” is another
green utopian dream not grounded in reality.

The idea is that countries can share power more efficiently—but this past week’s outage rippled through Spain, Portugal, and even parts of France. Interdependence sounds great until a single failure spreads like wildfire.

This blackout should be Europe’s wake-up call. The “transition” they keep touting isn’t a triumph—it’s a gamble, and one that’s starting to cost real people their livelihoods, their travel plans, and their basic security.

Trump will continue to show the world what a sane energy policy looks like: use everything. Don’t demonize fossil fuels that keep the lights on. Don’t shut down nuclear reactors that provide dependable, carbon-free power. Don’t force the economy to depend on whether the sun shines or the wind blows.

As Spain gropes in the dark for answers, one thing is clear: President
Trump’s all-of-the-above approach isn’t just sensible—it is essential.

Beware Renewable Energy Trap

Terry L. Headley exposes the entanglements unheeded by carbon free activists in his Real Clear Energy article The Renewable Energy Trap: A Warning to Nations Pursuing Blind Sustainability  Excerpts in italics with my bolds and added images.

As the world increasingly shifts toward renewable energy, there is a growing risk that nations could fall into the “renewable energy trap.” This trap is the result of embracing an energy transition without fully understanding its economic, environmental, and geopolitical consequences. While renewable energy sources like wind, solar, and hydropower have been hailed as the future of global energy, nations rushing toward these technologies without a strategic plan may face grave economic and security challenges. The truth is that blind adherence to renewable energy, in its current form at least, is not the panacea many believe it to be. In fact, it could prove to be a short, green path to economic ruin for both developed and developing nations alike.

The up front gold is clear and considerable, while the end of the road is in the shadows and uncertain.

The False Promises of Renewables: Hidden Costs and Risks

The promise of renewable energy often comes with an aura of infallibility—clean, green, and limitless. However, this narrative overlooks the hidden costs of transitioning to renewable energy systems, many of which are disguised through misleading claims and incomplete accounting. For example, Germany’s “Energiewende” (Energy Transition) provides a cautionary tale of how well-intentioned policies can lead to unintended consequences.

Germany, once hailed as a leader in the renewable energy revolution, has spent over a decade investing heavily in wind and solar energy. Despite spending billions of euros, Germany has seen little reduction in its greenhouse gas emissions, and the financial burden on consumers has been significant. In 2020, Germany had the highest electricity prices in Europe, largely due to the subsidies and support provided to renewable energy companies. The country’s energy bills for consumers have surged, in part because of the costs associated with maintaining backup fossil fuel plants to ensure grid stability when wind and solar energy are insufficient.

Furthermore, Germany’s renewable energy push has led to a paradoxical reliance on coal. As has been said so many times before, when the wind isn’t blowing and the sun isn’t shining, Germany has been forced to turn back to coal-fired power plants to meet demand. Ironically, this has undermined the very environmental goals the country sought to achieve. Despite Germany’s heavy investment in renewables, it has seen a rise in coal usage due to the intermittent nature of its renewable energy sources, highlighting one of the most significant flaws of a renewable-dominant grid: reliance on fossil fuels to fill in the gaps.

Why? Because Germany must maintain at least as much baseload coal generation in reserve as it has in renewable energy generation to make sure it has electricity available at all times. The reality is that Germans are paying for the same electricity two or three times.

Rising Energy Costs and the Threat of Energy Poverty

The financial burden of renewable energy policies extends beyond Germany, affecting millions of households across the globe. One of the most significant, yet often overlooked, consequences of the renewable energy transition is the rising cost of electricity. The shift toward renewables has caused electricity prices to increase to the point where energy poverty is becoming a real issue in many countries.

Energy poverty refers to the inability of households to afford sufficient energy for heating, cooling, and powering their homes. The International Energy Agency (IEA) defines energy poverty as the lack of access to affordable and reliable energy. As the costs of renewable energy policies continue to rise, more and more households find themselves at risk of falling into energy poverty.

In the United Kingdom, for example, the government’s push for renewable energy has resulted in substantial increases in electricity prices. A report by the UK’s National Grid showed that between 2008 and 2020, the average annual energy bill for a UK household rose by 30%, with a significant portion of the increase attributed to the country’s renewable energy investments. The UK government has heavily subsidized wind and solar energy projects, but those subsidies are paid for by consumers through higher electricity bills. The result has been a situation where millions of British households struggle to keep up with the rising costs of energy.

In California, energy poverty is also on the rise as the state aggressively pursues renewable energy goals. While California has invested heavily in solar power, it has failed to address the intermittent nature of renewable energy. During periods of peak demand, when solar and wind energy are insufficient, the state is forced to turn to natural gas and imported electricity, which drives up costs. California has one of the highest electricity prices in the United States, and many low-income families are feeling the impact.

According to the California Public Utilities Commission, more than 1.3 million households in the state were at risk of energy poverty in 2020. Despite the state’s focus on clean energy, many residents are unable to afford their electricity bills, forcing them to choose between paying for energy or other necessities like food and medicine.

In South Australia, another example of the renewable energy trap is evident. South Australia has aggressively pursued renewable energy policies, becoming one of the leading adopters of wind and solar power in the world. However, this shift has led to significant spikes in electricity prices. The state has faced price volatility and blackouts due to the intermittent nature of renewable energy. In 2017, South Australia experienced a widespread blackout after a storm damaged the transmission network, and the state has since struggled to maintain grid stability. The increased reliance on renewables has led to soaring electricity prices, and many households are now unable to afford basic energy needs. According to the Australian Energy Regulator, electricity prices in South Australia have risen by 50% in the past decade, and many low-income families are feeling the squeeze.

The Geopolitical Trap: Energy Dependency, Raw Materials and National Security

The renewable energy transition also raises important geopolitical concerns, particularly in the area of raw materials. Renewable energy technologies are heavily reliant on rare earth metals, lithium, cobalt, and nickel for the production of batteries, solar panels, and wind turbines. These materials are predominantly sourced from countries with less stable political environments or are monopolized by a few nations, such as China.

This creates a new form of energy dependency. For instance, the global supply chain for lithium and cobalt is largely controlled by China, raising questions about national security and the potential for price manipulation or trade disruptions. Countries that rush toward renewables without developing diversified supply chains may find themselves dependent on a handful of foreign nations for critical materials—echoing the geopolitical vulnerability that oil-dependent countries have faced for decades. This new energy dependence could undermine the goal of energy independence that many nations seek.

Moreover, the mining process for these materials is far from clean or environmentally friendly. In countries like the Democratic Republic of Congo, where much of the world’s cobalt is sourced, mining operations are linked to severe environmental degradation and human rights abuses. The environmental damage associated with mining for lithium, cobalt, and rare earth metals often goes unreported in the “green” narrative surrounding renewable energy. In many cases, the extraction of these materials results in significant water contamination, deforestation, and harmful air emissions.

The Hidden Costs: Economic Burdens and Social Inequality

Another significant issue with the renewable energy push is the way its real costs are hidden from the public. Governments often advertise the economic benefits of renewables without accounting for the financial burden on consumers. The transition to renewable energy technologies often requires substantial government subsidies, which are typically funded by taxpayers or passed onto consumers through higher utility rates. In the case of the European Union, the cost of renewable energy subsidies is often obscured by misleading accounting practices that fail to capture the true cost of maintaining grid stability.

Take California, a state that has aggressively pursued renewable energy initiatives. While solar and wind have gained in popularity, California’s reliance on intermittent renewables has led to skyrocketing energy prices and blackouts. The state has been forced to rely on natural gas plants as backup power sources, creating a contradictory energy system that still depends on fossil fuels. Additionally, the high costs of implementing renewable energy infrastructure have disproportionately affected low-income families, who are unable to afford higher utility bills.

The Crucial Role of Coal-Fired Baseload Electricity

As nations scramble to meet ambitious renewable energy goals, the role of coal-fired baseload electricity cannot be overlooked. Contrary to the widespread narrative that coal is a relic of the past, coal remains the most dependable, affordable, and scalable option for providing stable electricity in an increasingly energy-demanding world.

Baseload electricity refers to the minimum level of demand on an electrical grid over a span of time. Coal-fired power plants are uniquely capable of providing this baseload power reliably. Unlike wind and solar, which are intermittent and weather-dependent, coal-fired plants can produce electricity 24/7, irrespective of external conditions. This ensures a stable and predictable energy supply, crucial for both industrial needs and residential consumption.

Coal is also among the most affordable sources of electricity. The levelized cost of energy (LCOE)—the cost to produce electricity per megawatt-hour—is lower for coal-fired plants than for many renewable alternatives, especially when factoring in the full infrastructure and grid integration costs associated with wind and solar energy. In the U.S., for example, coal remains more cost-effective than natural gas and many renewables, particularly in regions like the Midwest, where the energy grid is more reliant on coal-fired plants.

Moreover, coal is abundant and domestically available in many countries, reducing dependence on foreign energy sources. This enhances energy security, particularly for nations that are trying to avoid the geopolitical risks associated with imported energy, including oil, natural gas, and the rare earth metals required for renewable technologies.

Conclusion: A Balanced Approach, Grounded in Reality is Essential

While renewable energy holds promise for a sustainable future, the world must proceed with caution. Nations cannot afford to fall into the renewable energy trap by embracing these technologies without considering the full spectrum of their impacts. Germany’s experience with its Energiewende shows that pushing too hard for renewables can create new environmental problems, economic burdens, and political risks. A balanced energy strategy that incorporates energy security, economic sustainability, and environmental responsibility is crucial.

Coal-fired baseload electricity remains an essential and reliable component of a balanced energy portfolio. It provides affordable, stable, and secure electricity, ensuring that nations do not risk energy poverty or grid instability as they transition to greener sources. The renewable energy revolution must be a step forward, not a leap into the unknown. By acknowledging the true costs of renewable energy and the irreplaceable role of coal, we can forge a more reliable and sustainable energy future for all.


Update: Congress Enacting Climate Realism

Nico Portuondo reports on progress to enact realistic climate laws in his E&E News article Energy and Commerce unveils broad climate law rollbacks.  Excerpts in italics with my bolds and added images.

The House committee’s portion of the Republicans’ big party-line bill
also includes expedited permitting for gas exports and other projects.

The House Energy and Commerce Committee’s section of the Republicans’ party-line megabill includes billions of dollars in clawbacks from a host of Inflation Reduction Act programs.

The legislation — up for markup Tuesday — would affect the Department of Energy’s Loans Program Office, EPA’s Greenhouse Reduction Fund and many other climate law initiatives, according to text released Sunday night.

Chair Brett Guthrie (R-Ky.) said the climate law repeals would add up to $6.5 billion in savings. He said the unobligated balances represented “the most reckless parts of the engorged climate spending in the misnamed Inflation Reduction Act.”

“The 2024 election sent a clear signal that Americans are tired of an extreme left-wing agenda that favors wokeness over sensible policy and spurs price increases,” Guthrie said in a Sunday Wall Street Journal op-ed.

Guthrie said the administration “has already reversed President Biden and Democrats’ electric-vehicle mandates and natural-gas export ban; now it’s Congress’s turn.”

Guthrie told committee Republicans on a call Sunday that the overall legislation — including changes to Medicaid — would create more than $900 billion in savings, according to POLITICO.

A committee spokesperson said “the bill specifically rescinds funding leftover from nine of the Biden Administration’s IRA renewable energy and electrification subsidy programs at the Department of Energy — saving taxpayers money and allowing for deficit reduction.”

Department of Energy

The legislation would scrap “the unobligated balance” of IRA funding for the Loans Program Office and money dedicated to transmission projects.

The LPO received over $35 billion from the climate law, while DOE’s Grid Deployment Office got around $3 billion as part from the IRA’s “Transmission Facility Financing” section.

Republicans will also try to rescind IRA funds boosting a number of other DOE programs, including initiatives on advanced vehicle manufacturing, energy infrastructure reinvestment financing, tribal energy loan guarantees and state-based efficiency grants. Those programs, in total, received around $8.3 billion from the climate law.

The committee, however, did not make clear just how much leftover funding is available to repeal after the Biden administration pushed to get as much as possible out the door.

Outside of IRA programs, the legislation would accelerate permitting for infrastructure projects through new fees, something similar to the Natural Resources Committee text and what Democrats have called a pay-to-play scheme.

One Energy and Commerce provision, for example, would allow DOE to automatically deem a potential liquefied natural gas export facility to be in the “public interest” — normally a key regulatory hurdle — if the applicant pays a one-time fee of $1 million.

Another provision would allow other natural gas infrastructure developers to receive an “expedited permitting process” from the Federal Energy Regulatory Commission under the Natural Gas Act if the applicants pays $10 million or 1 percent of the project’s projected cost.

The proposal eyes permitting being completed within a year and would exempt projects from certain litigation. A similar timeline and fee would apply to carbon dioxide, oil and hydrogen pipeline permitting.

The legislation would also rescind congressionally appropriated funding outside of the IRA for key DOE programs, including around $401 million from the Office of Energy Efficiency and Renewable Energy and around $260 million from DOE’s State and Community Energy Programs.

It would grant $2 billion for the department to refill the Strategic Petroleum Reserve, a longtime objective of Republicans to shore up the nation’s energy security.

EPA

The bill text confirmed a longtime promise from Energy and Commerce leaders that they would target unobligated balances from the EPA’s Greenhouse Gas Reduction Fund, a $27 billion IRA program designed to support clean energy projects particularly in low-income and disadvantaged communities.

Outside of the Greenhouse Gas Reduction Fund, the plan would repeal a variety of IRA programs designed to reduce air pollution at schools and ports, reduce emissions from diesel engines and construction materials, and promote carbon monitoring initiatives.

And, as expected, the legislation takes aim at the Inflation Reduction Act’s methane fee. That program is designed to reduce methane leaks from natural gas infrastructure. Congress, through the Congressional Review Act, already repealed EPA regulations implementing the fee.

The legislation would also roll back two regulations on emissions from passenger vehicles. Gone would be the latest corporate average fuel economy, or CAFE, standards issued by the National Highway Traffic Safety Administration and EPA’s newest multipollutant emissions standards for model years 2027 and later, requiring significant reductions in greenhouse gas and pollutant emissions from light-duty and medium-duty vehicles.

Republicans went further in their targeting of Biden-era vehicle policies with a proposed repeal of $600 million in grants and rebates to states, municipalities tribes and nonprofits to expand the use of zero-emission vehicles.

See also: 

How To Fix US Energy After Biden Broke It

Wind And Solar Power Both Capricious and Costly

Bill Ponton reminds us that in addition to being fickle, renewables are also costly, in his American Thinker article What are the merits of renewables?  Excerpts in italics with my bolds and added images.

The Spanish blackout made us all aware of how unstable the grid can get when renewables are in the driver’s seat, but one should also not forget that they don’t come cheaply. The idea of getting free energy from wind and solar is inaccurate. Man must build machines to extract energy from nature and those machines, windmills and solar panels, are expensive.

Usually, proponents of renewables point to the fact that once the windmills and solar panels are installed, there is no added cost for fuel. That’s true, but there is more to the story. The capital cost of capacity for onshore wind, solar, and natural gas is $1.7 /MW, $1.3/MW, and $1.2/MW, respectively, a difference, but maybe not what one would call significant.

However, there is a gross disparity between capacity factors for each with 31% for wind, 20% for solar, and 60% for natural gas, as evidenced by the figures from Texas grid operator, ERCOT, in 2023. The capacity factor is a measure of how effectively a power plant or energy-producing system is operating compared to its maximum potential output over a specific period (Capacity Factor = Actual Output / Maximum Possible Output).

It should be said that a capacity factor of 60% for natural gas is what one would expect if the operator were only dependent upon natural gas. The current situation where natural gas generation is used to backup solar and wind generation drives the capacity factor for natural gas generation down to 36%.

With these lower capacity factors, one gets a cost multiple
of over 1.5 times greater to operate a mixed energy system
versus a system with just natural gas.

My calculations are here for all to examine. Another way to look at it is that the price of natural gas would have to go up by a factor of five (x5) to make the combined system with wind, solar, and natural gas cost competitive against a system with natural gas alone. Although Texas has a lot to brag about, its use of multiple energy sources to power its grid is not one of them. Why would one expect any other result from a scheme that requires massive subsidies, mandates, and tax breaks to even exist?

So, if renewables are unreliable and expensive, who finds them appealing? The answer is folks that are so guilt-ridden about their role in a supposed climate catastrophe that they will grab on to any scheme that offers them absolution, whether it has merit or not.


Oceanic Warming in Two Bands, NH and SH

Chart shows two red heating bands, one in the northern hemisphere and one in the south. A more variable area including high temperatures lies between the two bands.

A paper analyzing changes in Ocean Heat Content (OHC) since 2000 was published at University of Auckland, summarized here:  Unexpected ocean heat patterns show NZ in extreme zone.  Excerpts in italics with my bolds and added images.

The world’s oceans are heating faster in two bands stretching around the globe and New Zealand is in one of them, according to new research led by climate scientist Dr Kevin Trenberth.

In both hemispheres, the areas are near 40 degrees latitude. The first band at 40 to 45 degrees south is heating at the world’s fastest pace, with the effect especially pronounced around New Zealand, Tasmania, and Atlantic waters east of Argentina.  The second band is around 40 degrees north, with the biggest effects in waters east of the United States in the North Atlantic and east of Japan in the North Pacific.

“This is very striking,” says Trenberth, of the University of Auckland and the National Center of Atmospheric Research (NCAR) in Boulder, Colorado. “It’s unusual to discover such a distinctive pattern jumping out from climate data,” he says. “What is unusual is the absence of warming in the subtropics, near 20 degrees latitude, in both hemispheres.”

The heat bands have developed since 2005 in tandem with poleward shifts in the jet stream, the powerful winds above the Earth’s surface that blow from west to east, and corresponding shifts in ocean currents, according to Trenberth and his co-authors in the Journal of Climate.

Besides the two key zones, sizeable increases in heat took place in the area from 10 degrees north to 20 degrees south, which includes much of the tropics. However, the effect was less distinct because of variations caused by the El Niño-Southern Oscillation climate pattern, Trenberth says.

The scientists processed an “unprecedented” volume of atmospheric and ocean data to assess 1 degree latitude strips of ocean to a depth of 2000m for the period from 2000 to 2023, Trenberth says. Changes in heat content, measured in zettajoules, were compared with a 2000-04 baseline.

The AMS paper is Distinctive Pattern of Global Warming in Ocean Heat Content by Trenberth et al (2025). Excerpts in italics with my bolds and added images.

Fig. 1. (left) Global mean OHC (Cheng et al. 2024a) for 0–2000 m relative to a base period 1981–2010 (ZJ). The 95% confidence intervals are shown (sampling and instrumental uncertainties). (right) Trend from 2000 to 2023 in OHC for 0–2000 m (W m−2). The stippled areas show places where the trend is not significant at the 5% level.

The focus of this paper is from 2000 through 2023, as 2000 is when reliable TOA radiation data became available. Accordingly, the OHC for the 0–2000-m depth is shown not only for the global mean but also as spatial trends over the 2000–23 period (Fig. 1); see methods in section 2. The global values from 1980 show increased confidence after 2005 or so, when Argo data became available globally (Cheng et al. 2017, 2024b). The spatial patterns of trends are of considerable interest because, although the ocean is warming nearly everywhere, by far the greatest increases are in the midlatitudes: in western boundary currents east of Japan in the Kuroshio Extension region of the Pacific and in the Gulf Stream extension in the Atlantic, and nearly everywhere from 35° to 50°S in the Southern Hemisphere (SH). Wu et al. (2012) earlier noted that the warming rate in subtropical western boundary currents in all ocean basins far exceeds the globally averaged surface ocean warming rate. Of particular interest is why the midlatitudes are warming the most.

Conclusions

Heating in the climate system from 2000 to 2023 is most clearly manifested in zonal mean OHC for 0–2000-m depth. It occurs primarily in the top 300 m and is evident in SSTs. The SST changes emphasize surface warming in the NH, but the strongest energy increases are in the SH, where ocean area and volume are greater. In the NH, heating occurs at all latitudes in the Atlantic with some modulation and slightly reduced MHT from the south, but in the North Pacific, strong warming near 40°N is countered by cooling near 20°N. The zonal mean across all oceans is more robust than a focus on any particular ocean basin.

Estimates of TOA radiation, atmospheric energy transports, surface fluxes of energy, and redistribution of energy by surface winds and ocean currents reveal that the patterns of OHC warming are mostly caused by systematic changes in the atmospheric circulation, which alters ocean currents. The coupled atmospheric changes have resulted in a striking pattern of changes in the vertically integrated atmospheric energy divergence which is strongly reflected in surface wind stress and anomalous net surface heat fluxes into and out of the ocean.

In response to the wind changes, the ocean redistributes heat meridionally, especially in western boundary currents in the NH. Hence, the patterns are not directly related to TOA radiation imbalances but arise primarily from coupled atmosphere–ocean changes. In turn, those influence storms and cloudiness, and thus TOA radiation. Changes in atmospheric aerosols and associated clouds may have played a role in the North Pacific and North Atlantic, likely in amplifying SST anomalies, although, because land is warming a lot more than the oceans, advection of warmer air from continents over the northern oceans may also be in play.

In the NH, changes are associated with the western boundary currents, but the associated atmospheric changes require analysis of more than a zonal mean framework, as continents play a major role. Nonetheless, it is clear that the atmosphere and ocean currents are systematically redistributing heat from global warming, profoundly affecting local climates.

My Comment:

The final sentence read literally refers to heat released by oceanic activity under the influence of solar radiation and atmospheric circulations such as jet streams.  However, the term “global warming” can taken by some to mean planetary higher temperatures due to humans burning hydrocarbons.  The leap of faith to attribute human agency to natural processes serves an agenda against society’s traditional energy platform.

Further, the graph showing zettajoules can be misleading.  Ocean heat graphs labelled in Zettajoules make it look scary, but the actual temperature changes involved are microscopic, and impossible to measure to such accuracy in pre-ARGO days.

Since 2004, for instance, ARGO data shows an increase of about two hundredths of a degree.


Arctic Ice: All’s Well Ending April 2025

NOAA refers to the Month end Arctic ice extent by averaging the last five days extents.  Thus monthly gains and losses of ice can be obtained by subtracting the previous month end ice amount.  The chart above shows the April month end Arctic ice extents since 2007, comparing the two relevant datasets: Sea Ice Index (SII, based on satellite microwave sensors) and Multisensor Analyzed Sea Ice Extent (MASIE, based on multiple sources including several satellite sensors and visual analysis).

A sine wave pattern is evident starting after the low 2007 extent, rising to a peak in 2012, declining to 2019, before returning to the mean the last four years.

After a sub-par March maximum, now in April, 2025, Arctic ice has closed the gap with the 19-year average.

During April the average year loses 1.1M km2 of ice extent.  Meanwhile 2025 lost only 0.538 M km2, about half as much.  The end result is MASIE showing a slight deficit and SII a small surplus at end of April.

The regional distribution of ice extents is particularly revealing, as shown in the table below.

Region 2025120 Day 120 Ave. 2025-Ave. 2007120 2025-2007
 (0) Northern_Hemisphere 13428208 13510326 -82118 13108068 320140
 (1) Beaufort_Sea 1071001 1068240 2761 1059189 11811
 (2) Chukchi_Sea 963094 957153 5942 949246 13848
 (3) East_Siberian_Sea 1087137 1085746 1391 1080176 6961
 (4) Laptev_Sea 893105 891206 1899 875661 17444
 (5) Kara_Sea 927530 915007 12523 864664 62866
 (6) Barents_Sea 563013 552738 10275 396544 166470
 (7) Greenland_Sea 703059 661036 42023 644438 58621
 (8) Baffin_Bay_Gulf_of_St._Lawrence 1129634 1194283 -64650 1147115 -17481
 (9) Canadian_Archipelago 854878 849548 5330 838032 16846
 (10) Hudson_Bay 1249532 1238910 10622 1222074 27458
 (11) Central_Arctic 3244486 3231137 13349 3241034.13 3452
 (12) Bering_Sea 441499 477412 -35913 475489 -33990
 (13) Baltic_Sea 11180 21561 -10382 14683.79 -3504
 (14) Sea_of_Okhotsk 287204 363423 -76219 295743 -8539

The table shows only three significant deficits to average; Okhotsk is -72k km2, and Bering adds -40k, together greater than the overall -82k km2, which is 0.6% below average.  The other deficit in Baffin Bay is  offset by surpluses in nearly every other Arctic basin with the exception of Baltic Sea. Clearly the core Arctic ocean is solidly frozen, with a few fringe seas going to open water slightly ahead of schedule.

Why is this important?  All the claims of global climate emergency depend on dangerously higher temperatures, lower sea ice, and rising sea levels.  The lack of additional warming prior to 2023 El Nino is documented in a post March 2025 UAH Yo-yo Temps.

The lack of acceleration in sea levels along coastlines has been discussed also.  See Observed vs. Imagined Sea Levels 2023 Update

Also, a longer term perspective is informative:

post-glacial_sea_level