Why Dislike Solar Power

Post on X by Chris Martz. In italics with my bolds and added images.

Why do I dislike solar so much? Because solar farms are a giant waste of land and natural resources. Let’s do some math.

To replace now closed Indian Point nuclear power plant would
require covering Albany county with solar panels.

A single 1,000-megawatt (MWe) nuclear reactor occupies ~1 mi² (640 acres) of land. Nuclear also has a capacity factor of 0.923, meaning a reactor will generate ~92.3% of the maximum theoretical amount of electrical energy in a year that it could have.

https://energy.gov/ne/articles/what-generation-capacity Thus, a 1,000-MWe reactor will produce ~8.08 terawatt-hours (TWh) of electricity per year, enough to power over 770,000 homes throughout the course of a year (assuming Americans purchase an average of 10.5 MWh per household per year).

🏠💡= [1,000 MW × (24 hours / day) × (365 days / year) × 0.923] / 10.5 MWh ≈ 770,046 homes On the contrary, a solar photovoltaic (PV) farm requires 5-10 acres per MW (we’ll assume an average of 7.5) Solar PV has a capacity factor of 0.234. Thus, a 1,000-MWe solar farm occupies ~7,500 acres of land, but it would only power ~195,223 homes assuming, once again, Americans purchase 10.5 MWh of electricity per year, on average.

🏠💡= [1,000 MW × (24 hours / day) × (365 days / year) × 0.234] / 10.5 MWh ≈ 195,223 homes So, you’d need ~4,000 MWe of installed solar capacity to power the same number of homes as a single 1,000 MWe nuclear power station, and ~46.2× the land area, not including the land required for enough battery storage. But, it gets even worse if you factor the battery storage required. Solar PV’s average output is 234 MW.

🔅= 1,000 MW × 0.234 = 234 MW per hour OR 5,616 MWh per day OR 39,312 MWh per week For a week’s worth of battery backup, it would require an additional 23,587.2 acres of land (assuming battery storage requires 0.6 acres /

Rooftop solar is fine. Installing it on the roofs of homes, stores, warehouses, etc. can be useful. But, doing this is not.

Snow covered solar panels at University of MIchigan.

See Also

“Fire, Fire, Read All About It!” or Not.

Linnea Lueken writes at Climate Realism Stop Promoting Attribution Studies, Associated Press, Europe’s Wildfires Aren’t Worsening.  Excerpts in italics with my bolds and added images.

The Associated Press (AP), via ABC News, claims that climate change is responsible for the intensity of European wildfires in a story titledClimate change made deadly wildfires in Turkey, Greece and Cyprus more fierce, study finds.” This is false.

Data show no long-term trend of increasing wildfires in any of the countries listed,
and overall global wildfire data shows declining fire extent.

The AP cites a non-peer reviewed report by World Weather Attribution (WWA) to claim that climate change was responsible for necessary conditions, specifically, hot and dry weather, which drove the widespread wildfire outbreaks in Turkey, Greece, and Cyprus, and made them “burn much more fiercely.”

The story and the report it relies upon are suspect from the start. First, as discussed by Climate Realism previously, as a matter of geography the climate of the Mediterranean region is naturally arid, prone to drought, extreme heat, and associated wildfires. Fire helped shape the ecology of the entire region. Some past fires have been huge. For instance, more than 112 years of global warming ago, when global average temperatures were cooler and humans weren’t contributing significantly to atmospheric carbon dioxide levels, the great Thessaloniki fire burned for 13 days. It left more than 70,000 people homeless, and destroyed two-thirds of Greece’s second largest city.

So hot and dry weather is the norm for the Turkey, Greece, and Cyprus,
especially during the summer, rather than being unusual weather conditions.

The AP ignores this fact about the region’s climate. It also did not critically assess WWA. The AP portrays WWA an unbiased “group of researchers that examines whether and to what extent extreme weather events are linked to climate change.” But this is false. The entire reason for WWA’s existence is specifically to “attribute” extreme weather events to human-caused climate change, in part to provide material that can be used in lawsuits filed against governments and the fossil fuel industry. The WWA believes the U.N. Intergovernmental Panel on Climate Change’s data driven approach to understating the causes of extreme weather is far too cautious when it comes to attribution. WWA produces studies on the assumption that climate change caused or contributed to an extreme event, the only real question being how much more likely was the event to occur, or how much more severe was the event, than it would have been absent human fossil fuel use.

That is the fallacy of affirming the consequent
or assuming what you are attempting to prove.

In this case, WWA claimed the fires were “22% more intense in 2025, Europe’s worst recorded year of wildfires.” This claim is unverified and misleading, at best. The Mediterranean region the AP discusses is not all of Europe, and it was not that regions worst year of wildfires.

It is worth noting that WWA seems to only attribute extreme weather
to climate change, never mild or good weather.

WWA specifically identifies its goal as increasing the “immediacy of climate change, thereby increasing support for mitigation.” Climate Realism has explained at length why single event attribution is scientifically misleading and unreliable at best in past articles, and we’ve specifically refuted flawed WWA reports previously dozens of times, herehere, and here, for example.

This year may well be a record fire year for parts of Europe and Asia, but only a sustained trend of worsening fires would prove that they were driven by climate change.

No such trend exists, globally or in the individual countries mentioned.

Looking at the most recent available data from the joint collaborative project between NASA and the European Space Agency, Copernicus, for each country we can see the wildfire trends are far from consistent.

First we have Turkey:

If anything, this trend shows that wildfires have been trending down since 2009’s peak over Copernicus’ period of record.

Next, Greece:

Again, no real long term consistent trend.

Finally Cyprus:

Again, particularly in the case of yearly burned area, there is no consistent trend in wildfire data for Cypress, and a possible overall decline in the yearly number of fires.

Downward or flat trends can’t honestly be portrayed as increasing trends.

Although global wildfire data also is spotty for long-term trends, what data exists consistently suggest a declining global trend. NASA data shows a global decline in acreage lost to wildfire since 2003.

Extreme weather event attribution studies, produced rapidly
in hours after a natural disaster strikes, aren’t vetted science.

Still, they are eagerly accepted as evidence of climate impacts by the alarmist media. This is absurd when any credible fact checker, editor, or investigative journalist could easily access publicly available data that devastates the climate change linkage at the core of the story. One would hope that the Associated Press’ writers are gullible or naïve, but even taking that charitable view, the lack of basic research is inexcusable for any journalistic outlet. One reason to doubt the charitable belief in how so many false climate tales are spun out of the AP is that the stories are all biased in the same direction of climate alarm – climate change is never not to blame – and that the AP’s climate coverage is specifically funded by foundations and non-profit organizations who have long pushed climate alarm.

Surplus Arctic Ice Persists to End of August 2025

After a sub-par March maximum, by end of May 2025 Arctic ice closed the gap with the 19-year average. Then in June the gap reopened and in July the melting pace matched the average, abeit four days in advance of average. In mid-August MASIE showed the Arctic ice extent matching the 19-year average.  Mid month Arctic ice went above average and remained in surplus, ranging from a high of +231k km2 to +160k km2 at end of August.

During August the average year loses 1.9M km2 of ice extent.  MASIE on day 213 was 308k km2 down, and the gap closed steadily, going into surplus on day 230. Note 2020 and 2024 were well  below average mid-August.  2024 ended nearly average, while 2020 went down almost off the chart. Meanwhile SII v.4 started August ~400k km2 lower than MASIE, increasing to -690k mid month, before drawing closer to MASIE (-200k km2) on the last reported day 242. More on what happened to SII in footnote.

The regional distribution of ice extents is shown in the table below. (Bering and Okhotsk seas are excluded since both are now virtually open water.)

Region 2025243 Day 243 Ave. 2025-Ave. 2020243 2025-2020
 (0) Northern_Hemisphere 5112372 4952249 160123 4345398 766974
 (1) Beaufort_Sea 646546 569909 76637 763281 -116735
 (2) Chukchi_Sea 400517 284622 115895 212438 188079
 (3) East_Siberian_Sea 563058 360155 202902 176996 386062
 (4) Laptev_Sea 172574 175114 -2540 1029 171545
 (5) Kara_Sea 2579 48983 -46404 23958 -21379
 (6) Barents_Sea 0 15952 -15952 0 0
 (7) Greenland_Sea 106688 167723 -61035 192361 -85673
 (8) Baffin_Bay_Gulf_of_St._Lawrence 61034 27656 33378 5016 56019
 (9) Canadian_Archipelago 278943 298169 -19226 273116 5827
 (10) Hudson_Bay 8604 20611 -12006 23611 -15007
 (11) Central_Arctic 2870279 2982526 -112247 2672903.81 197375

The table shows large surpluses in Eurasian basins  Beaufort, Chukchi and E. Siberian, more than offsetting deficits in Central Arctic, Kara and Greenland seas. Hudson Bay is mostly open water at this time of year. 2025 exceeds the average ice extents by 160k km2, or 3%, and is 767k km2 greater than 2020, or nearly 0.8 Wadhams of ice extent.

September monthly average ice extent is considered the annual minimum for climate purposes.  Note also that typically the lowest daily value occurs mid September, with a small positive gain between the end of August and end of September.

Why is this important?  All the claims of global climate emergency depend on dangerously higher  temperatures, lower sea ice, and rising sea levels.  The lack of additional warming prior to 2023 El Nino is documented in a post SH Drives UAH Temps Cooler July 2025.

The lack of acceleration in sea levels along coastlines has been discussed also.  See Observed vs. Imagined Sea Levels 2023 Update

Also, a longer term perspective is informative:

post-glacial_sea_level

Footnote Regarding  SII v.4

NSDIC acknowledged my query regarding the SII (Sea Ice Index) dataset. While awaiting an explanation I investigated further. My last download of the SII Daily Arctic Ice Extents was on July 30, meaning that the most recent data in that file was day 210, July 29. The header on that file was Sea_Ice_Index_Daily_Extent_G02135_v3.

Then on August 1, the downloaded file had the heading Sea_Ice_Index_Daily_Extent_G02135_v4. So it appears that these are now the values from a new version of SII. As I wrote in my query, since March 14 all of the values for Arctic Ice Extents are lower in this new record. The graph above shows the implications for August as an example of estimates from SIIv.4.

In the past, SIIv.3 tracked MASIE with slightly lower values.  But with v.4, larger monthly average deficits to MASIE were reported in July 2025 ( -282k km2) and in August (-440k km2).

The change started in January 2025 and will be the basis for future reporting.  The logic for this is presented in this document: Sea Ice Index Version 4 Analysis

In June 2025, NSIDC was informed that access to data from the Special Sensor Microwave
Imager/Sounder (SSMIS) onboard the Defense Meteorological Satellite Program (DMSP)
satellites would end on July 31 (NSIDC, 2025). To prepare for this, we rapidly developed version
4 of the Sea Ice Index. This new version transitions from using sea ice concentration fields
derived from SSMIS data as input to using fields derived from the Advanced Microwave
Scanning Radiometer 2 (AMSR2) sensor onboard the Global Change Observation Mission – W1
(GCOM-W1) satellite.  On 29 July 2025, we learned that the Defense Department decision to terminate access to DMSP data had been reversed and that data will continue to be available until September 2026.

We are publishing Version 4, however, for these reasons:

• The SSMIS instruments are well past their designed lifespan and a transition to
AMSR2 is inevitable. Unless the sensors fail earlier, the DoD will formally end the
program in September 2026.
• Although access of SSMIS will continue through September 2026, the Fleet
Numerical Meteorology and Oceanography Center (FNMOC), where SSMIS data
from the DMSP satellite are downloaded, made an announcement that “Support
will be on a best effort basis and should be considered data of opportunity.” This
means that SSMIS data will likely contain data gaps.
• We have developer time to make this transition now and may not in the future.
• We are confident that Version 4 data are commensurate in accuracy to those
provided by Version 3.

Noble Climate Cause Corruption: PIK exemplar

Thomas Kolbe explains the sordid history in his American Thinker article Potsdam climate researchers under fire. Excerpts in italics with my bolds and added images.

Critics of climate policy have long pointed to the problematic dominance of politics in climate science. A recent study from the Potsdam Institute for Climate Impact Research (PIK), which systematically exaggerated the economic consequences of climate change, has reignited the debate over scientific standards and political manipulation in the field.

On April 17, 2024, the science journal Nature published a study by PIK researchers Maximilian Kotz, Anders Levermann, and Leonie Wenz. They calculated that global GDP would shrink by 19% by 2050 due to climate change, regardless whether future emissions were reduced. This projection corresponds to an annual output loss of around $38 trillion — an economic apocalypse, given that no society has the resilience to absorb such a dramatic collapse.

A Solution Delivered Alongside the Doom

The authors also provided a ready-made “solution”: according to their math, the costs of climate damage would be at least six times higher than the expenses required to keep global warming below 2°C. The implication is clear:

This was less a scientific exercise than a political directive for policymakers
to accelerate the fight against alleged man-made climate change.

A year later, the material was “corrected” and republished with slightly toned-down results. The timing was not coincidental: peer review — the scientific quality control process — loomed in the background and threatened to spark controversy.

Peer Review Delivers a Devastating Blow

That controversy soon arrived. Three U.S.-based scientists who reviewed the PIK paper identified serious methodological flaws and faulty data — problems that had been known for over a year. According to their report, PIK’s methodology had no scientific foundation. One reviewer wrote: “I have major concerns about the uncertainty and validity of the empirical model they built and used for the forecasts. It would help this study not to follow the often-exaggerated claims found in the literature.” From the Abstract of paper  by Bearpark et al (link in red above):

Kotz, Levermann and Wenz1 (henceforth, KLW) analysed how subnational gross domestic product (GDP) growth responds to year-to-year changes in temperature and precipitation. They reported that if historical relationships continue to hold, global GDP would be lowered by roughly 62% (central estimate) in 2100 under the Representative Concentration Pathway 8.5 ‘high emissions’ scenario, an impact roughly 3 times larger than similar previous estimates,2,3. Here we show that (1) data anomalies arising from one country in KLW’s underlying GDP dataset, Uzbekistan, substantially bias their predicted impacts of climate change, (2) KLW underestimate statistical uncertainty in their future projections of climate impacts, and (3) additional data-quality concerns in KLW’s subnational GDP data warrant further investigation. When Uzbekistan’s data are removed and statistical uncertainty is corrected to account for spatial correlations, KLW’s central estimate aligns closely with previous literature and their results are no longer statistically distinguishable from mitigation costs at any time this century.

Such devastating words cast doubt not just on PIK’s work, but on the broader foundations of climate science itself. Yet papers like this are routinely used to justify green transformation policies, with their web of subsidies, NGOs, regulations, and deep intrusions into economic life.

Finance Dragged Into the Climate Matrix

The significance of this critique lies not only in the study’s flaws but also in the murky financing behind it. These alarmist reports are not just shaping public opinion; they are the cornerstone of a new “climate economy.” The goal is to channel capital flows so that state funds and private wealth are merged into politically favored projects — a carefully orchestrated fusion of financial power and ideology.

International organizations and political institutions amplify these narratives, embedding them into economic governance. The “Network for Greening the Financial System” (NGFS) — closely tied to PIK and consisting of central banks and regulators — projects future climate costs and uses them as a basis for political and financial decisions. The European Central Bank relies on such scenarios for stress tests on banks, forcing higher capital buffers and restricting lending — with direct consequences for growth.

Networks, Obfuscation, and Propaganda

Additional funding flows through organizations like Climate Works, which bankrolls both NGFS and PIK while paying for the calculation of key scenarios. This blurring of lines between sponsor and reviewer, between science and political agenda, opens the door to propaganda. Genuine public debate becomes nearly impossible under such conditions of institutionalized opacity.

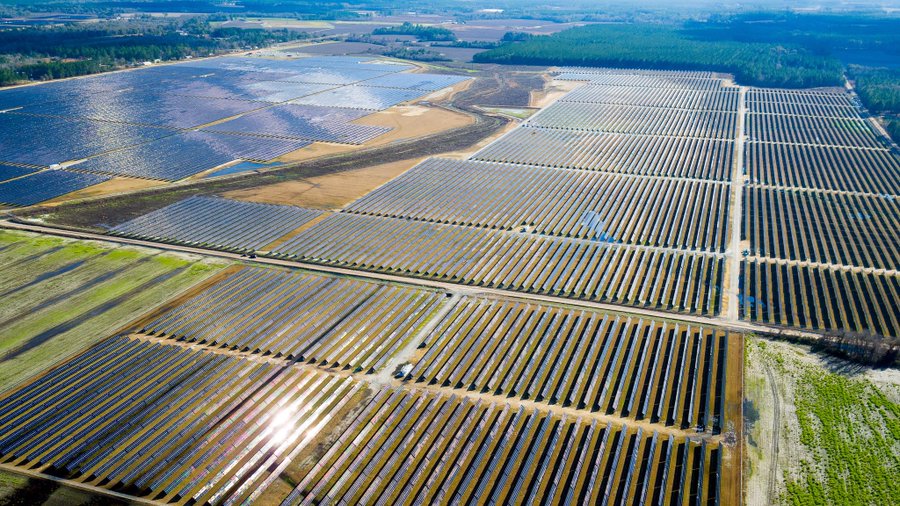
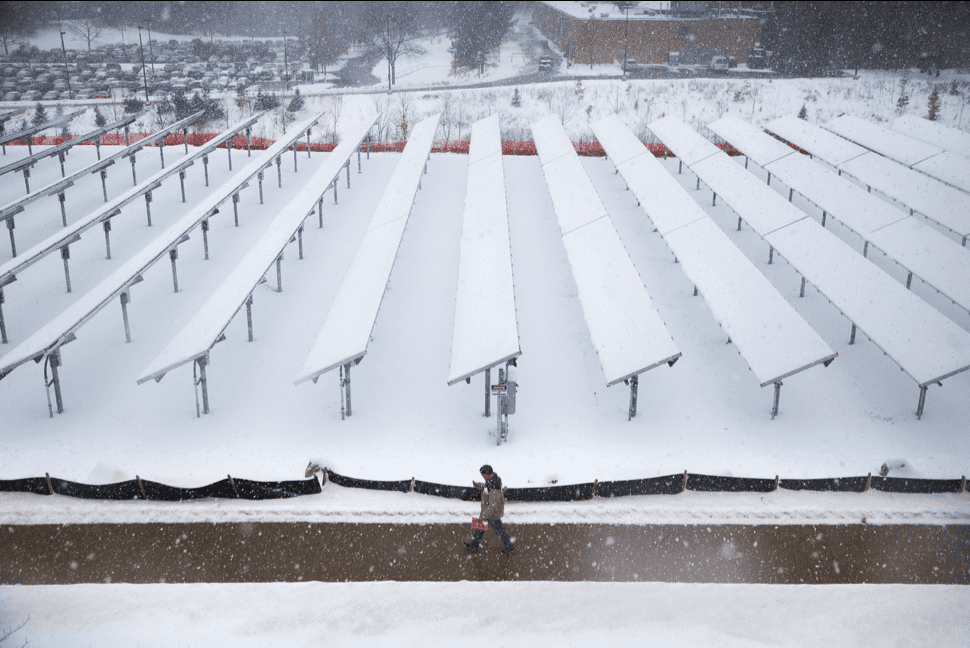
The end result is soulless landscapes scarred by wind turbines, the shutdown of modern power plants, and intrusive state regulation extending into private households. The energy sector is sacrificed, home ownership turned into an ideological experiment — all justified by the apocalyptic narrative of man-made climate collapse.

The Origins of CO2 Politics

The roots of this orthodoxy can be traced back to 2009, when the Obama administration declared CO2 a “dangerous pollutant” via the EPA’s Endangerment Finding. This politically-driven decision, made without congressional approval, laid the groundwork for carbon pricing, emissions trading, and sweeping regulatory interventions.

Europe embraced the same model, perhaps even spearheaded it. As an energy-poor continent, the EU saw an opportunity: by making fossil fuels expensive and heavily regulated, it could level the playing field and prevent resource-rich competitors from exploiting their natural energy advantages.

Donald Trump briefly broke with this orthodoxy, scrapping central EPA rules, declassifying CO2 as an existential threat, and freeing coal, gas, and oil. It was a signal to the world: growth and sovereignty take precedence over panic-driven climate politics.

Politicized Science

The PIK case highlights the dangers of academia’s fusion with state agendas. The old saying applies: “Whose bread I eat, his song I sing.” It was only a matter of time before such politically tailored studies surfaced.

Just as with government-influenced modeling during the COVID crisis, climate research now faces the urgent task of disentangling politics from science. On the back of the man-made climate narrative, an entire apparatus of subsidies, NGOs, and Brussels bureaucracy has entrenched itself. Untangling this nexus is no longer just a scientific issue — it is a historic necessity.

Footnote On the Failings of PIK GDP Study

Climate study from Potsdam – how questionable forecasts misled politics and business

A controversial climate study by the Potsdam Institute for Climate Impact Research (PIK) is one of the biggest scientific scandals of recent years. Media outlets like “Tagesschau” and “Spiegel” made it headlines in 2024. “Scientifically completely invalid,” economist Richard Rosen declared. However, politicians and the financial world made far-reaching decisions based on the PIK study. The alleged annual economic damage of $38 trillion shaped global debates. (welt: 25.08.25)

The publication of the PIK study by “Nature” lent its brilliance. But internal documents show that all four reviewers reported serious deficiencies. One expert wrote: “The statistical methodology … [has] no scientific basis whatsoever.” Another emphasized that the forecasts seemed “unintuitively large.”

Roger Pielke Jr. calls it a scandal. Incorrect figures have been known for over a year, yet they continue to shape climate policy and financial decisions. Weinkle criticizes that “Nature” has “turned into a doormat.” This is how science loses credibility.

Just a few weeks after publication, Christof Schötz of the Technical University of Munich presented a detailed critique. He made it clear that the results “do not provide the robust empirical evidence required for climate policy.” Nevertheless, Nature suppressed the analysis for months.

Other researchers from Princeton and the Bank Policy Institute responded. Gregory Hopper describes his unsuccessful attempts to submit comments. Rosen described the PIK study as “completely scientifically invalid.” It has since become clear that while the criticism was suppressed, the NGFS continued to use the data. This resulted in massive economic and political damage.

Under pressure, the PIK researchers published a new version. In this “preprint,” they claimed their core findings remained intact. However, they had to swap methods to produce similar results. For Pielke, this is “a tacit admission… that the original analysis is no longer valid.”

Hopper is even more critical of the new version. “The revised climate damage model is even more flawed,” he explains. The statistical problems persist. This demonstrates that science is serving politics here rather than providing objective results.