
Gianluca Alimonti, MS Physics, professor and senior researcher, University of Milan
Chris Morrison reports at Daily Sceptic Retracted by Nature, Traduced by Michael Mann – Gianluca Alimonti is Back and He’s Taking No Prisoners. Excerpts in italics with my bolds and added images.
I’m calling it the ‘Revenge of Alimonti’. In 2023 a group of activists including ‘hockey stick’ inventor Michael Mann, Attribution Queen Frederike Otto and Marlowe Hood and Graham Readfearn from AFP and the Guardian respectively managed to get a paper led by Professor Gianluca Alimonti retracted by Nature because it had spoken the obvious truth that there was little scientific evidence that extreme weather events were getting worse.
It was the high point of ‘settled’ science, a time when it was acceptable
to trash the cherished free speech principles of the scientific process.
But as the Net Zero fantasy starts to collapse and most of the shonky science backing it is facing increasing ridicule, Alimonti 2 is back, bigger and better. In his latest paper on the non-existent climate ‘crisis’, he shows there has been no statistically worsening trends of climate impacts. Indeed there have been many improvements in humans adapting to whatever nature has thrown at them
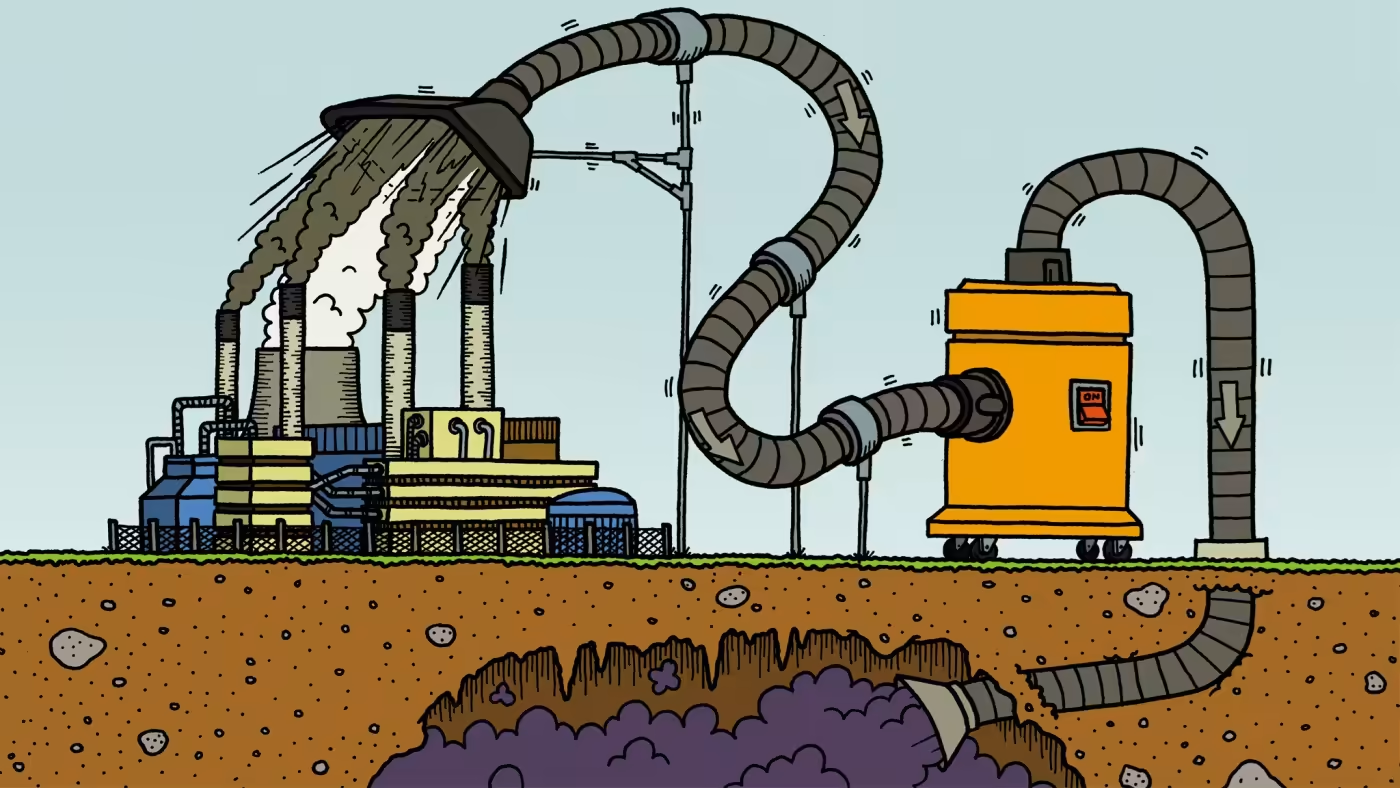
The publication of the paper is well timed. It should be pinned on the wall of every climate reporting room in mainstream media, starting with the hopelessly biased BBC. Perhaps not the Guardian though, sadly a lost cause beyond redemption. In considerable but easily understood detail, the paper debunks many of the extreme weather claims that remain the mainstay of grossly misleading climate science reporting.
The new Alimonti blockbuster shows it is not difficult to find all the relevant climate data, while the education needed to understand it relies mainly on an ability to read words and comprehend numbers. This climate paper is not breaking new barriers of scientific understanding, rather it is a work of investigation and compilation from freely available sources, many of them to be found in the published output of the Intergovernmental Panel on Climate Change (IPCC). Most extreme weather events are not getting worse, with or without human involvement, whatever alarmists from the climate comedy turn Jim ‘jail the deniers’ Dale to the BBC say. Inconveniently, the IPCC says more or less the same thing.
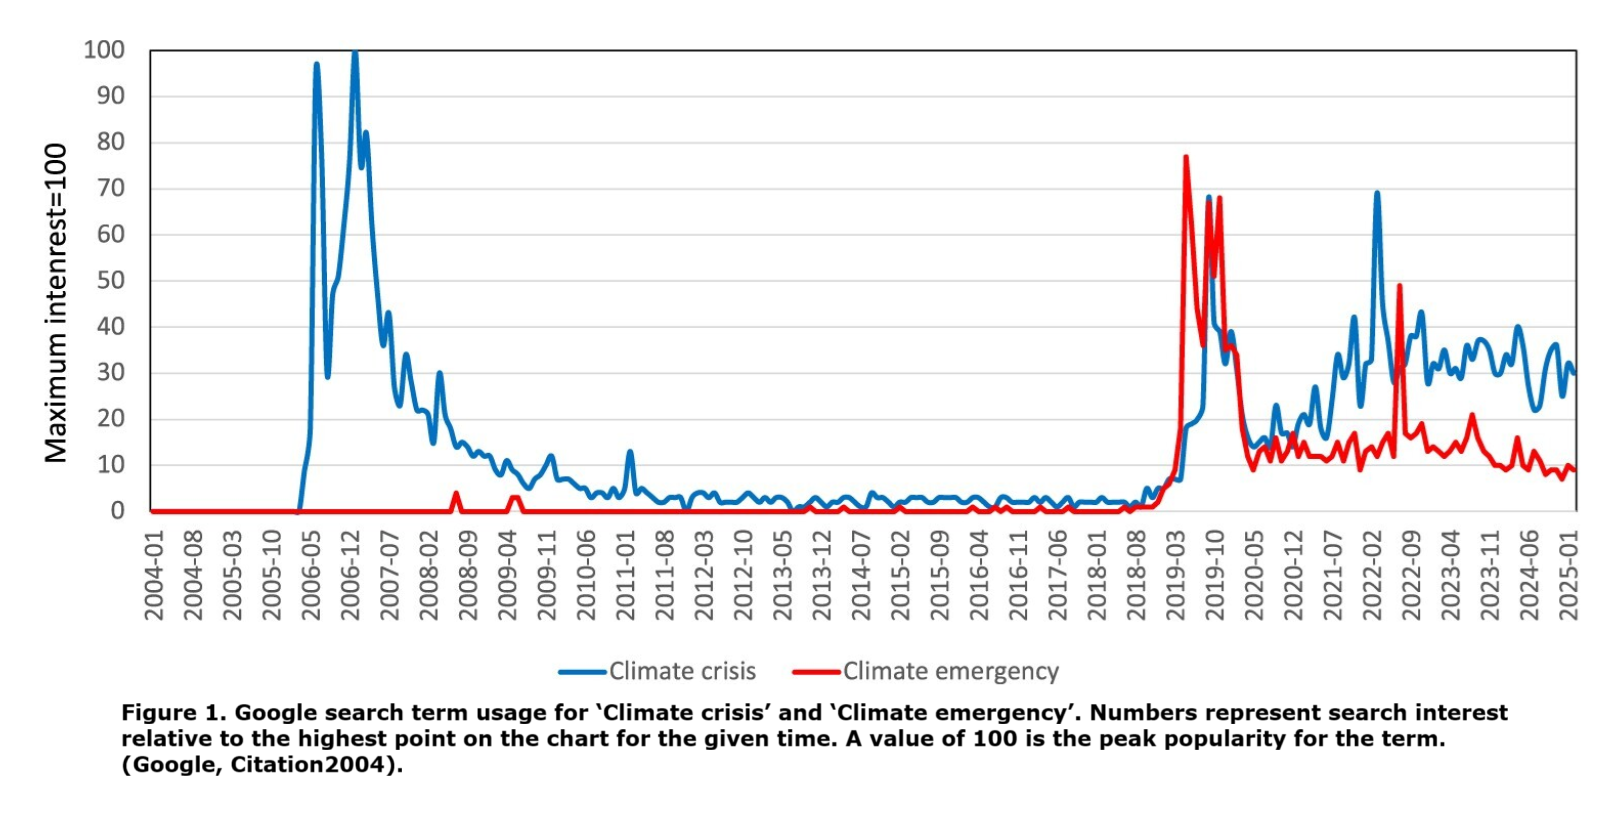
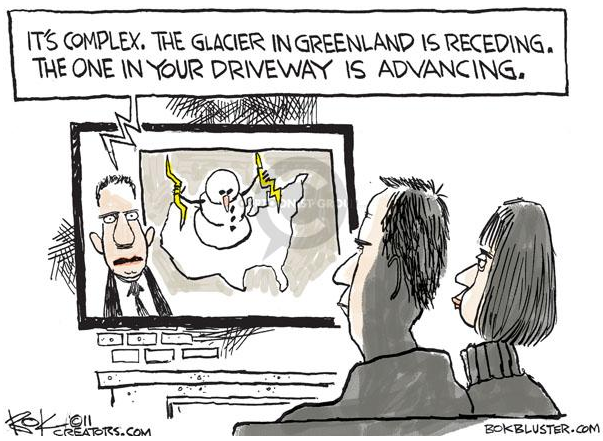
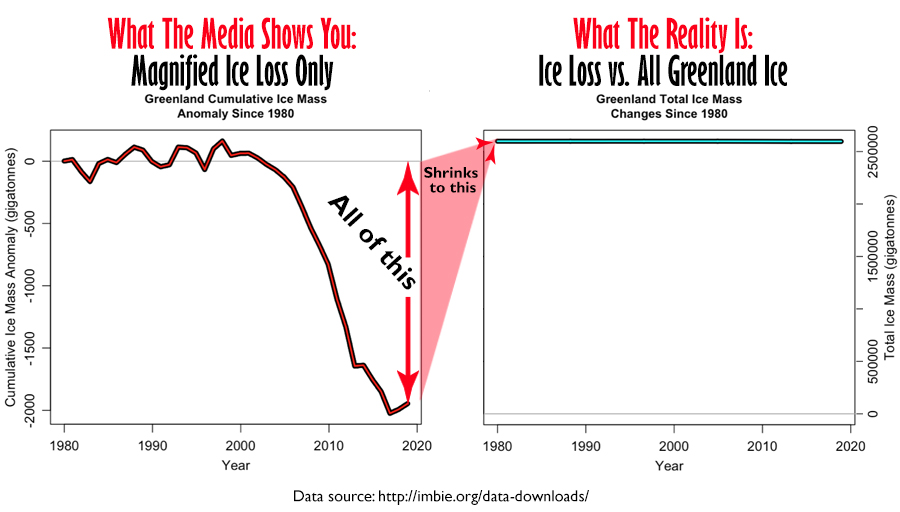
There is of course no climate ‘crisis’ or ‘emergency’, or at least not one that is evident from current scientific observations. Compared to recent historical experience, the current climate is relatively benign. Slightly warmer, more carbon dioxide leading to higher biomass and no increase in most types of bad weather. The fear of some sort of ‘crisis’, usually prophesised for an ulterior purpose, is ubiquitous in human history. Hysteria rises and falls dramatically, sometimes over long sustained periods, and in the case of climate this is displayed by an interesting graph compiled by Alimonti.

Google searches for climate ‘crisis’ and ‘emergency’ reveal two recent hysteria peaks, namely at the time of the Al Gore agitprop film An Inconvenient Truth featuring the infamous Michael Mann temperature hockey stick, and the Greta Thunberg and Extinction Rebellion-led lunacy at the turn of the current decade.
Professor Alimonti proposes a data-focused toolkit to cut through the hype around a ‘climate crisis’. Instead of the alarmism, it is suggested that clear trackable metrics such as economic damages and health effects are tied to the key climate trends and events. Analysing these metrics shows no strong worsening trends. Any adaption plans for a changing climate should be based on real evidence, not one-size-fits-all panic.
The Article is Quantifying the climate crisis: a data-driven framework using response indicators for evidence-based adaptation policies. Synopsis below from excerpts in italics with my bolds and added images.
Defining the Concept of ‘Climate Crisis’ Through Measurable Indicators
The paper proposes an analytical approach to the concept of climate crisis through a set of objective, measurable Response Indicators (RINDs), such as environmental anomalies, socio-economic and health impacts, driven by Climate Impact Drivers (CIDs) defined in IPCC AR6. By shifting the focus from subjective interpretations to a quantifiable metrics, this approach provides a critical framework for assessing the situation in an analytical manner. Policymakers can use these indicators to design targeted interventions that address specific environmental changes, ensuring that actions are data-driven and aligned with scientific evidence. This definition avoids alarmism while promoting practical, evidence-based solutions.
Climate Impact Drivers (CIDs)
Climate Impact Drivers (CIDs) are physical climate system conditions (e.g. means, events, extremes) that affect an element of society or ecosystems and are thus a priority for climate information provision. Depending on system tolerance, CIDs and their changes can be detrimental, beneficial, neutral or a mixture of each across interacting system elements, regions and society sectors. Each sector is affected by multiple CIDs and each CID affects multiple sectors. A CID can be measured by indices to represent related tolerance thresholds. (IPCC-AR6-WG1, Citation2021, p. 1770)
The latest IPCC AR6 process led to the development of 7 CID types (heat and cold, wet and dry, wind, snow and ice, coastal, open ocean, and other) and 33 distinct CID categories (CID, Citation2022): they are summarised in Table 12.12 (IPCC-AR6-WG1, Citation2021, p. 1856) which also presents CID emergence in different time periods based on multiple methods as provided by recent literature.
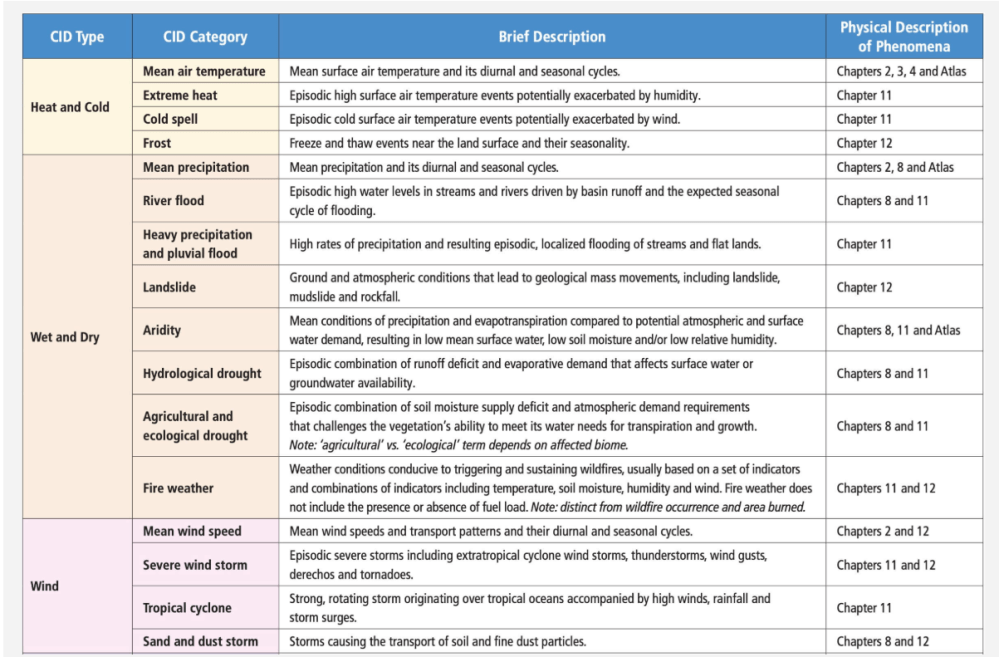
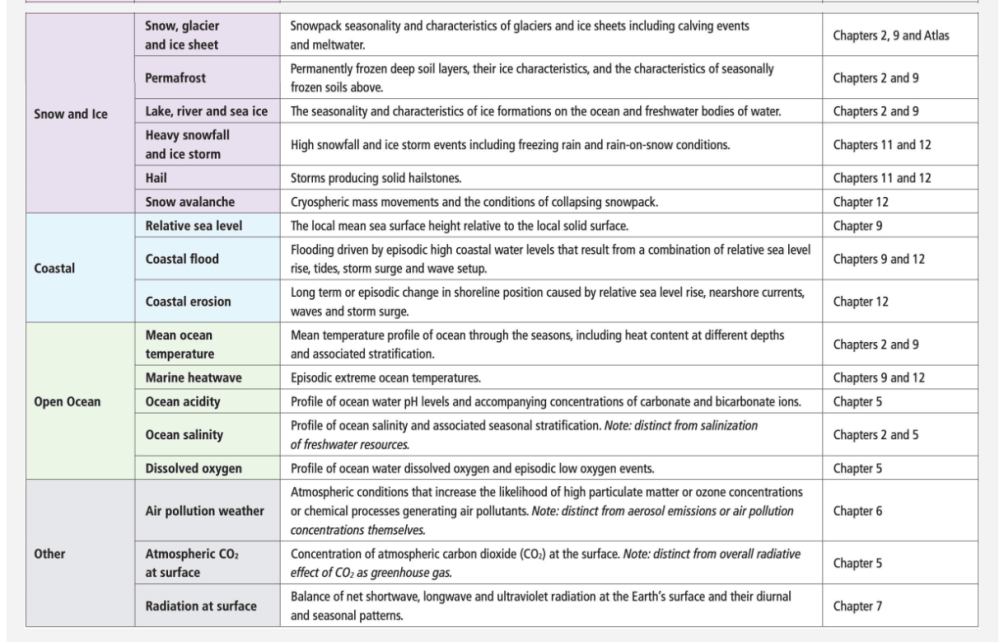
Table 12.1 | Overview of the main climatic impact-driver (CID) types and related CID categories with a short description and their link to other chapters where the underlying climatic phenomenon and its associated essential climate variables are assessed and described. https://www.ipcc.ch/report/ar6/wg1/chapter/chapter-12/#12.2
As shown in Table 12.12, most of the CIDs do not exhibit significant changes before the end of the XXI century even in the most pessimistic RCP8.5 scenario. It is important to note that the RCP8.5 scenario does not represent a typical ‘business-as-usual’ projection but serves instead as a high-end, high-risk scenario while the RCP4.5 scenario is approximately in line with the upper end of aggregate NDCs (Nationally Determined Contributions) emissions levels (Hausfather & Peters, Citation2020; IPCC-AR6-WG1, Citation2021, p. 250; IPCC-AR6-WG3, Citation2022, p. 317) as also confirmed by a recent JRC report (Keramidas et al., Citation2025): our analysis will thus focus on the observation of CIDs time series and not on future scenarios.
Examples of CIDs
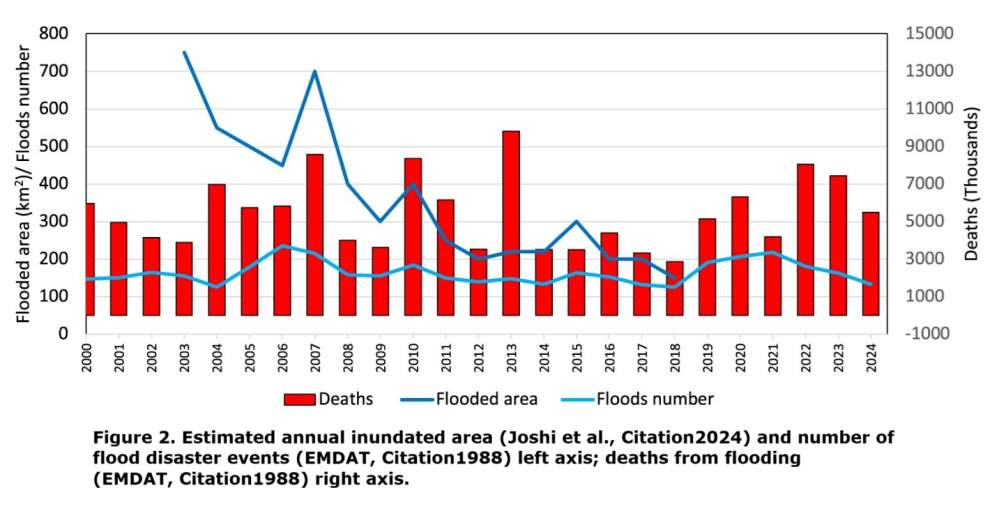
Floods
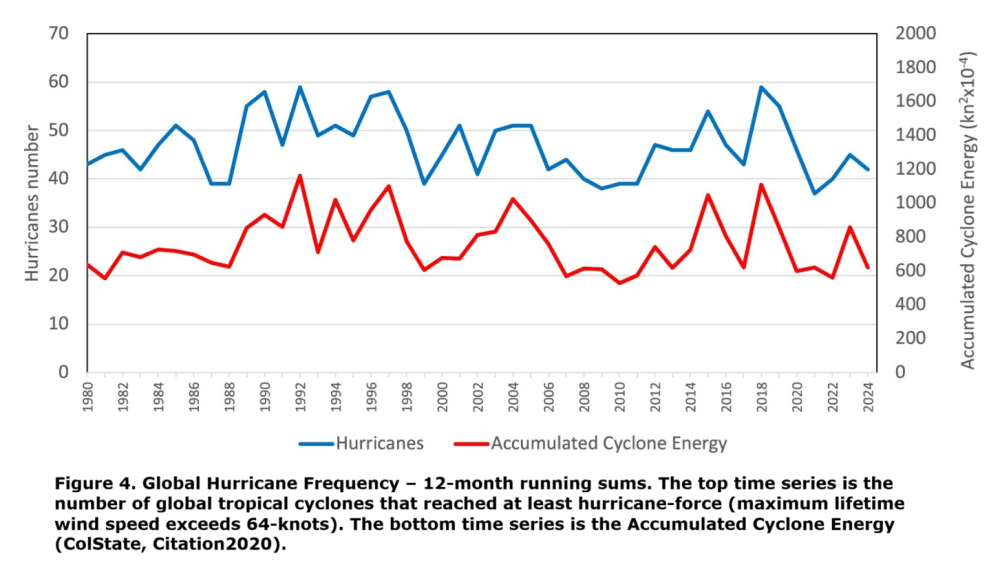
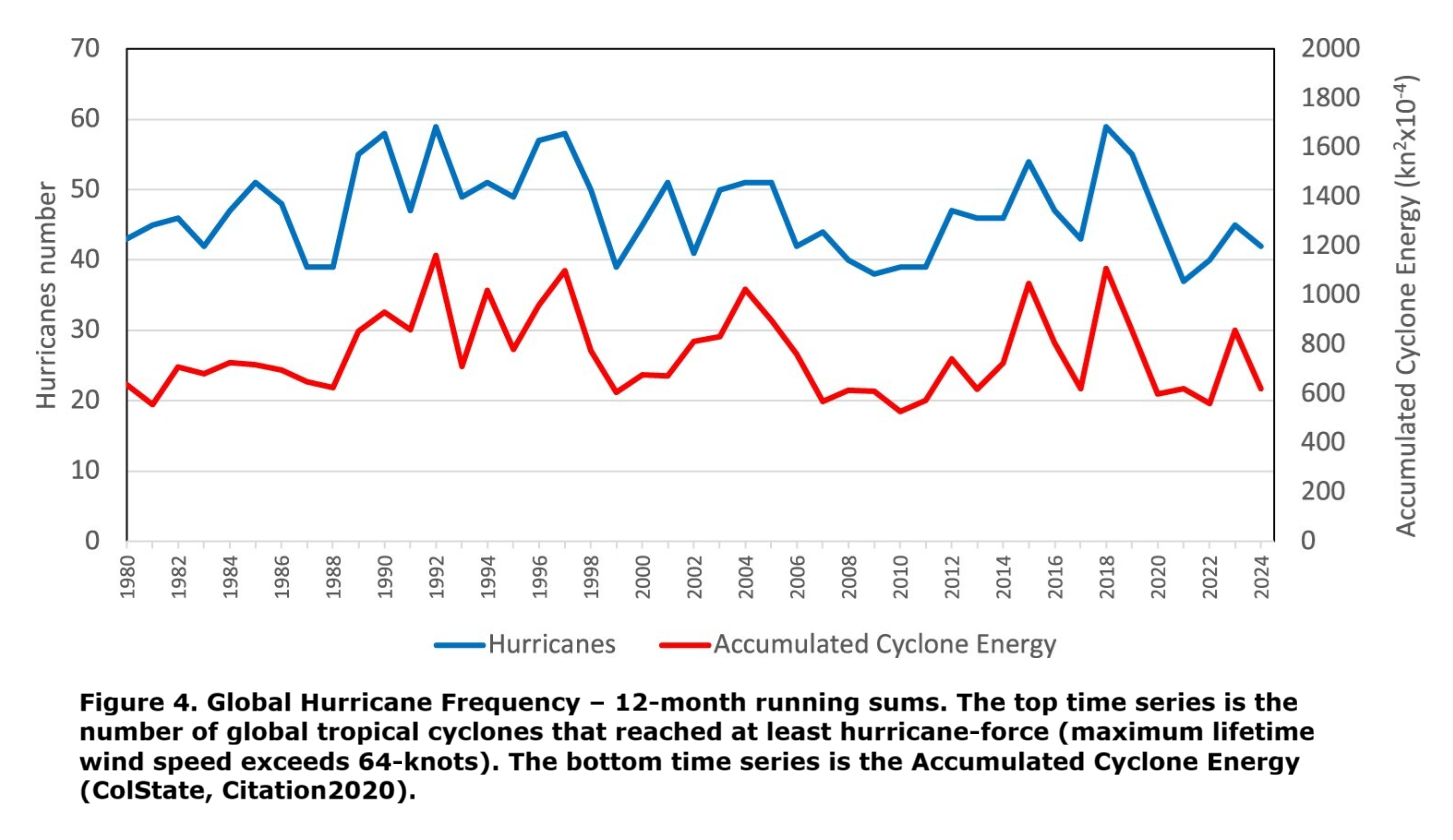
Hurricanes
Response indicators (RINDs)
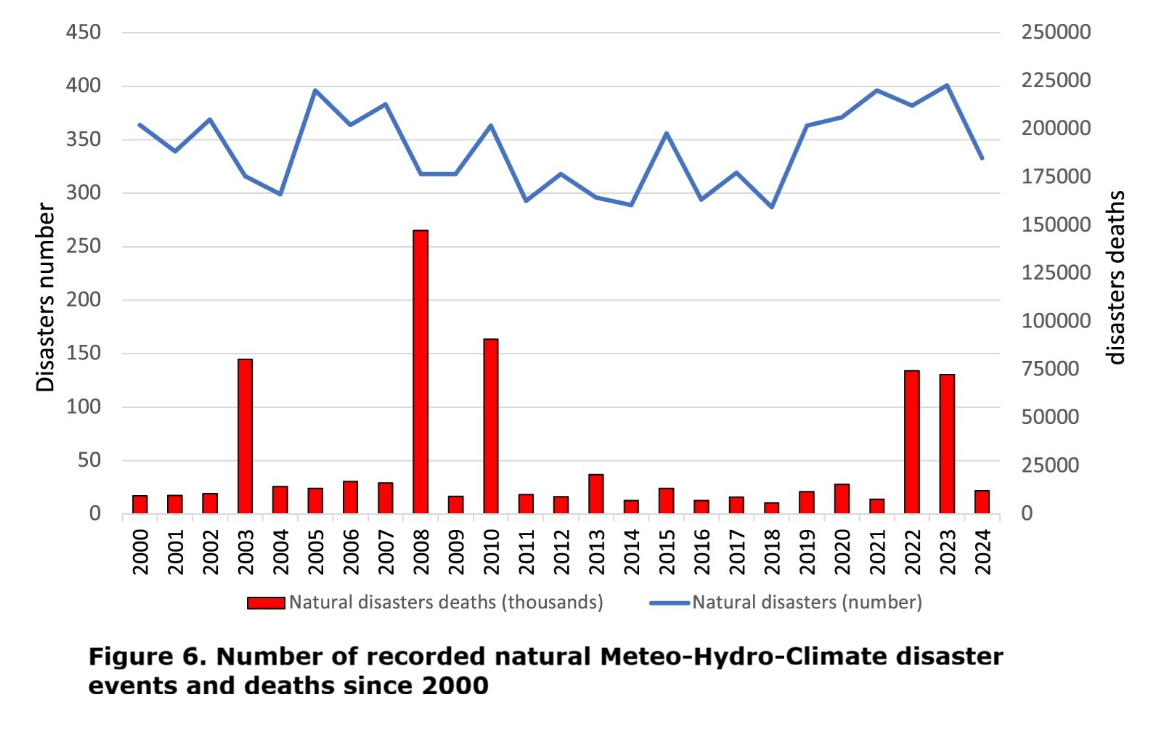
The number of natural disasters caused by weather-related events (e.g. hurricanes, floods, droughts, wildfires, wet mass movements, storms) can be used as a preliminary climate response indicator.
The number of recorded Meteo-Hydro-Climate disaster events and related deaths since 2000 is shown in figure 6 and no clear trend is found by the MK trend analysis, as reported in Table 1.
Natural Disaster Deaths

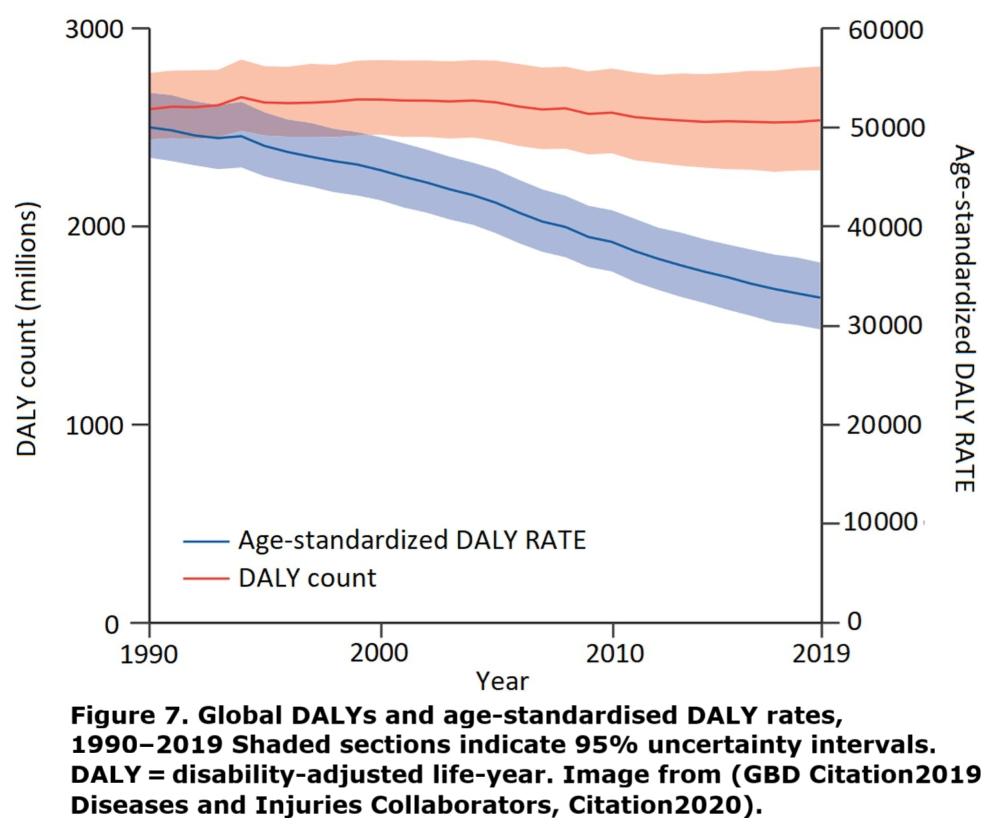
Diseases and Injuries
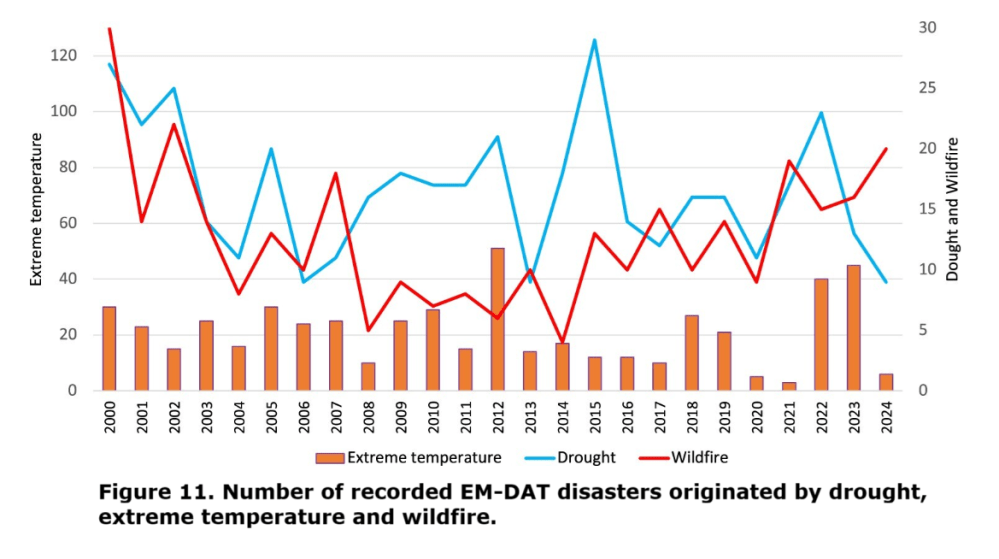
Disasters from Temperatures, Droughts, Wildfires
Discussion
An analytical approach to the ‘climate crisis’ concept based on CIDs and RINDs has been proposed enhancing the IPCC CID-based framework (CID, Citation2022). This approach is still provisional and reliant on some statistical scientific indicators. The initiative aims to move beyond the qualitative use of the term ‘climate crisis’ by establishing a broad, shared, and quantitative methodology. The final goal is to provide a robust, data-driven assessment through updated time series and standardised statistical analysis, supported by interdisciplinary collaboration.
To this end, we emphasise the importance of:
-
– periodic (at least annual) series updates by operational organisations such as FAO, WHO or other international entities that collect and manage time series useful for this purpose;
-
– an alarm criterion based on predefined statistical methodologies (e.g. exceeding specific thresholds, significant trend variations, etc.);
-
– multiscale analysis (global, national, regional). All systems on our planet – from the climate system to ecological and socio-economic systems – can be effectively approached from the global scale down to the microscale. While our work has been developed at a global scale with some exceptions, the analysis can be extended to smaller scales (United Nations Statistics Division, Citation2024).
We must emphasise that impact indicator time series often bear
the signature of adaptation, and that other human factors
tend to outweigh climate factors.
For instance, the influence of climate on conflicts is considered minor compared to dominant conflict drivers (IPCC-AR6-WG2, Citation2022, p. 2428; Mach, Citation2019). Similarly, the human footprint on vector-borne diseases may be more significant than climate change, as evidenced in the twentieth century by the decline in malaria endemicity and mortality despite rising global temperatures (Carballar-Lejarazú et al., Citation2023; Climate Adapt, Citation2022; Rossati et al., Citation2016). The reduction in deaths caused by extreme weather events can partly be attributed to improvements in civil protection systems. These examples demonstrate that adaptation often proves more effective than mitigation.
Another example of anthropogenic influence unrelated to climate concerns wildfires: many studies report increases in burned areas linked to a warming climate over recent decades across much of North America. However, the rate of burning sites in the USA in recent decades has been much lower than historical rates across most of the continent, a disparity attributed to aggressive fire suppression and disruption of traditional burning practices (Parks et al., Citation2025). Furthermore, global deforestation trends fit within complex land use patterns where climate plays a secondary role; more specifically, remote sensing data reveal an increase in forest areas at mid-to-high latitudes in the northern hemisphere, while deforestation driven by the expansion of intensive agriculture is observed in subtropical regions (FAO, Citation2022; Pendrill et al., Citation2022; Song et al., Citation2021; Winkler et al., Citation2021).
Most of the time series in Table 1 do not show signs of deterioration. This is important to highlight, as it suggests we still have sufficient time to develop effective and sustainable adaptation policies aimed at enhancing the resilience of socio-economic and environmental systems. For example, in the case of droughts, the use of dry farming techniques, which optimise the exploitation of water resources during periods of scarcity, and the creation of water reservoirs, which can also contribute to renewable energy production and flood mitigation and prevention, can be envisaged. Regarding forest fires, key adaptation measures include the rational management of forest litter, the establishment of firebreaks to prevent the spread of fire, and the maintenance of adequate firefighting services.
Since the observed emergence of most of the CIDs presented in IPCC Table 12.12, and confirmed by the analysed updated time series, as well as most of the RINDs in Table 1 do not exhibit worsening trends, our overall view is that the ‘climate crisis’, as portrayed by many media sources today, is not evident yet.
Nevertheless, it remains extremely important to improve
and standardise monitoring activities and to develop
adaptation strategies based on high-quality data.


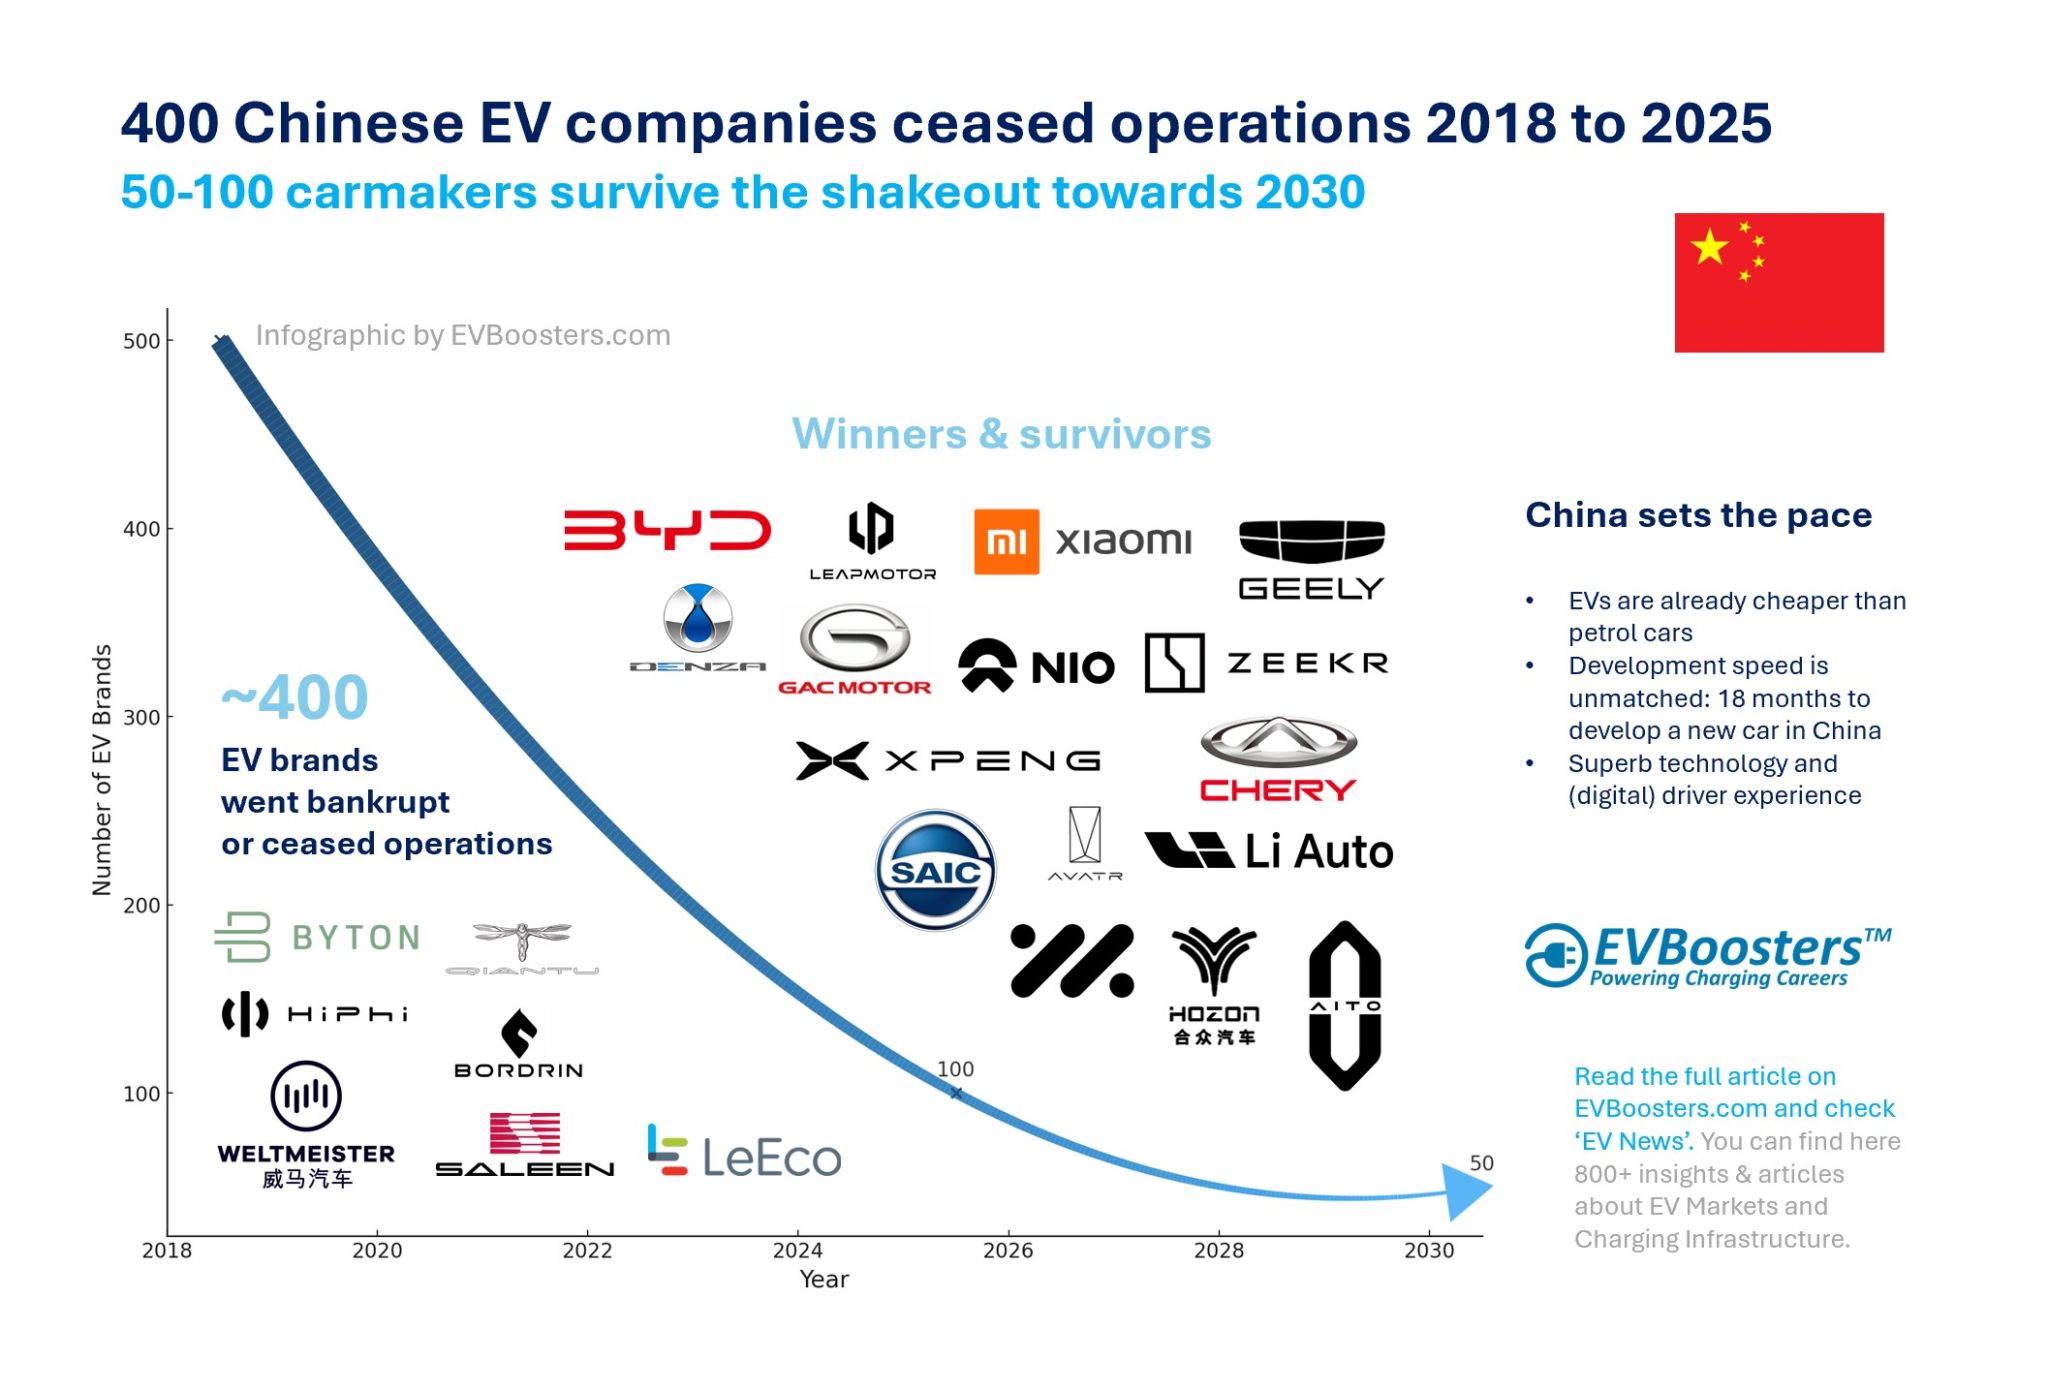 The Chinese electric vehicle (EV) boom has turned into a dramatic shakeout. Around 2018, China had more than 500 EV startups registered. These included everything from serious automotive disruptors to local government-backed ventures that never made it past the prototype phase. What do we mean by “EV startup”? In this context, it includes any newly registered Chinese company involved in the design, development, or production of new energy vehicles (NEVs) — including electric, plug-in hybrid and hydrogen cars. Many were speculative projects, created quickly to benefit from generous state subsidies, often with minimal automotive expertise. While a few had serious ambitions and advanced prototypes, the vast majority never got a vehicle on the road. By 2025, only around 100 of these brands remain active. Analysts from McKinsey predict that by 2030, fewer than 50 Chinese EV companies will survive. This is not just a story of collapse, but also of market maturation, consolidation, and strategic realignment.
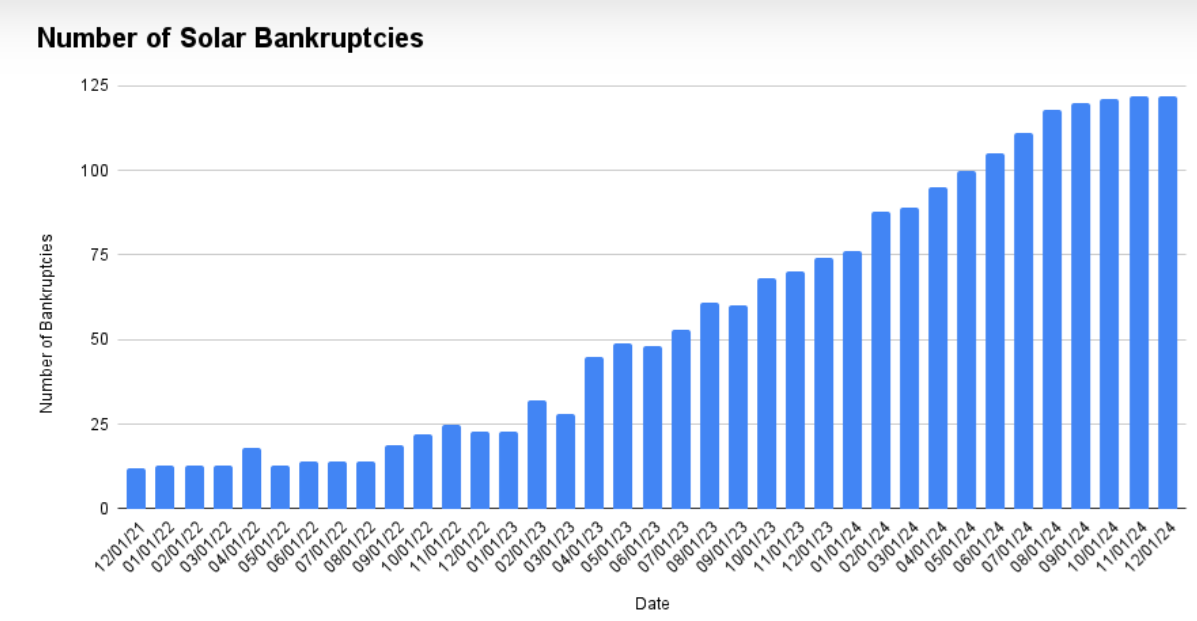
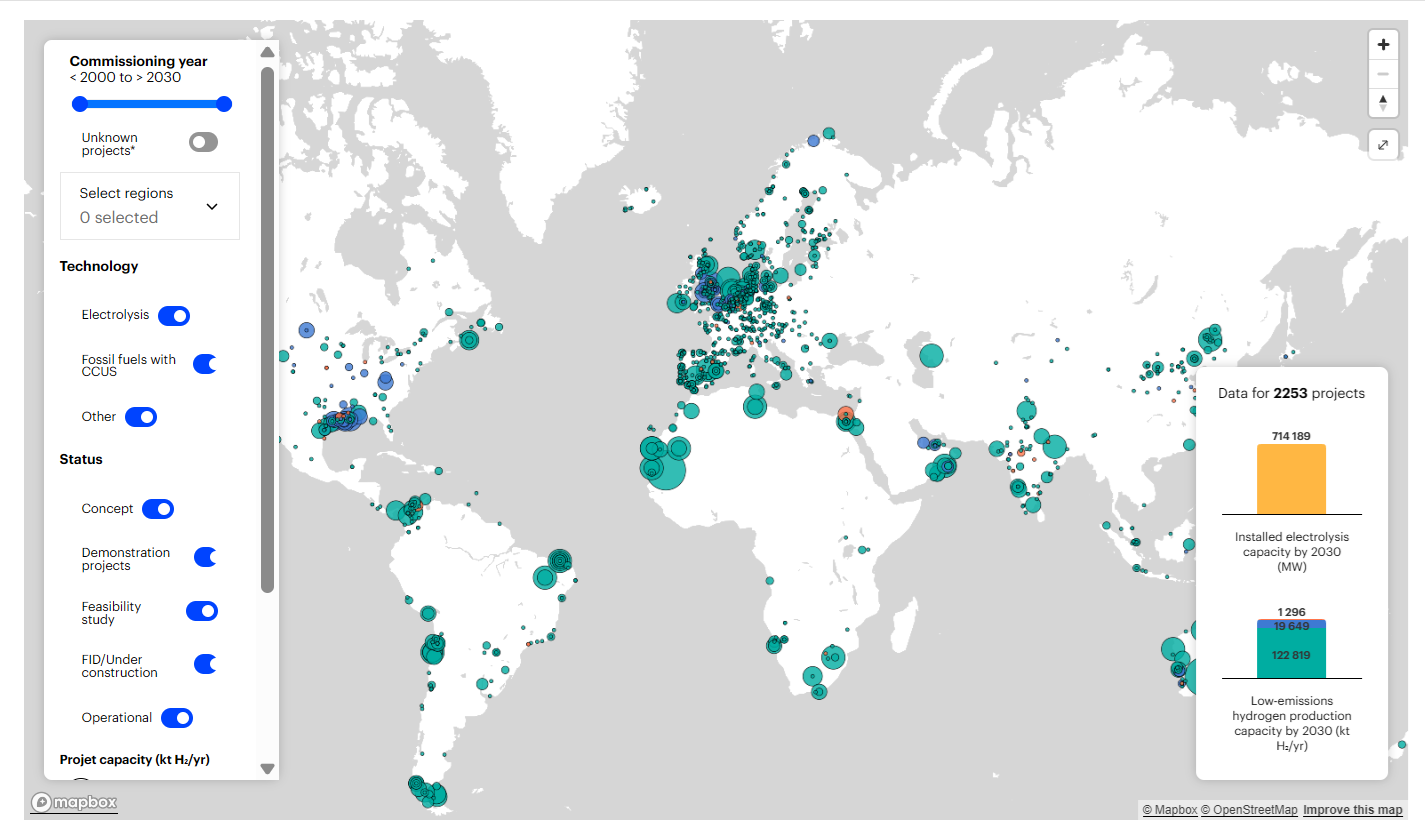


 We have clearly entered the era of resource dominance. Europe imports roughly 60% of its required energy. Its irrational war on baseload energy sources such as nuclear and coal has only deepened dependence.


