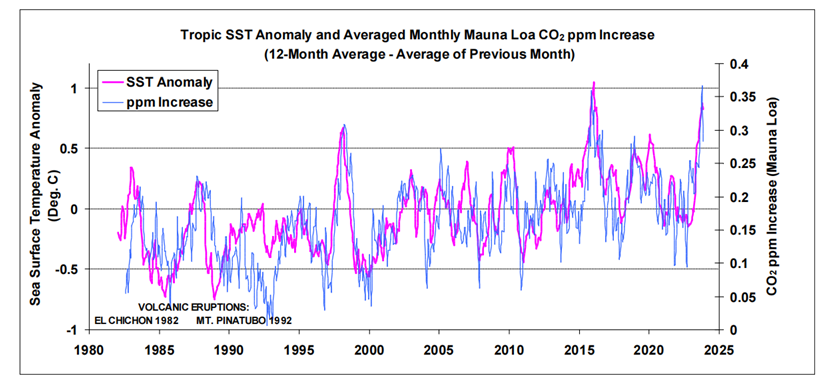
 Recently another researcher, Bernard Robbins, found similar causation between ML CO2 and SST fluctuations reported by NOAA Global SST dataset. See More Evidence Temperatures Drive CO2 Levels, Not the Reverse.
Previously I have demonstrated that temperature changes are predictive of changes in atmospheric CO2 concentrations. That includes the remarkable GMT spike starting in January 2023 and rising to a peak in April 2024, then dropping down to end of 2025. The most recent study was Yearend 2025, Cooling Temperatures Reducing CO2 Rise employing Mauna Loa CO2 data and UAH GMT data.
I noticed at WUWT my post was included in Weekly Climate and Energy News Roundup #674 with a comment attached: [SEPP Comment: The time period of the claimed lower CO2 rise is too short to be clear.] Now if that is referring to a table detailing the two variables during 2024 and 2025, I can understand it. But it also disregards the complete study covering UAH satellite temperature changes clearly leading Mauna Loa CO2 changes over a period of 45 years.
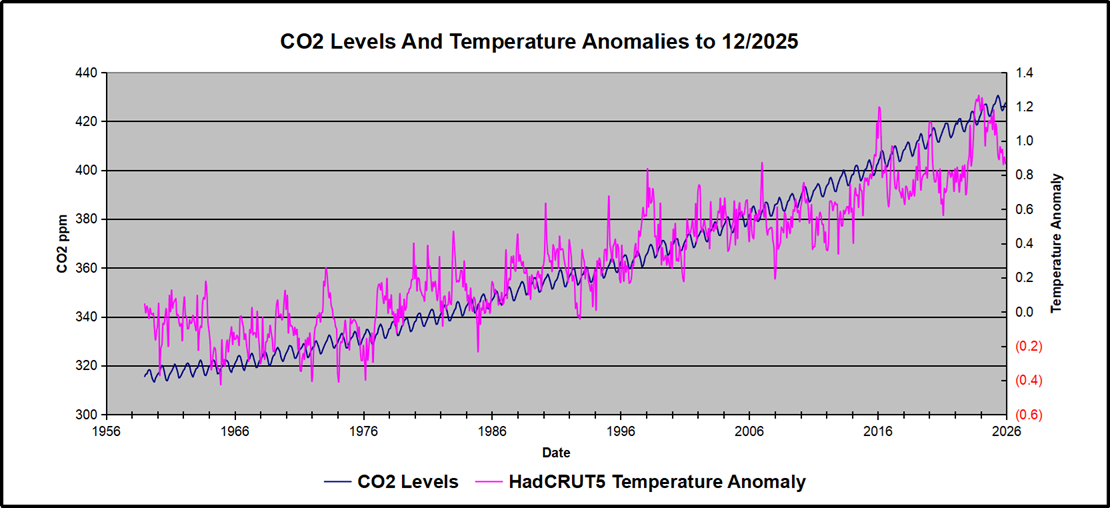
Along with some comments on my blog, I wondered whether the entire ML record of CO2 levels could be predicted from global temperature changes, which would require a GMT dataset covering 1959 to the present. This post shows that HADCRUT5 qualifies and indeed confirms other studies by researchers. I was particularly interested in the lack of warming in the 1960s and 70s, before the satellite temperature data became available.
The answer is yes: Just as temperature spikes result
in a corresponding CO2 spike as expected. Cooler temperatures
are predictive of lower CO2 levels.
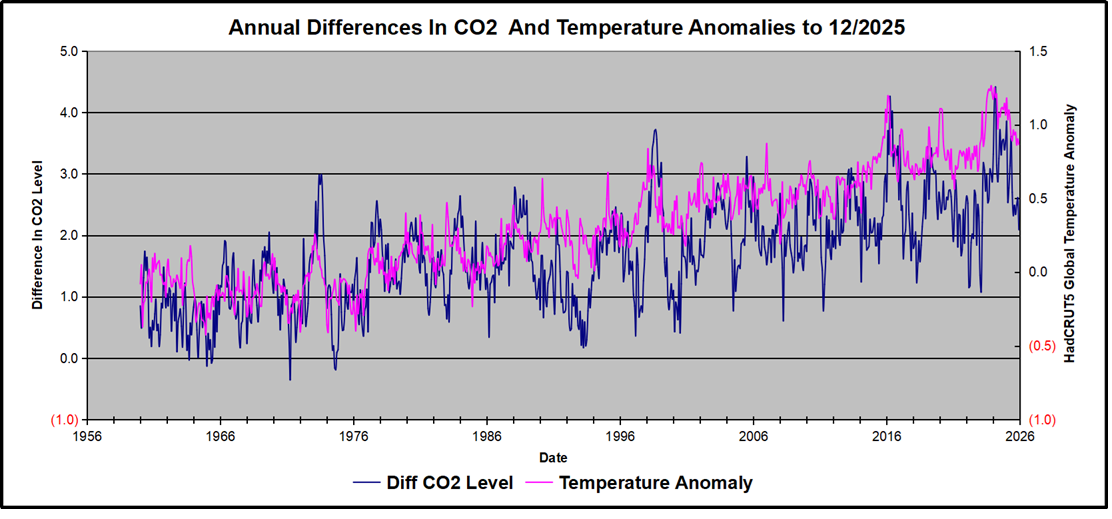
Above are HadCRUT5 temperature anomalies compared to CO2 monthly changes year over year during 65 years from 1959 to present.
Changes in monthly CO2 synchronize with temperature fluctuations, which for HadCRUT5 are anomalies referenced to the 1961-1990 period. CO2 differentials are calculated for the present month by subtracting the value for the same month in the previous year (for example December 2025 minus December 2024). Temp anomalies are calculated by comparing the present month with the baseline month. Note the recent CO2 upward spike and drop following the temperature spike and drop.
The final proof that CO2 follows temperature due to stimulation of natural CO2 reservoirs is demonstrated by the ability to calculate CO2 levels since 1959 with a simple mathematical formula:
For each subsequent year, the CO2 level for each month was generated
CO2 this month this year = a + b × Temp this month this year + CO2 this month last year
The values for a and b are constants applied to all monthly temps, and are chosen to scale the forecasted CO2 level for comparison with the observed value. The values for scaling HADCRUT5 and MLCO2 were “a” = 1.2 and “b” = 1.52 Here is the result of those calculations.
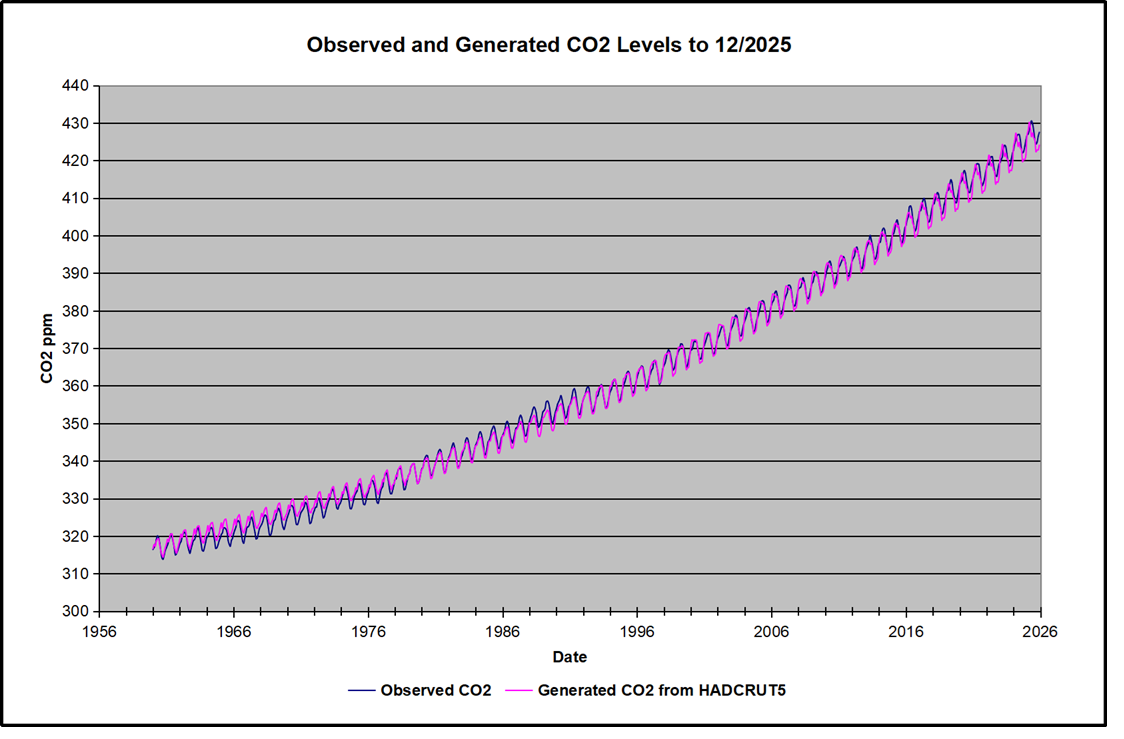
In the chart calculated CO2 levels correlate with observed CO2 levels at 0.9992 out of 1.0000. This mathematical generation of CO2 atmospheric levels is only possible if they are driven by temperature-dependent natural sources, and not by human emissions which are small in comparison, rise steadily and monotonically. For a more detailed look at the recent fluxes, here are the results since 2015, an ENSO neutral year.

For this recent period, the calculated CO2 values match well the annual lows, while some annual generated values of CO2 are slightly higher or lower than observed at other months of the year. Still the correlation for this period is 0.98
Footnote:
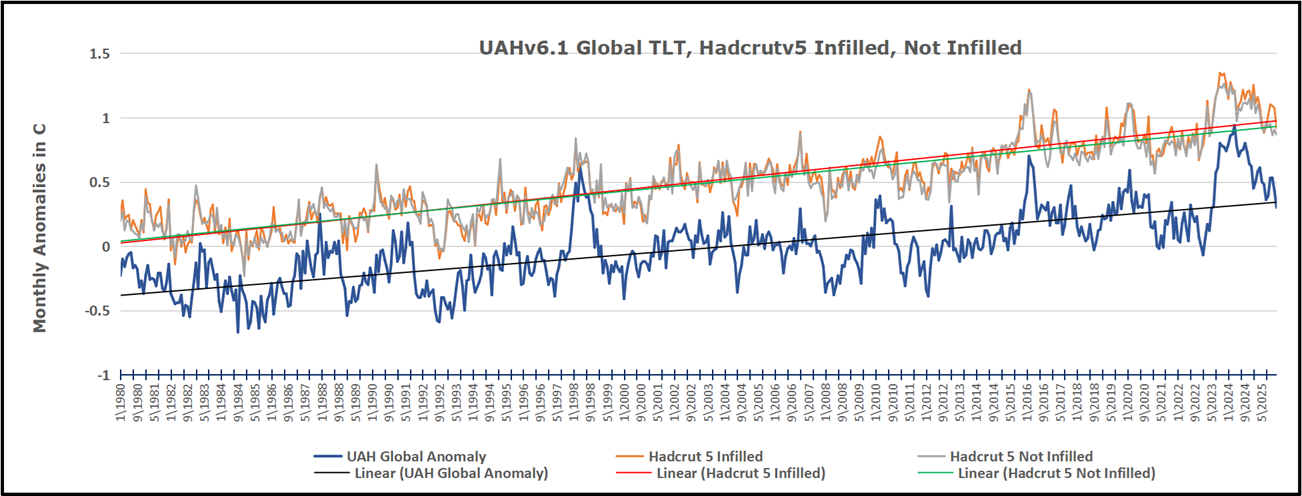
Hadcrut v5 offers a choice of two GMT data sets, one which infills grid cells lacking data and one which does not, compiling data only from cells with sufficient data. The analysis here shows data from Hadcrut 5 Not Filled In, though results from the Filled In dataset are virually the same with a slight upward bias. The overall lower anomalies in UAH are due to a later baseline, 1991 to 2020.
Key Point
Changes in CO2 follow changes in global temperatures on all time scales, from last month’s observations to ice core datasets spanning millennia. Since CO2 is the lagging variable, it cannot logically be the cause of temperature, the leading variable. It is folly to imagine that by reducing human emissions of CO2, we can change global temperatures, which are obviously driven by other factors.

Background Post
Summary:
The massive fluxes from natural sources dominate the flow of CO2 through the atmosphere. Human CO2 from burning fossil fuels is around 4% of the annual addition from all sources. Even if rising CO2 could cause rising temperatures (no evidence, only claims), reducing our emissions would have little impact.

Atmospheric CO2 Math
Ins: 4% human, 96% natural
Outs: 0% human, 98% natural.
Atmospheric storage difference: +2%
(so that: Ins = Outs + Atmospheric storage difference)
Balance = Atmospheric storage difference: 2%, of which,
Humans: 2% X 4% = 0.08%
Nature: 2% X 96 % = 1.92%
Ratio Natural : Human =1.92% : 0.08% = 24 : 1
