The arctic ice extents are now reported through February 2026, early on showing rising refreezing rates bringing Arctic ice extents within 200k km2 of the 20-year average. In the last 2 weeks the wavy Polar Vortex pushed cold south and replaced it with warmer southern air. Remarkably, Arctic ice reached 14.44 on day 43 in 2026, virtually matching the 2025 annual daily extent maximum of 14.48M km2 on day 80 of that year.
The chart below shows the 20-year averages for Arctic ice extents mid-Febrauary along with 2026 and 2025, as well as SII v.4.
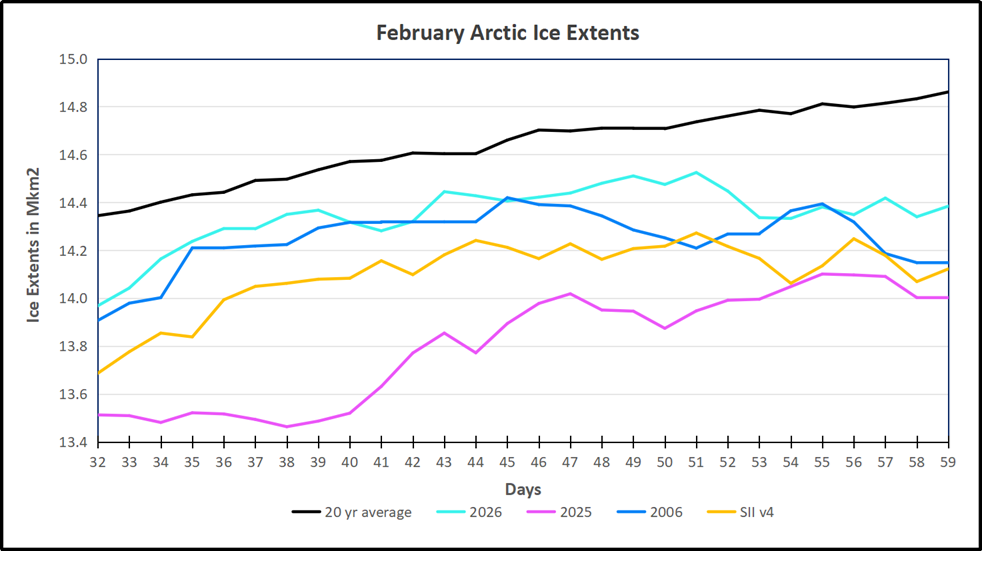
As stated previously, likely due to a wavy polar vortex, MASIE 2026 grew rapidly in February reaching 14.52 M km2 on day 51, surpassing the 2025 max of 14.48 on day 80. In the last week the extent dropped back down to 14.4 M. Sea Ice Index (SII v4) reported lower extents than MASIE in February, averaging -250k km2 on a daily basis.
The vortex temperature shifts are shown below in charts from AER AO/PV blog.
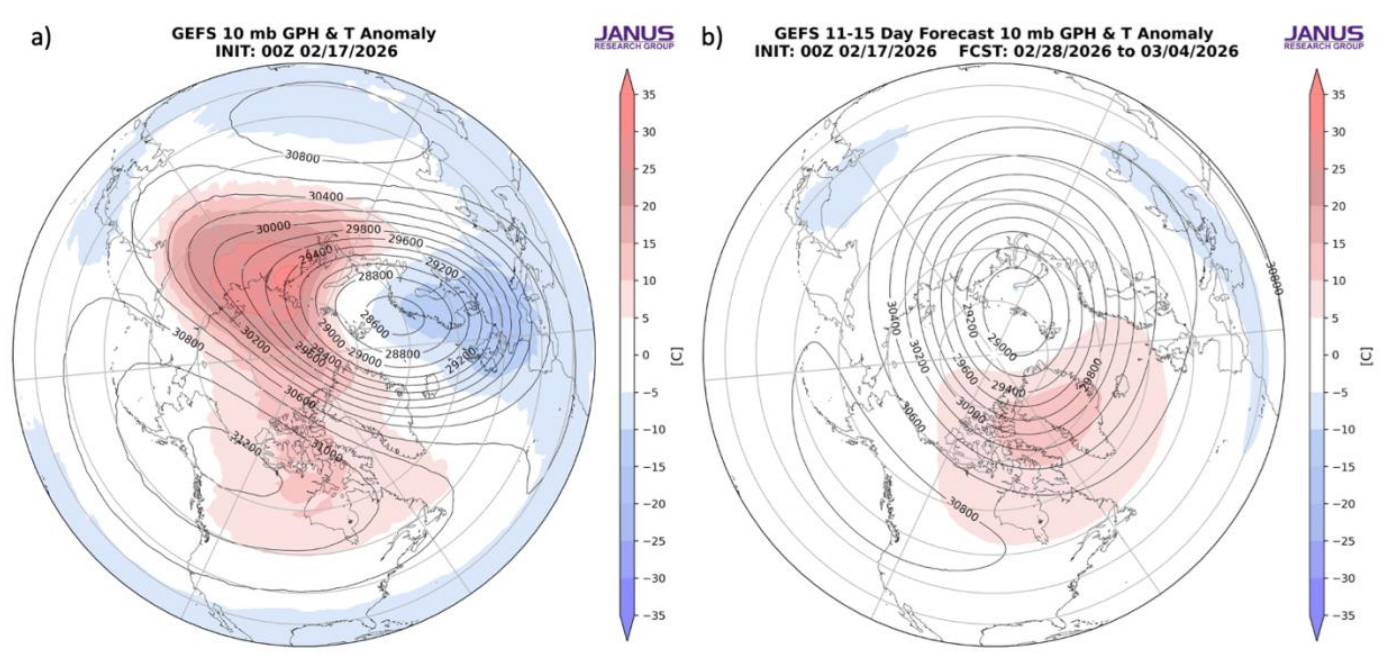
Figure 12. (a) Observed 10 mb geopotential heights (dam; contours) and temperature anomalies (°C; shading) across the Northern Hemisphere for 17 Feb 2026. (b) Same as (a) except forecasted averaged from 28 Feb to 4 Mar 2026. The forecasts are from the 00Z 17 Feb 2026 GFS ensemble. Source: AER AO/PV blog.
The table below shows the distibution of ice extents on day 59 across regions of the Arctic ocean.
| Region | 2026059 | Day 59 Average | 2026-Ave. | 2025059 | 2026-2025 |
| (0) Northern_Hemisphere | 14384094 | 14861155 | -477061 | 14000679 | 383416 |
| (1) Beaufort_Sea | 1071070 | 1070420 | 650 | 1071001 | 69 |
| (2) Chukchi_Sea | 966006 | 965473 | 533 | 965989 | 17 |
| (3) East_Siberian_Sea | 1087137 | 1087111 | 27 | 1087137 | 0 |
| (4) Laptev_Sea | 897845 | 897837 | 8 | 897845 | 0 |
| (5) Kara_Sea | 914161 | 922224 | -8062 | 925512 | -11351 |
| (6) Barents_Sea | 567312 | 604234 | -36922 | 361405 | 205907 |
| (7) Greenland_Sea | 731619 | 627908 | 103711 | 637961 | 93658 |
| (8) Baffin_Bay_Gulf_of_St._Lawrence | 1264992 | 1512995 | -248004 | 1357658 | -92666 |
| (9) Canadian_Archipelago | 854931 | 853573 | 1358 | 854878 | 53 |
| (10) Hudson_Bay | 1260870 | 1260493 | 377 | 1260903 | -33 |
| (11) Central_Arctic | 3145110 | 3209967 | -64857 | 3159772 | -14663 |
| (12) Bering_Sea | 724115 | 659010 | 65105 | 577908 | 146207 |
| (13) Baltic_Sea | 136175 | 92656 | 43518 | 40575 | 95599 |
| (14) Sea_of_Okhotsk | 737815 | 1057674 | -319858 | 774415 | -36599 |
The table shows that most regions are close to or above the 20-year average. Two major deficits are in Baffin Bay and Sea of Okhotsk, partly offset by several smaller surpluses, mostly in Greenland Sea, Baltic and Bering seas. The overall 2026 MASIE deficit is 3% of the 20-year average.


One comment