 The arctic ice extents are now reported through March 16, 2026, an important date just past the annual daily maximum for Arctic ice extents averaged over the last 20 years. As noted in February, the wavy polar vortex has hampered ice formation with incusions of warmer southern air into the Arctic circle. For example, here is an image from AER PV blog showing temperatures recently:
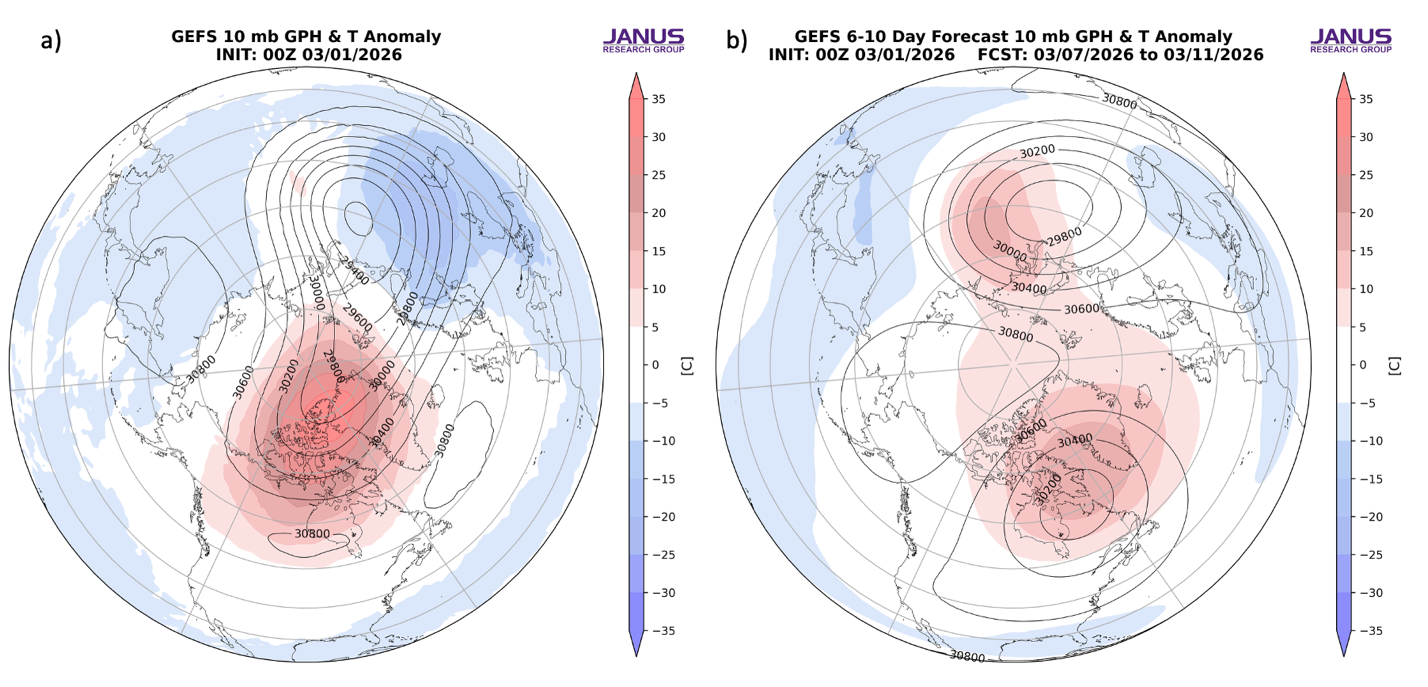
Figure 12. Observed 10 mb geopotential heights (dam; contours) and temperature anomalies (°C; shading) across the Northern Hemisphere averaged from 3 Mar. (b) Same as (a) except forecasted averaged from 7 Mar to 11 Mar 2026. The forecasts are from the 00Z 1 Mar 2026 GFS ensemble.
Remarkably, the 2025 annual daily extent maximum of 14.48M km2 was on day 73 of that year. Arctic ice reached 14.55 on day 63 in 2026, and continued near that level until yesterday, day 75.
The chart below shows the 20-year averages for Arctic ice extents mid-March along with 2026, 2025 and 2006 as well as SII v.4.
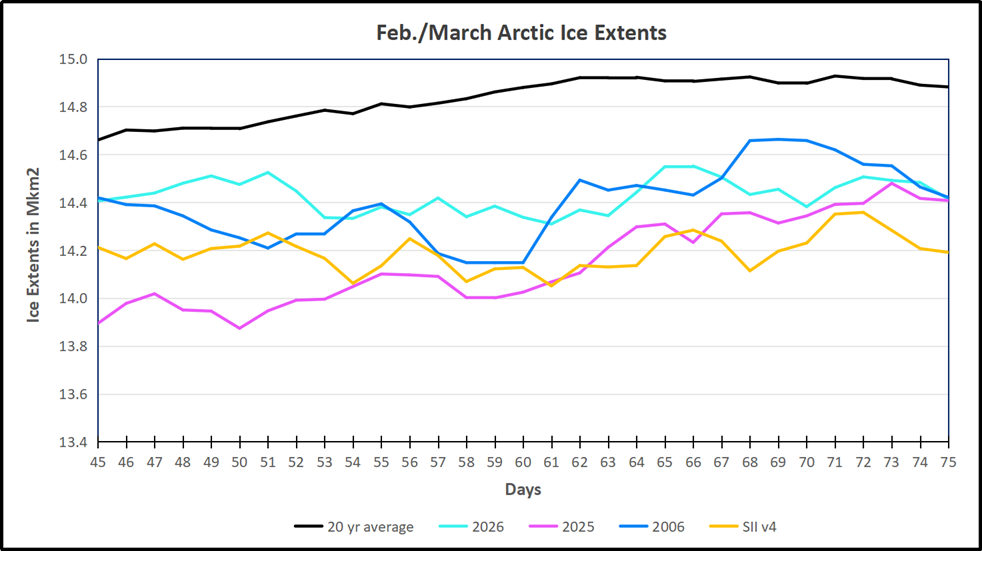
The 20-year average maximum daily ice extent appears at 14.93M km2 on day 71 before starting to decline. MASIE 2006 and 2026 started this period the same and ended the same at 14.42M km2. 2025 started much lowered but matched the other two years on day 75. SII v.4 continues to show lower extents than MASIE, a deficit on the order of 220k km2 during March and on day 75.
The table below shows the distibution of ice extents on day 75 across regions of the Arctic ocean.
| Region | 2026075 | Average Day 75 | 2026-Ave. | 2006075 | 2026-2006 |
| (0) Northern_Hemisphere | 14413747 | 14882167 | -468421 | 14420679 | -6932 |
| (1) Beaufort_Sea | 1071070 | 1070384 | 686 | 1069711 | 1359 |
| (2) Chukchi_Sea | 966006 | 965902 | 104 | 964227 | 1779 |
| (3) East_Siberian_Sea | 1087137 | 1087113 | 24 | 1086702 | 435 |
| (4) Laptev_Sea | 897845 | 897838 | 7 | 897773 | 71 |
| (5) Kara_Sea | 933375 | 921644 | 11731 | 921428 | 11947 |
| (6) Barents_Sea | 616802 | 640512 | -23710 | 646196 | -29394 |
| (7) Greenland_Sea | 585405 | 633630 | -48225 | 613161 | -27756 |
| (8) Baffin_Bay_Gulf_of_St._Lawrence | 1400707 | 1511237 | -110530 | 1134817 | 265890 |
| (9) Canadian_Archipelago | 854931 | 853379 | 1551 | 852715 | 2215 |
| (10) Hudson_Bay | 1260887 | 1258334 | 2553 | 1251360 | 9527 |
| (11) Central_Arctic | 3206408 | 3223651 | -17243 | 3244243 | -37835 |
| (12) Bering_Sea | 901252 | 729963 | 171289 | 635252 | 266000 |
| (13) Baltic_Sea | 89899 | 77762 | 12138 | 175063 | -85164 |
| (14) Sea_of_Okhotsk | 522126 | 992634 | -470508 | 874372 | -352247 |
The table shows that most regions are close to or above the 20-year average. Two major deficits are in Baffin Bay and Sea of Okhotsk, partly offset by a smaller surplus in Bering sea. The overall 2026 MASIE deficit is 3% of the 20-year average.


Illustration by Eleanor Lutz shows Earth’s seasonal climate changes. If played in full screen, the four corners present views from top, bottom and sides. It is a visual representation of scientific datasets measuring ice and snow extents.


One comment