 The best list comes from an independent overseas observer. David Farrar of New Zealand wrote two posts at his Kiwiblog. Below are excerpts of the highlights, in italics with my bolds and added images. (H/T Jim Rose). His extended discussion with many examples can be accessed at this link 10 Reasons Why Trump Won.
Overview
Before I cover the ten points, I will cover an important point by way of an introduction as it overlays all these reasons and that is that a big reason why Donald Trump won and won convincingly is because of a series of unique skills that Trump brings to the table. For his opponents they are character flaws but to his supporters they are features not bugs:
* His phenomenal resilience in the face of a wall of overwhelming hostility and opposition from the his opponents, media, governing elites (some from his own party). . . Any other candidate would’ve given up.
* His work ethic. Trump thrives on an average of only 4 hours sleep a night and has energy that belies his age. Trump held 80 rallies since the US Labor Day.
* His personal wealth not only helped top up his campaign during fund-raising lulls but he was able to pay millions to a large team of lawyers to defend himself in the various court cases.
* His phenomenal political instincts combine with a great sense of humour. Trump is a genuinely funny guy, but he also responds to events on the fly with the aplomb of the most seasoned pol.
* Much is made of Trump’s aggression, his inartful speaking style and partisan, personal barbs at his opponents. To millions of Americans, sick of being lectured to and abused by governing elites, Trump abrasiveness and forceful personality is seen as essential to getting the job of draining the swamp done. Media and governing elites all over the globe hate Trump for this trait but tens of millions of voters see him as the last hope to actually get things done, break some eggs, crack heads in Washington DC and to stand up to the Putin’s, Xi’s Khamenei’s and Jung Ill’s of this world.

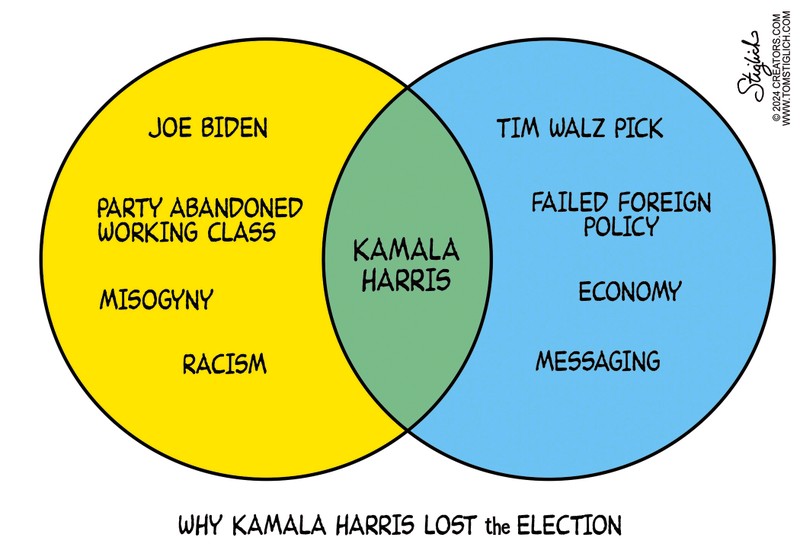
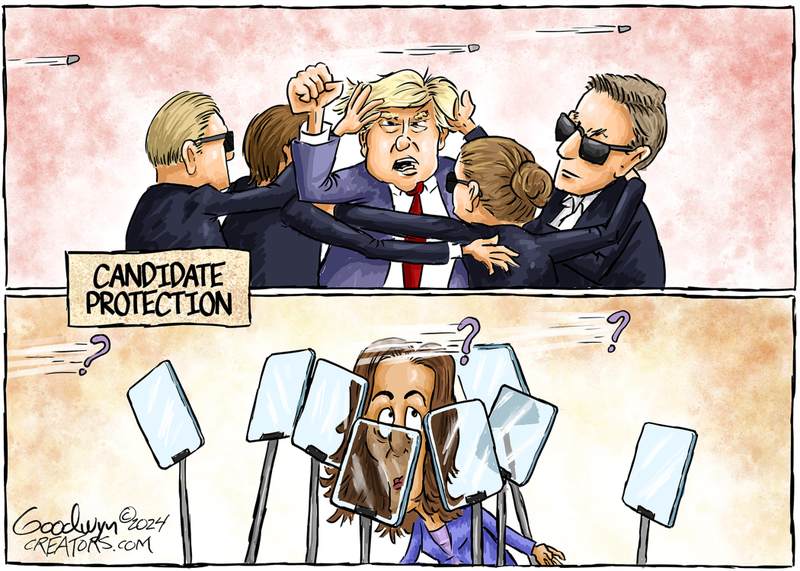
1.Harris and Waltz were poor candidates
Rather than turning to its bench of seasoned, experienced, media-savvy operatives, the woke DEI obsessed Democrat elites felt the optics of skipping over the sitting Vice President Harris as a woman of colour would be too devastating to the liberal base of the party and so they opted for Kamala in the hopes that their superior war chest and wall to wall favourable media coverage would cover for her manifest deficiencies. The gamble didn’t pay off because her failings couldn’t be hidden. They include:
* She ran an awful campaign for the Democratic nomination in 2019/2020 with faltering debate performances and a grab bag of far left policy positions that became frequent fodder for Trump campaign ads.
* She came across as scripted and inauthentic with her every public word crafted by her handlers. . . Teleprompters were used in seemingly ‘spontaneous’ town halls, questions and questioners were screened and known in advance and every voter interaction was choreographed, often poorly.
* Her few interviews, almost exclusively on Democrat friendly venues like CNN and The View, went poorly.
* She talked confidently of what she would do as President to solve the big problems like the cost-of-living crisis and the border crisis and when confronted as to why she hadn’t done anything about these pressing voter concerns over the almost 4 prior years as VP, she descended into yet more word salad circular answers.
* Her rallies were the definition of astroturf. Unlike Trump’s huge rallies that were packed to the gunnels with ordinary unscreened voters, Kamala’s rallies were often by invitation and held in locations small enough to create an illusion of a large full crowd. Many had paid attendees who, crisscrossed the country as professional rally attendees.
* The Harris campaign tried to run on joy, “brat summer”, happy vibes and a New Way Forward when she was an integral part of the poorly run Biden Harris Administration.
* Vice Presidential picks are usually not too impactful with the top of the ticket hoping to do no harm with the pick. In this election, Trump’s selection of JD Vance enhanced his candidacy and Harris’ choice of Tim Waltz diminished hers. . .Waltz proved to be almost as bad in interviews as Harris, being stumped a few times. And the mismatch between him and Vance became painfully obvious during the single VP debate that was one of the most one-sided debate victories in favour of Vance of this type of contest in a generation.
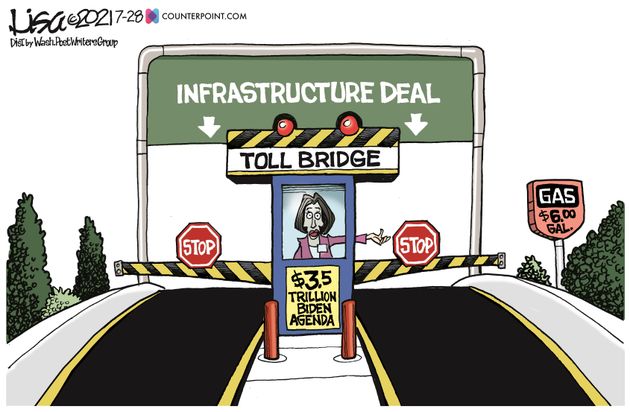
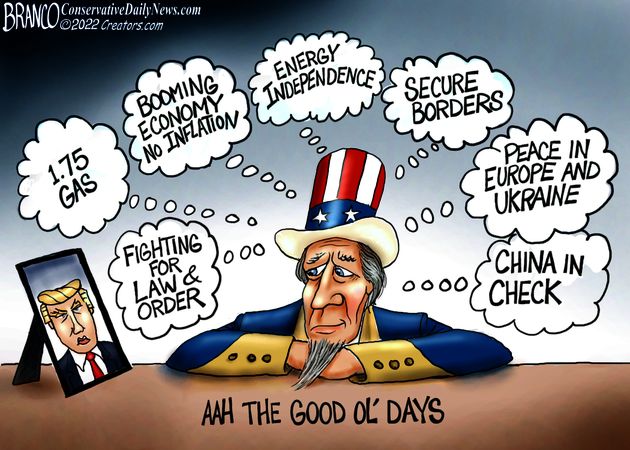
2. “It’s the economy stupid.”
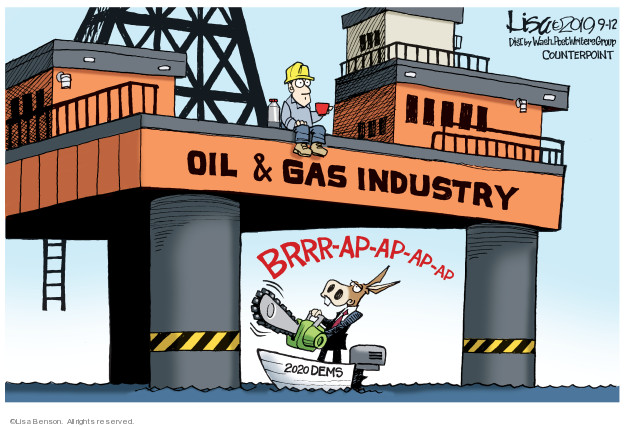
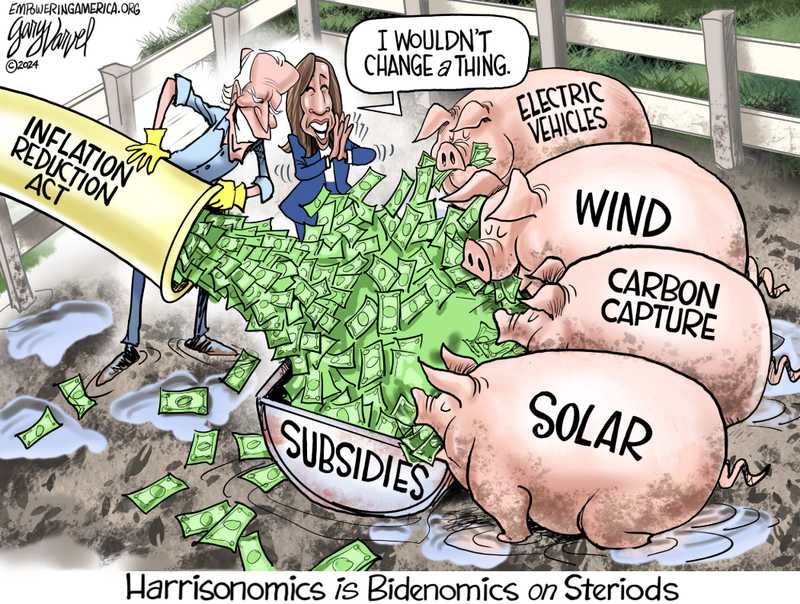
The massive printing of money that began with Covid and accelerated with all the Green New Deal spending boondoggles had the predictable effect of driving up inflation. The Biden Administration’s war on traditional energy (cancelling the Keystone XL pipeline, cancelling new oil and gas leases on Federal land and the EV mandates) all had the effect of scaling back the massive domestic energy boom under Trump’s first term causing a rise in energy prices, a process accelerated by the war in Ukraine and the uncertainty in the Middle East. This had the effect of driving up grocery prices in leaps not seen since the high inflation of the ‘70’s and a substantial increase in prices of petrol at the pump. . . increasing numbers of Americans were struggling to make ends meet and suffered a decline in their standard of living.

The American dream of home ownership for the rising generation became a more distant and unreachable goal. For the first time since the formation of the Republic in the 18th century, Gen Z became the first generation of young American adults to face a country less prosperous and with fewer economic opportunities than the previous generation. . . We had a race between an incumbent (Harris) and a challenger who had recently been President in the previous term and the economic juxtaposition proved to be electorally damaging for Harris.
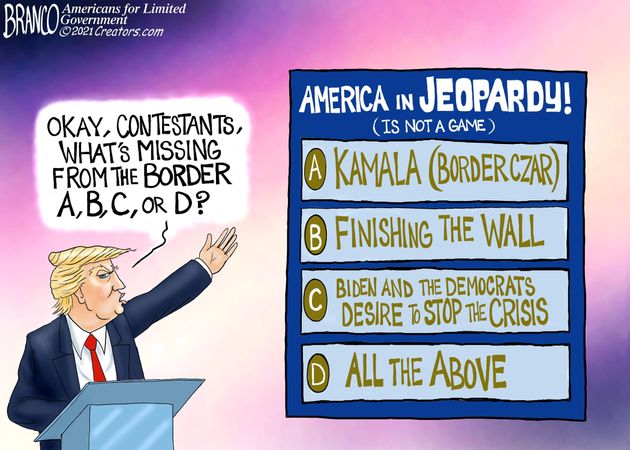
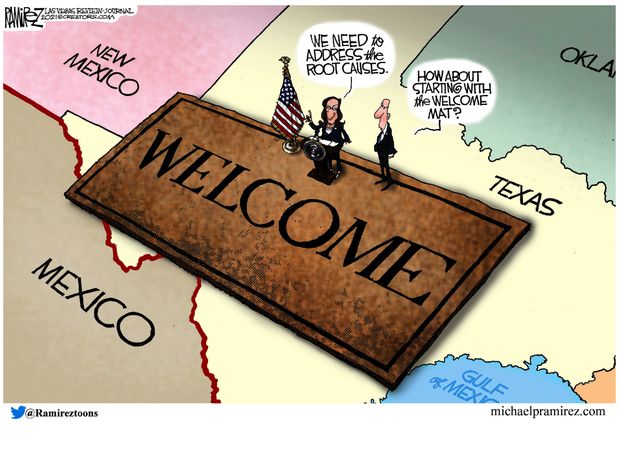
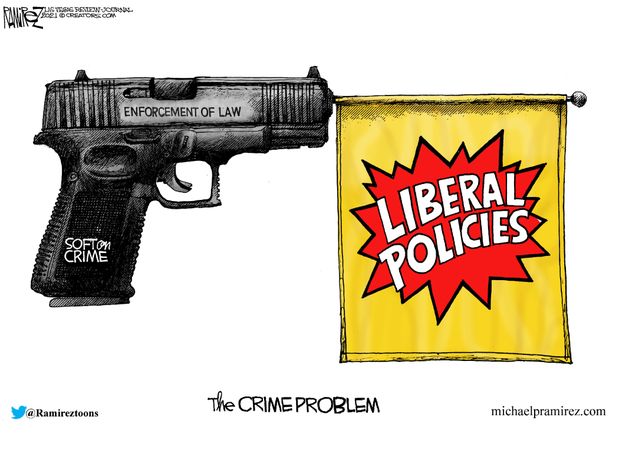
3 . The weeping sore of the open border = rising crime
This was a hot button issue that sailed somewhat under the radar for the first two years of Biden Harris until the cumulative numbers of illegal immigrants crossing the border reached a critical mass in cities and towns across America. For many years, the problems of illegal immigration were largely confined to the border states of CA, AZ, NM and TX. Trump worked hard to seal the border with a raft of policies: ending catch and release, the ‘stay in Mexico’ policy for asylum seekers, no benefits for migrants and building sections of a border wall. The net effect was, by the end of his Presidency in 2020, that the US had the lowest number of illegal border incursions in a generation.
Biden ended all that on almost Day 1 of his Presidency reversing a raft of effective Trump Executive Orders essentially throwing open the border. Asylum seekers could enter and then be given a court date years hence and then be released with no repercussions for failing to appear.
The impact of this steady stream of illegals, many being young men of military age, into many more northern cities led to pressure on resources usually only seen in border states, a very visible presence on streets and in places like parks and swimming pools but most significantly, because of zero vetting of unsuitable migrants, a surge in violent crime that saw a string of high profile rapes and murders of innocent usually women at the hands of criminal illegals who had been previously convicted of serious crimes in their home countries. . .The straw that broke the camel’s backs was the reports of violent Venezuelan gangs taking over whole apartment complexes in middle class suburbs like Aurora in Denver Colorado and other cities like LA and Seattle and of organised Chilean gangs of professional thieves robbing wealthy homes in Scottsdale, Arizona.
Trump and Vance hammered these huge negative impacts of illegal immigration relentlessly at every opportunity and the promise of a mass deportation of illegals beginning with the high-profile criminals wreaking havoc across cities and towns across America. At first the Democrats tried to gaslight the electorate that there was no border crisis, then they tried a bait and switch with RINO Republicans on a border bill that was amnesty lite and offered only a minuscule improvement in numbers of illegals.
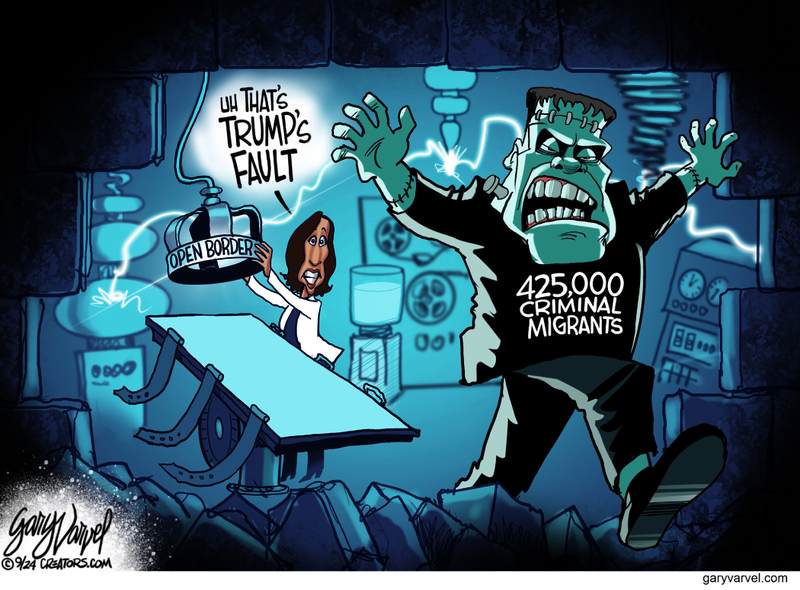
And then blame Trump and the GOP for not properly securing the border until Harris, finally sensing the electoral damage the open border was causing her party, became all bullish and strong on the border vowing to do as the new President what she never did as Biden’s VP despite being appointed by him as the Border Czar. It was too little too late and Trump’s extreme sounding solution to the problems caused by illegal migrants began to resonate with more and more voters.
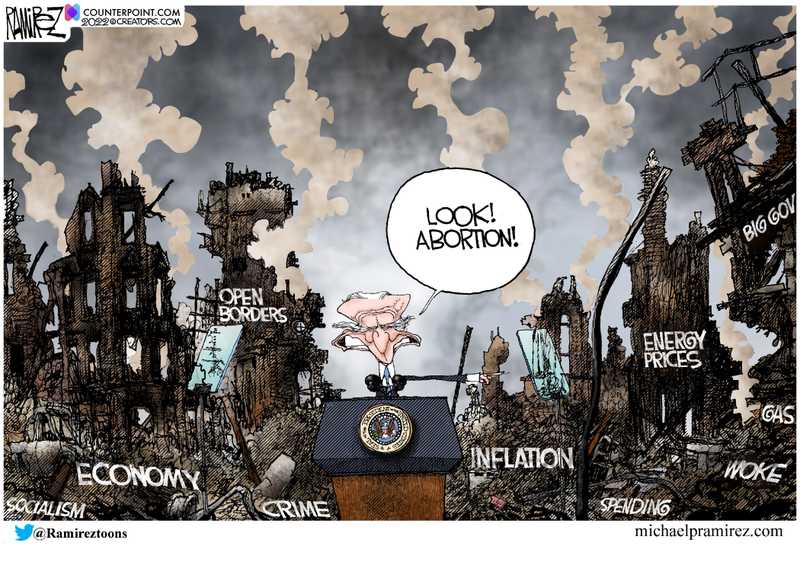
4. Trump is winning the cultural war
The Democrat Party and liberal elites are obsessed with abortion and trans gender rights. Many liberal and never-Trump commentators made much about how pro-choice Democrat candidates in the 2022 mid-terms and subsequent special elections overperformed, and this signaled somehow the overturning of Roe v Wade was the secret sleeper issue that would propel Kamala to victory. The problem was the left, as they often do, over egged the abortion pudding with a drumbeat of inflammatory rhetoric. . . Pro-choice candidates and media would then straight up lie repeatedly about all three of these points: they banged on endlessly about Trumps’ planned abortion ban, they mischaracterized the overturning of Roe v Wade, and they denied that pregnancies were terminated weeks prior to birth or even after birth. Trump drained the venom out of the abortion stinger such that it was not the decisive factor in 2024 that it was in 2022.
The left’s obsession with trans rights was personified by Harris when she bragged that when she was Attorney General of California, she arranged for the State to pay for trans gender surgeries for inmates. As more and more biological men who benefited from male puberty chose to transition and compete in women’s sports and to invade women only spaces like bathrooms, changing rooms and refuges, gradually this became the pointy end of the cultural war between traditional views on sexuality and the progressive left. . . The New York Times just reported that the most potent and effective of all the political ads that the Trump campaign ran was the one where Harris bragged about trans gender surgery for prisoners and illegals with the tag line Harris: They/Them – Trump: You!

The 2024 election gave voters the opportunity to use their silent majority electoral muscle to end what America by an out of touch elite. A vote for Trump was seen as a vote for a return to sanity and normalcy in the cultural wars.
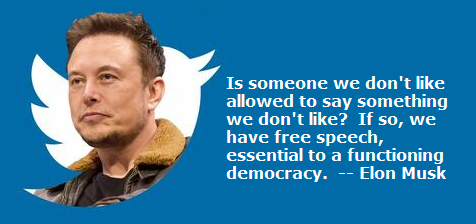
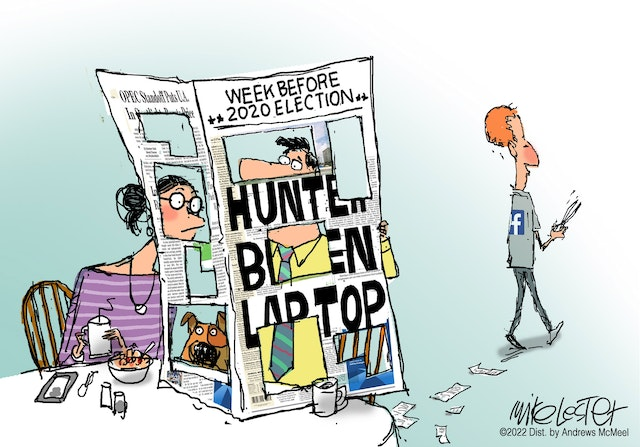
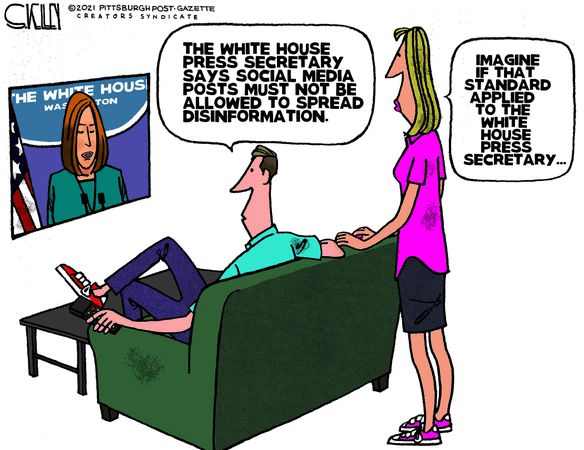
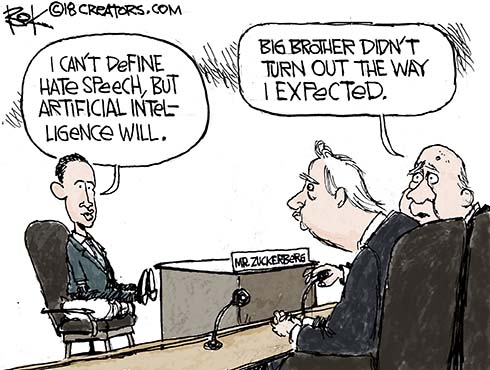
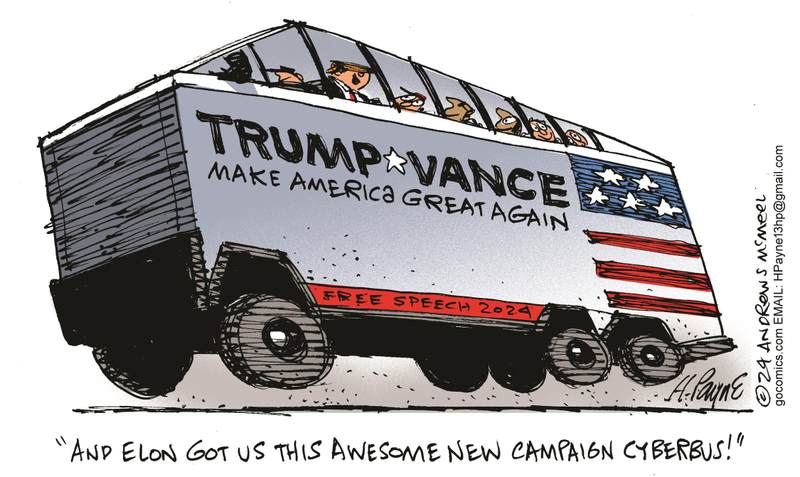
5. The impact of a free Twitter
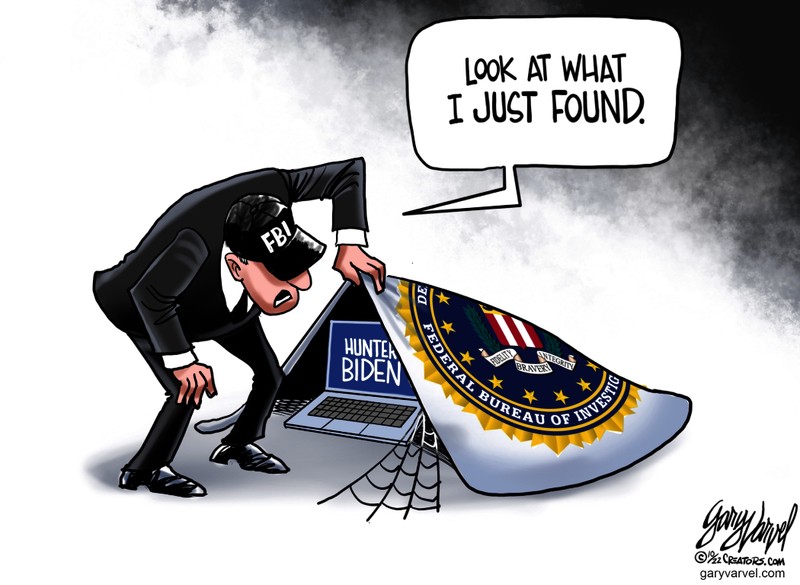
In the run up to the 2020 election and in its aftermath, the Democrats and governing elites were able to augment their overwhelming sympathetic support of the mainstream broadcast media with indirect ability, through the intervention of the FBI and other government agencies, to silence the voices of critics through the major social media platforms: Facebook, Instagram, Twitter, You Tube, Tik Tok and Snapchat. This meant that information that might be politically damaging to the left (such as the release of Hunter Biden’s laptop just prior to the 2020 election and the accusations of fraud in the same election) could be ruthlessly suppressed. The cutting edge of this suppression was Twitter 1.0 because it was the social media space most frequented by the politically active and influential media, celebrity and businesspeople. . . This was election interference at its most effective and sinister because post 2020 election polling showed that, had the truth of the laptop been allowed to disseminate and not be blocked by mainstream and social media, a significant minority of Biden voters might have changed their vote.
When Elon Musk bought Twitter in the summer of 2022, he not only fired the woke compliant left leaning management team but 75% of the whole work force and repositioned Twitter 2.0, renamed “X”, as a more neutral public square on social media. He engaged the services of prominent left leaning journalist Matt Taibbi who he allowed to pour over the files and, in a series of posts called the Twitter Files, revealed the extraordinary efforts undertaken by the Biden campaign then Administration to suppress any information critical of things like the Biden family corruption, Hunter’s laptop and 2020 election fraud as all this was deemed as dis or misinformation. Musk spent time removing the various algorithms that were embedded to screen for ‘misinformation’ and he restored the accounts of high profile Biden critics like Trump and even controversial figures like Alex Jones.
A raft of high profile conservative influencers who were suspended from Twitter were restored then allowed to tweet and post without restriction through the run up to the 2024 campaign. Twitter/X became the favoured platform for numerous releases of information that were restricted or never covered by the other social media platforms and the MSM.
Breaking news of a controversial nature that would either be ignored by legacy media or suppressed by all other platforms can now be done freely on Twitter where, contrary to the naysayers that predicted that Twitter 2.0 would fail, it has increased its reach and viewership even more since becoming a genuine free speech platform. Musk’s decision to liberate Twitter has had a profound impact on the type of dialogue that could be had in the run up to the 2024 election and it became impossible for Harris and the Democrats to silence their critics in the way they were successfully able to during the 2020 election.

6. Greatly improved Republican ground game
There are four areas where Republican efforts more closely matched or even exceeded those of the Democrats whereas in all four, GOP campaigns in 2020 were significantly outspent and outsmarted:
Media spending. Trump was outspent by Clinton by 3:1 in 2016 and by Biden 5:1 in 2020. Whilst Trump closed the gap in 2020 somewhat with free publicity from his controversial statements (something that is called earned media), the volume of Democrat material disseminated to voters was vastly more in 2020. In 2024 this gap was significantly narrowed to the point where, allowing for Trump’s natural publicity seeking antics, it is fair to say there was virtual parity for the first time in many election cycles,
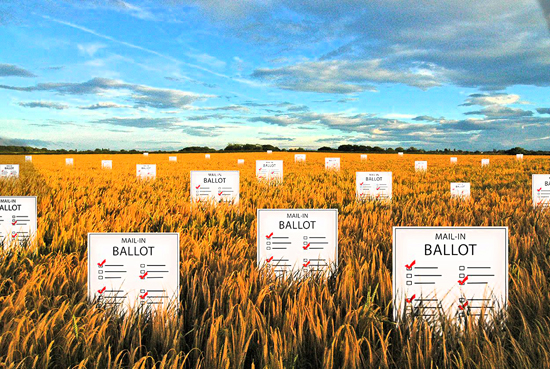
Ballot harvesting. There are legal variations as to the extent of ballot harvesting that can be done depending on relevant state law but regardless of that, in 2020 Republican campaigns engaged in zero ballot harvesting. That changed dramatically in 2024. Both the formal Trump campaign and various offshoots such as Charlie Kirk’s Turning Point Action and Scott Pressler hired hundreds of young people across most of the swing states to actively chase ballots. This was encouraging low propensity voters to register and vote early in states that allowed it and the chasing of high propensity voters on election day to ensure they voted. Each used sophisticated Apps that fed from real data from state election offices that identify voters yet to cast a vote by party affiliation where allowed. These groups wrung out 10,000’s of votes many of them from people who had either never voted or rarely voted. The most dramatic example of this was Pressler’s efforts just in Pennsylvania where he and his team registered 180,000 Amish! The Amish traditionally don’t vote but regulatory overreach by the Democrat administration in Pennsylvania in seizing and destroying raw milk so upset the Amish that they were propelled into political activism and voted en mass for Trump.
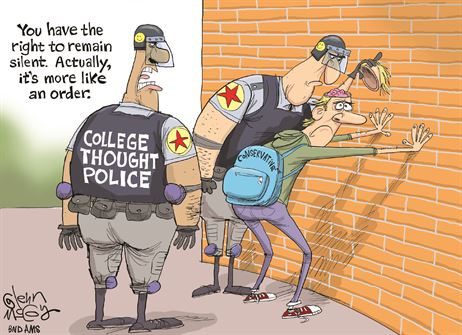
Campus outreach. Charlie Kirk, as a young 30-year-old articulate and knowledgeable debater, had for years visited large university campuses across America but in the run up to 2024, he ramped up his efforts. Often all it involved was setting up a TPUSA tent and advertising that he was there to answer any questions from student voters with a particular emphasis on Harris or non-committed voters. Kirk’s exchanges are legendary and as the swell of support for Trump grew, these events attracted thousands of students each time and Kirk gave away 1,000s of MAGA hats each time at literally hundreds of events over the years. Exit polls show that Trump made huge inroads into the Gen Z vote and won a plurality of Gen Z males, and this result was largely because of Charlie Kirk’s efforts, and this campus outreached was barely matched by the Democrats.
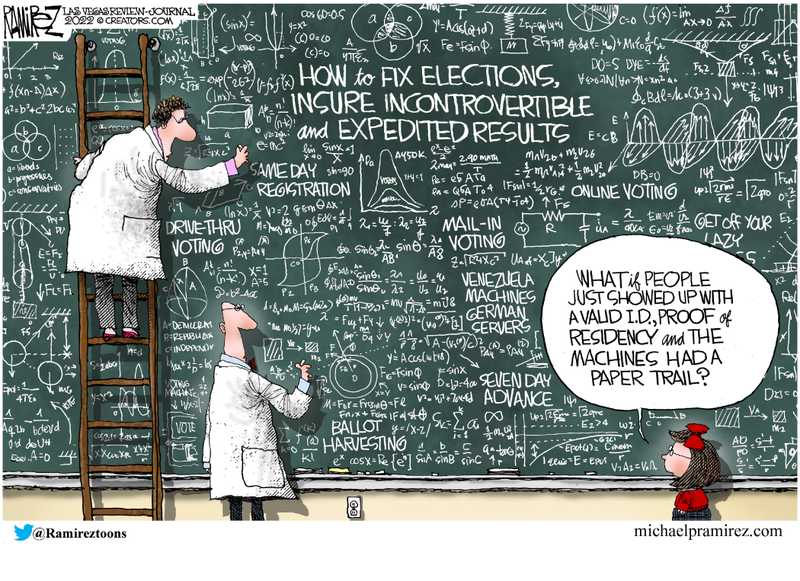
Defensive lawfare. Trump’s campaign in 2020 ran out of money 3 weeks out from the election for anything other than his huge rallies. Media advertising almost dried up and there was no money to pay lawyers to defend the vote from illegal actions by mostly Democrat election officials at the state and county level. In contrast, in 2024 a vast sum was spent recruiting hundreds of lawyers and hundreds of thousands of poll watchers and these lawyers were judiciously deployed in battleground states and were phenomenally successful. Various incidents cropped up in the weeks leading up to the election and on the day itself from shutting down early voting lines too early, to deliberately malfunctioning machines to barring Republican poll watchers. The lawyers were specific to each states’ election laws and swiftly intervened and the threat of legal action was often enough to get a behaviour change and when legal action made it to court, the well documented evidence was almost always sufficient to have a capricious and incorrect ruling or procedure overturned or aligned with state law. . .Whilst there was undoubtedly fraud in places on November 5th, this time it was far less impactful because of the aggressive defensive lawfare waged by the Trump campaign.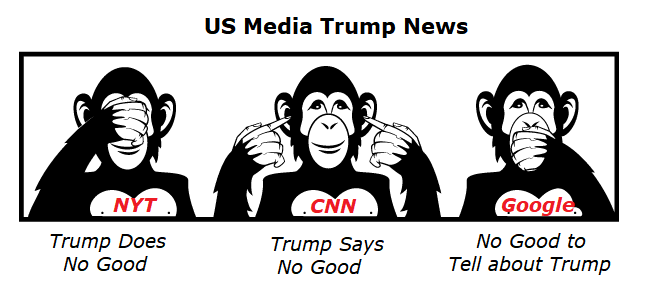
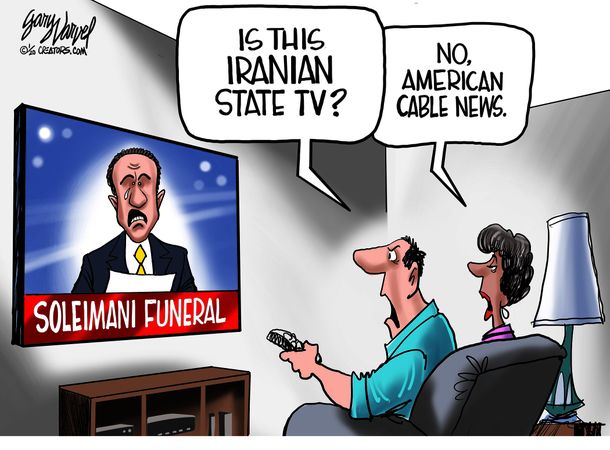
7. The fall of legacy media and the rise of alternative media
Donald Trump began labeling the mainstream media as fake news pretty early into his 2016 campaign. Since then, he has gone a step further and often called the MSM “the enemy of the people”. It has been known for many decades that the world’s legacy media generally have a liberal left leaning bias. For many years institutions like the big 3 US networks, Canada’s CBC, Britain’s BBC, Australia’s ABC and NZ’s TVNZ and RNZ journalists tried hard to hide their biases and reported the news in a more neutral and professional way.

But as time has gone by and as journalism schools have been churning out more and more ideologically activist and more overtly political graduates, the newsrooms of legacy media globally have become more openly biased and more nakedly partisan. Parties and politicians from the right are subjected to more slanted coverage, more hostile questioning and way more investigative scrutiny whilst favoured candidates and parties on the left increasingly face limited scrutiny, soft ball questions and outright suppression of news stories that might make them look bad.
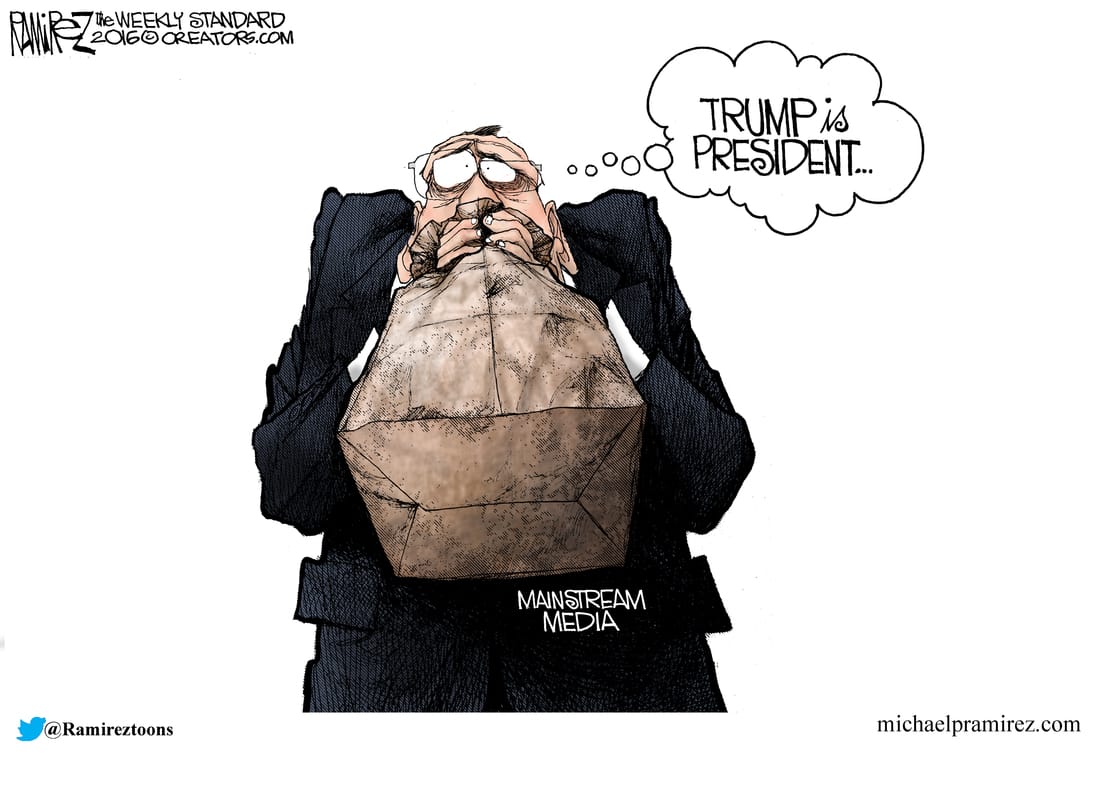
 But when Donald Trump came onto the political stage, he provoked a veritable firestorm of MSM opposition that has intensified and not abated. The MSM have rushed to cover hoax after hoax that initially made Trump look bad (I covered a bunch of these here). The US corporate media peddled the lies that Trump only won in 2016 with the help of Russia, they gleefully published lies of the 51 Democrat friendly intelligence experts who claimed Hunter Biden’s laptop was Russian disinformation and they lied about the origin of Covid and pilloried and banned people who said the virus originated from the Wuhan Institute of Virology. All these lies were eventually uncovered and debunked, but the media have continued to peddle any lie that makes Trump look bad. In the current Presidential campaign, this is but a sample of the massive anti-Trump pro-Kamala skewering that has occurred on MSM outlets:
* During the ABC sponsored debate between Trump and Harris, ABC executives agreed in advance to limit certain types of questions to Harris and stayed away from all ‘no-go’ topics as suggested by the Harris campaign. Trump was only asked questions of concern to Democrats and was subjected to attempts at real time fact checking by the moderators whilst ABC agreed in advance to no fact checking of Harris. It was obvious to even the most nonpartisan observer that Trump was debating not just Harris but the moderators as well.
* Harris’ 60 Minutes interview reached a new low of the MSM putting their thumb on the scales when they replaced a long rambling word salad nonsensical answer that Harris gave to a question posed about the administration’s response to the Gaza war with a more simple and rational answer that she gave in another part of the interview. That is extreme journalistic malpractice AND election interference that will have profound repercussions for CBS once Trump changes the partisan makeup on the FCC and FEC.

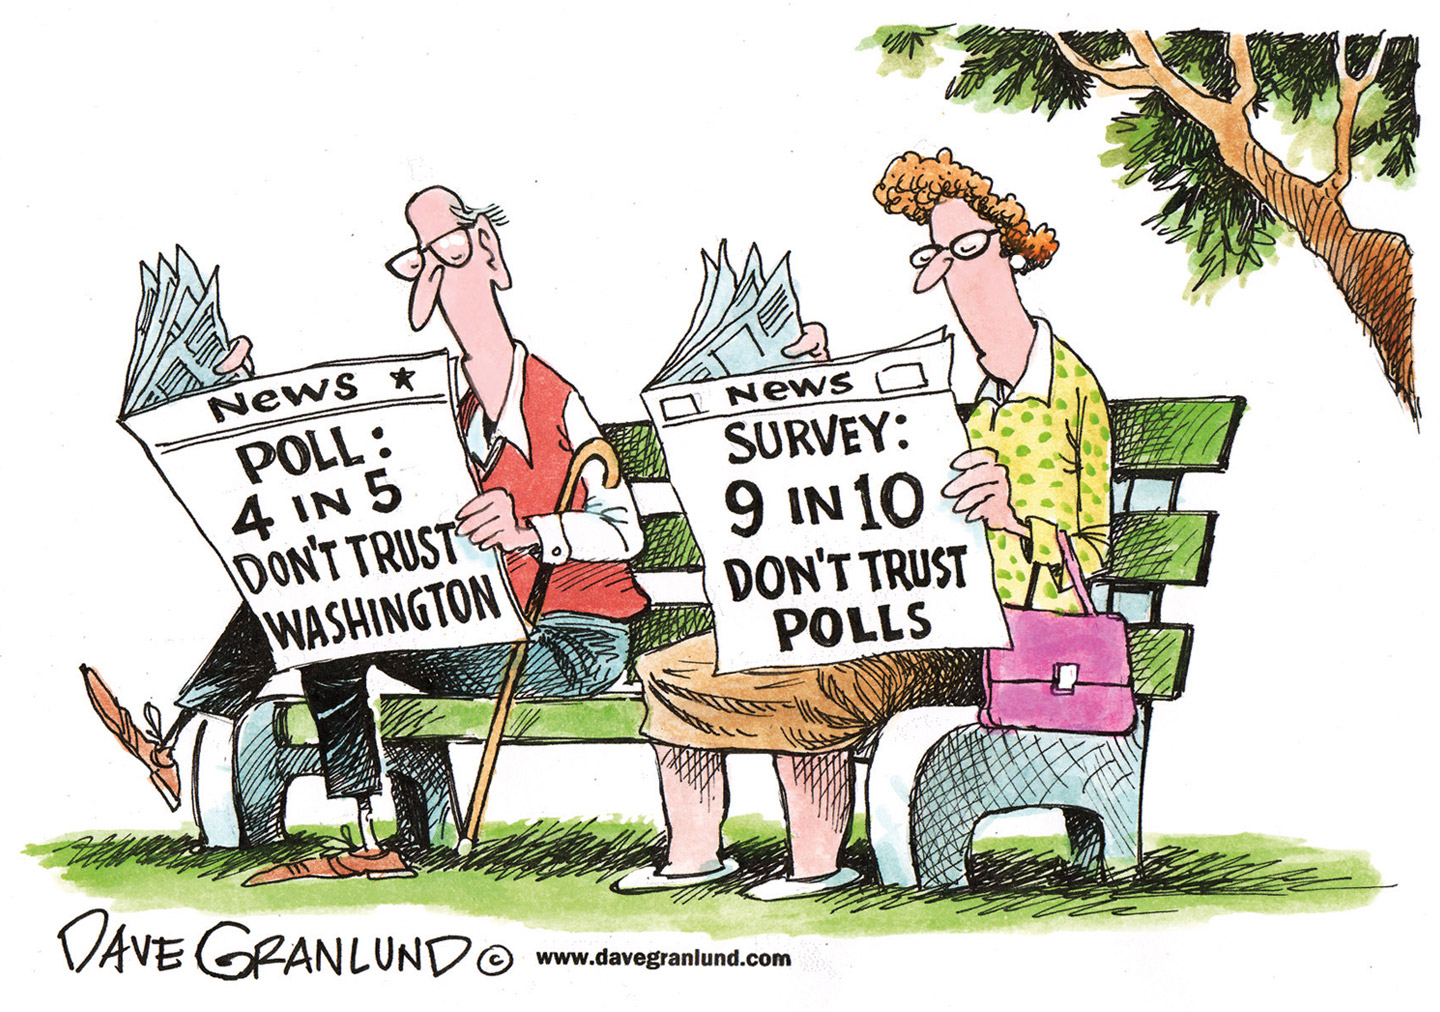
* The MSM are notorious for amplifying outlier polls that favoured Harris. Perhaps the most egregious example of this was the famous Des Moines Register poll by Ann Seltzer, considered by many as the gold standard of polls. Whilst Seltzer had a prior track record that has been pretty accurate, any polling expert could’ve told you that a poll showing Harris up 3 in Iowa when all other polls had Trump up by 7 to 10% (and the fact that Trump won Iowa by 11% and 8% in 2016 and 2020 and eventually won in 2024 by 13%!) was a dramatic outlier. But in the heat of the campaign with Trump tied in national polls and slightly up in swing state polls, the prospect of a hidden Harris blue wave was too tempting to pass up and so this poll was blasted from legacy media rooftops (and was even given prominence from our esteemed site owner Mr. Farrar perhaps because of his well-publicised disdain for DJT). The pollsters who picked Trump’s eventual result were ignored and even scoffed at. The pushing of outlier polls is a deliberate conservative voter suppression tactic engaged in on a regular basis by the MSM.
People aren’t stupid, they can see this bias and they react accordingly.
What has been the impact of the media’s descent from neutral, a-political, down the middle reporting to slanted, ideologically driven coverage and outright hostility to the GOP candidate for the most powerful office in the world?
* Gradual but accelerating ratings and subscription declines – more on that later.
* Decline in profitability – MSM newspapers like the Washington Post have laid off hundreds and look at the closing of TV3 and layoffs at TVNZ and Stuff in New Zealand.
* Slump in public trust as indicated in polls that show the MSM polling worse than Congress.
* A widespread belief that the MSM are biased against Trump and protecting Kamala has inevitably led to a rise in viewership of alternative media.
Into the void left by the increasing partisan legacy media has stepped a variety of conservative commentators who have been able to rack up substantial views and social media impressions that have come to swamp who views the legacy media. Many of the people I am about to mention have podcasts and shows that they broadcast from their websites, Twitter, Rumble and even mainstream social media platforms that regularly match and exceed even the major network news shows and far exceed equivalent shows on CNN and MSNBC. The biggest players on this list have audiences that vastly outstrip even the biggest MSM shows or podcasts.
Trump became very adept at using new media despite his age. His youngest son Barron, who is an 18-year-old college student in New York, mingles with all the big conservative Gen Z and Millennial influencers from the so-called Manosphere including Theo Von, the Nelk Boys, Adin Ross, Andrew Schulz and Shawn Ryan. Trump appeared on all their shows each with millions of views and came across as natural and funny to huge audiences of disaffected young males. Of course, the grand poohbah of the Manasphere is former UFC executive Joe Rogan whose centrist Spotify show has the biggest reach of any podcast in the world, each with an average viewing audience of 16 million. Trump’s famous 3-hour unscripted riff with Rogan where Rogan asked whatever questions he wanted (and Trump answered without ducking and diving) garnered across Spotify, You Tube and Twitter almost 100 million views! These appearances helped propel Trump to dominating the under 30 male vote in a way that Harris couldn’t come close.
The net effect of all of this: the Trump hating MSM are losing their grip on the narrative. Whilst they still have some influence, they are increasingly becoming a liberal echo chamber religiously watched mostly by left leaning true believers whilst Independents and right leaning folk are consuming their news from alternative sources that increasingly have a far greater reach then the legacy media. This played a vital role in Trump’s victory and his decisive win will only accelerate this decline unless the MSM return to their roots in reporting unbiased straight news and let go of the politically slanted advocacy that poses for news.
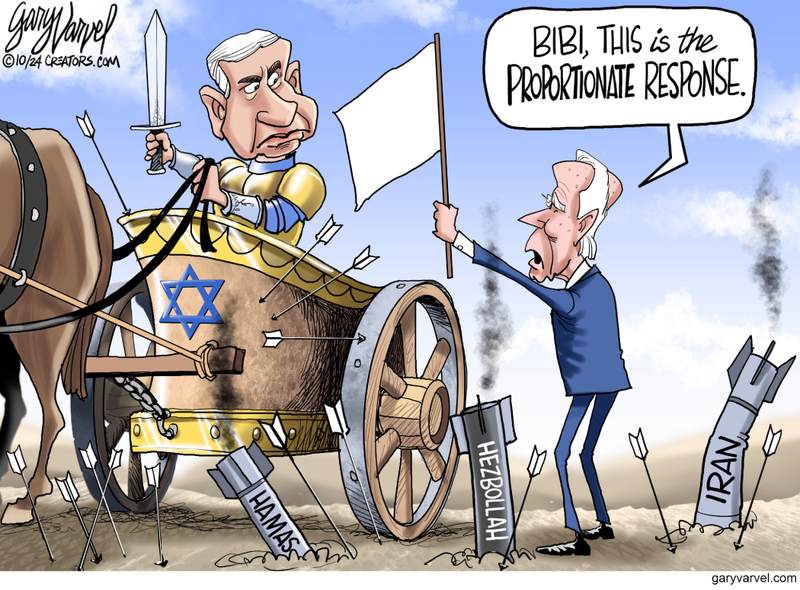
8. The proliferation of global conflicts
Trump is the first President in 40 years to not commence a new war. Reagan invaded Grenada, Bush 1 fought the Gulf War, Clinton attacked the former Yugoslavia, Bush 2 invaded Iraq and Afghanistan, Obama toppled Gaddafi and Biden has sent hundreds of billions to fund Ukraine. Trump withdrew troops from Iraq and laid the plans (that were massively cocked up by Biden) for an orderly withdrawal from Afghanistan. Trump negotiated and signed the Abraham Peace Accords ushering unprecedented diplomatic rapprochements between Israel and various Arab nations. Trump defused the escalating nuclear tension with North Korea all while getting NATO countries to pay their fair share of military expenditures.

More significantly is what Putin didn’t do during Trump’s 4 years. Under Obama he invaded Crimea and Georgia and under Biden, he invaded Ukraine. Putin made no territorial incursions under Trump. There was relative stability in the Middle East from 2017 to 2021. There is no way Hamas would’ve attempted their brazen infiltration into southern Israel under Trump and yet their actions under Biden have sparked the most prolonged and bloody conflict in Gaza and such tension and military retaliatory action with Iran as to see the whole region on the brink of war.
Biden’ poor handling of the Ukraine war, for a while, saw the very real threat of US and NATO boots on the ground in an escalation of the war between Ukraine and Russia. And if that isn’t enough, the Chinese also sensed Biden’s weakness and have threatened the sovereignty of Taiwan in a way that Xi never remotely attempted when Trump was in power.

The supreme irony in all this is that in 2016, the Democrats said that Trump would plunge the US into global wars and that his warmongering would lead to an unstable world. The truth was the opposite happened – Trump presided over a period of relative peace and only used US military muscle selectively to quickly destroy the ISIS Caliphate in Syria and Iraq, a task that eluded Obama for 8 years. It is Biden and his weakness as a leader that sees the world on fire and on the brink of something akin to WW3 and it is Trump who was and will be again the candidate for peace. The prospect of America’s sons fighting in the midst of a Slavic conflict thousands of miles from home was a motivation for some voters to hold their nose and vote for the man who sends mean Tweets.

In the two days since Trump was elected, Zelenskyy has called him, Putin has scheduled a call, Hamas is saying it will end the war, Qatar has asked Hamas’ leadership to leave and I’m guessing the Chinese won’t be trying any drills where they encircle the whole island of Taiwan any time soon.

9. The RFK Jr – Tulsi Gabbard coalition
I covered the positive political impact of RFK Jr’s endorsement here. Trump has brought into his inner circle three high profile Democrats: JFK Jr from the closest America gets to a political royal family, Tulsi Gabbard who once was deputy chair of the Democrat National Committee and ran for the Democratic nomination for President in 2020 and Elon Musk who publicly backed and donated to Democrat politicians for years. Each of these people brought key constituencies to Trump’s cause and, perhaps more importantly, they gave permission for centrists and moderate Democrats, disgusted by their own party’s decent into left wing identity politics but turned off by Trump’s bombastic and at times arrogant persona, to vote for Trump.
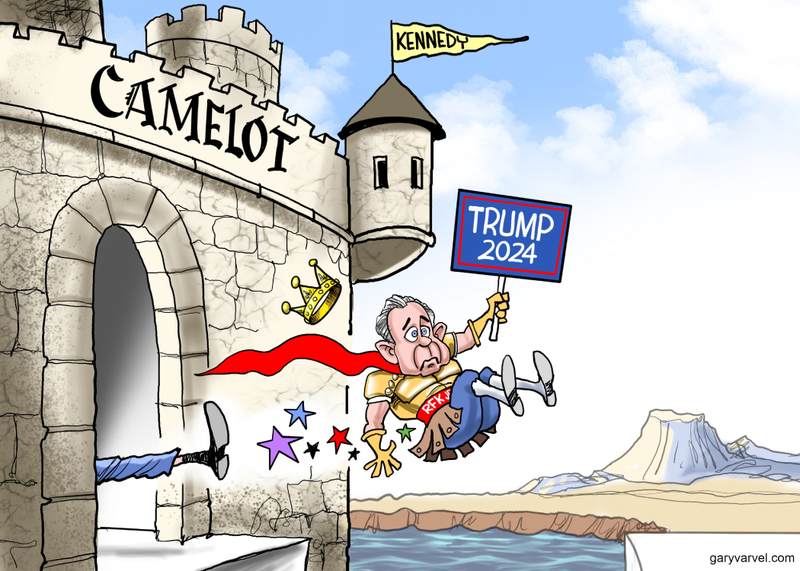
Joe Rogan (and many others) made the case that voting for Trump is not just about Trump but you’re voting for Tulsi, for RFK Jr and for the thousands of political appointees that will implement the policies that resonate with an actual majority of voters. Trump drove the Cheney’s, Mitt Romney and Adam Kinzinger to support Kamala and in exchange, he got Kennedy, Musk and Gabbard. I think that’s an awesome winning exchange and in the end, so did voters.
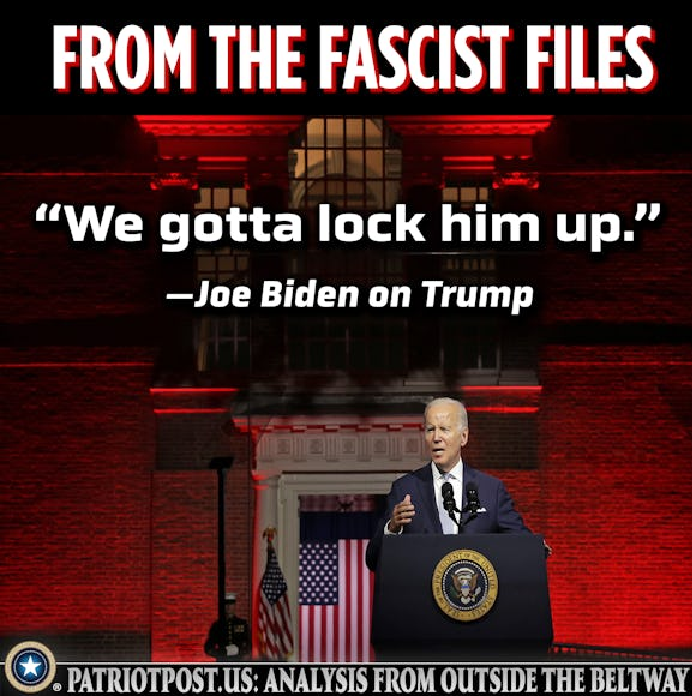
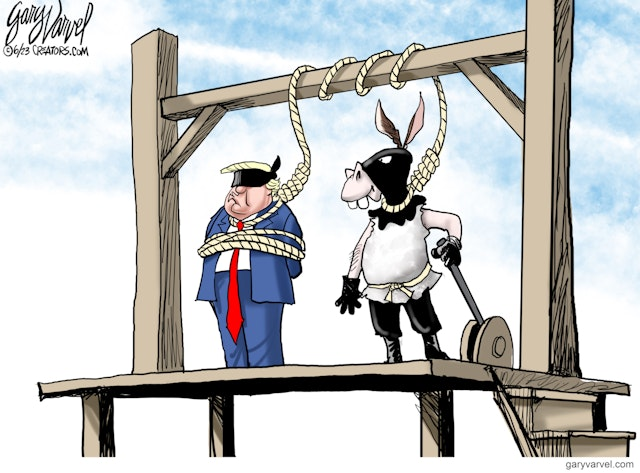
10. The lawfare and the assassination attempts against Trump backfired.
I covered this topic more extensively in these two posts. In summary, Trump’s opponents thought they had him on the ropes with all the various indictments when in actual fact, the politically motivated lawfare against Trump worked in his favour. When Fulton County District Attorney Fani Willis insisted Trump be arraigned in person at the County Jail in a seedy inner city part of Atlanta, Trump’s defiant mug shot became a viral sensation but, much more significantly, it helped cement Trump’s record level of black male support that helped propel him to victory in Michigan, Pennsylvania and Georgia. The footage of thousands of poor blacks lining the streets to the jail to cheer Trump as he exited the arraignment went viral in the African American community.
I don’t need to overstate the political impact of the two assassination attempts, most particularly the July 13th attempt at the rally in Butler, PA. The photo of a bloodied Trump with his raised pumped fist under a huge American flag ranks up there with the shot of Churchill’s VE Day speech to a monstrous crowd in London, the flag raising at Iwo Jima, John Kennedy Jr saluting his Dad JFK at his funeral, the fleeing Vietnamese refugees from the My Lai massacre in 1968 or the lone protestor holding up the tanks on Tiananmen Square. Trump’s pugnacious and defiant response reinforced his image as the ultimate alpha male in the eyes of millions and, whilst not intended nor sought after, became a major electoral plus for him.
Conclusion
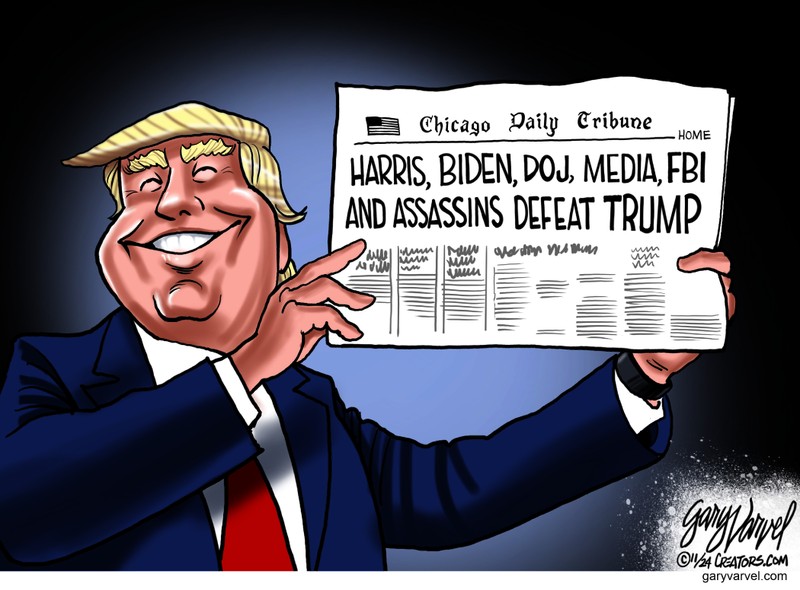
Whilst the electoral magnitude of Trump’s victory is not on the same scale as the two Reagan victories in 1980 and 1984 (489 to 49 and 525 to 13) nor the Nixon 1972 49 state sweep, nonetheless it will go down as one of the greatest comebacks in US political history given the unique nature of Trump and his experiences. His defeat in 2020 was shrouded in controversy with allegations (credible IMO) of election fraud that were of a magnitude that, in his mind and in the mind of many supporters, cost him the election. The events of January 6, 2021, came to overshadow and dominate Trump’s prospects with unprecedented levels of negative publicity aimed at Trump as his opponents sought to blame him for the events at the Capitol that day. He faced two impeachments, he was the subject of two Special Counsel enquiries, he was indicted 94 times on politically motivated charges (many of which will now melt away now that he has won and the rest will be reversed or die in appellate courts), the state of New York tried to bankrupt him and seize key properties, he has faced the most unrelenting media opposition of any politician, he faced two assassination attempts that came close to succeeding, frankly any other person would’ve given up. He faced a wall of negative media coverage of his campaign and fawning sycophantic coverage of his opponent, and countless attempts yet again at electoral fraud and he faced down the lot AND WON and won convincingly. It is a feat that may never be equaled in the annals of US political history!


 The building association worries the new energy code will raise the state’s already high housing costs, locking out potential buyers. The code requires that new buildings meet a certain environmental “score.” Without the points from an electric heat pump, a builder will have to make up the difference with other green measures that run between $15,000 and $20,000 in a single-family home. “Every time they raise the price $1,000, it prices out another 500 Washington families,” says Greg Lane, the association’s executive vice president.


 David Polansky is an American living in Canada (as am I) and expresses very clearly the frustration I share with him. His National Post article is