Wind Power Ripoff Ontario 2024 Update

Parker Gallant explains the cash flow and the grid decay in his blog article Industrial Wind Turbines demonstrate their Unreliable and Intermittent Nature From 2% to 80% of Capacity  H/T John Ray.  Excerpts in italics with my bolds and added images.

IWTs Generating 1.8% of their Capacity then jumping to 80.4% only a few days later

Yesterday, February 9th, 2024, those IWT spread throughout Ontario were impressive generating 94,605 MWh or about what 3.1 million average households would consume in a day suggesting they are the panacea to stop climate change!  Mere days before on February 3rd and the first seven hours on February 4th they generated only 2,673 MWh which was 1.8% of their capacity in those 31 hours.

As the expression goes; they continually demonstrate their “traditional yo yo” tendencies as the following screenshot from IESO February 5th to the 10th demonstrates. They are the “green” in the chart which basically shows their intermittent and unreliable nature whereas the dark blue is natural gas which has the ability to ramp up and down as demand changes and to keep our grid from failing and causing blackouts.

Wind in green, NatGas in dark blue, Hydro in light blue, Nuclear in orange

So, the question one should ask, was the power delivered by
those IWT on the 9th of February needed here in the province? 

As it turns out 65.8% of the IWT generation or 62,259 MW were not really needed as IESO’s intertie data (net-exports) shows it went to our neighbours in Quebec, New York and Michigan and the average sale price over the 24 hours was $19.42/MWh and well below what we Ontario ratepayers/taxpayers paid for it.  If we assume it was all surplus IWT generation those net-exports, we paid those contracted parties $135/MWh for; suggests the total cost of what was sold to our neighbours came to $8,404,965 but the price we were paid by our neighbours was an average of only that $19.42/MWh. Using the latter average price received over the 24 hours means we earned only $1,227,774!

The net result is we Ontario ratepayers/taxpayers have to eat the loss of $7,177,218 for just that one day’s IWT generation.  The foregoing is not the exception particularly when Ontario’s peak demand is relatively low as it was yesterday reaching only 17,057 MW at hour 19.

For the foregoing reasons, we should wonder why the Ontario Minister of Energy is instructing IESO to extend the IWT contracts when their 20-year terms are up as they do nothing but increase our electricity costs.  Those costs will be exacerbated by the addition of BESS (battery energy storage systems) as the latter will simply add another costly layer in an attempt to keep our grid reliable!

The IESO  current Contracted Generation List associated with BESS (battery energy storage systems) suggests they are expecting to contract for 1,140 MW!  BESS are able to provide their rated capacity for four hours meaning the 1,140 MW could provide 4,560 MW before needing to be recharged. It is humorous the megawatts those BESS units may be able to provide is only slightly more then the IWT provided during their peak generation hour yesterday. Today (Feb. 19) at Hour 9 those IWT only generated 316 MW!

At this point we should wonder if the batteries to be utilized by those BESS contracted generators will include CATL batteries, manufactured in China and now banned in the USA as pointed out in a recent article. If so, Canada could be in trouble with its neighbour, the USA, who have security concerns about CATL batteries. That may have a negative impact on our intertie connections with US States, amusingly, where much of our surplus IWT generation went to yesterday!

Oh, what tangled webs we weave!

Footnote More Grid Corrosion from Wind and Solar

Not mentioned above is a slow deterioration of baseload electricity because of renewables  unreliables.  Gail Tverberg explains in the background post below:

In fact, I have come to the rather astounding conclusion that even if wind turbines and solar PV could be built at zero cost, it would not make sense to continue to add them to the electric grid in the absence of very much better and cheaper electricity storage than we have today. There are too many costs outside building the devices themselves. It is these secondary costs that are problematic. Also, the presence of intermittent electricity disrupts competitive prices, leading to electricity prices that are far too low for other electricity providers, including those providing electricity using nuclear or natural gas. The tiny contribution of wind and solar to grid electricity cannot make up for the loss of more traditional electricity sources due to low prices.

Climateers Tilting at Windmills Updated


El Nino Keeps Ocean Warm January 2024

The best context for understanding decadal temperature changes comes from the world’s sea surface temperatures (SST), for several reasons:

  • The ocean covers 71% of the globe and drives average temperatures;
  • SSTs have a constant water content, (unlike air temperatures), so give a better reading of heat content variations;
  • Major El Ninos have been the dominant climate feature in recent years.

HadSST is generally regarded as the best of the global SST data sets, and so the temperature story here comes from that source. Previously I used HadSST3 for these reports, but Hadley Centre has made HadSST4 the priority, and v.3 will no longer be updated.  HadSST4 is the same as v.3, except that the older data from ship water intake was re-estimated to be generally lower temperatures than shown in v.3.  The effect is that v.4 has lower average anomalies for the baseline period 1961-1990, thereby showing higher current anomalies than v.3. This analysis concerns more recent time periods and depends on very similar differentials as those from v.3 despite higher absolute anomaly values in v.4.  More on what distinguishes HadSST3 and 4 from other SST products at the end. The user guide for HadSST4 is here.

The Current Context

The chart below shows SST monthly anomalies as reported in HadSST4 starting in 2015 through December 2023.  A global cooling pattern is seen clearly in the Tropics since its peak in 2016, joined by NH and SH cycling downward since 2016.

Note that in 2015-2016 the Tropics and SH peaked in between two summer NH spikes.  That pattern repeated in 2019-2020 with a lesser Tropics peak and SH bump, but with higher NH spikes. By end of 2020, cooler SSTs in all regions took the Global anomaly well below the mean for this period.  

Then in 2022, another strong NH summer spike peaked in August, but this time both the Tropic and SH were countervailing, resulting in only slight Global warming, later receding to the mean.   Oct./Nov. temps dropped  in NH and the Tropics took the Global anomaly below the average for this period. After an uptick in December, temps in January 2023 dropped everywhere, strongest in NH, with the Global anomaly further below the mean since 2015.

Then came El Nino as shown by the upward spike in the Tropics since January, the anomaly nearly tripling from 0.38C to 1.09C.  In September 2023, all regions rose, especially NH up from 0.70C to 1.41C, pulling up the global anomaly to a new high for this period. But then in October anomalies in all regions started dropping down bringing down the Global anomaly.  By December, NH cooled to 1.1C and the Global anomaly down to 0.94C from its peak of 1.10C, despite slight warming in SH and Tropics.

Now in January both Tropics and SH rose, resulting Global Anomaly going higher. Tropics anomaly reached a new peak of 1.29C. Note that all ocean regions are now higher than 01/2016, the previous peak.

Comment:

The climatists have seized on this unusual warming as proof of their Zero Carbon agenda, without addressing how impossible it would be for CO2 warming the air to raise ocean temperatures.  It is the ocean that warms the air, not the other way around.  Recently Steven Koonin had this to say about the phonomenon confirmed in the graph above:

El Nino is a phenomenon in the climate system that happens once every four or five years.  Heat builds up in the equatorial Pacific to the west of Indonesia and so on.  Then when enough of it builds up it surges across the Pacific and changes the currents and the winds.  As it surges toward South America it was discovered and named in the 19th century  It is well understood at this point that the phenomenon has nothing to do with CO2.

Now people talk about changes in that phenomena as a result of CO2 but it’s there in the climate system already and when it happens it influences weather all over the world.   We feel it when it gets rainier in Southern California for example.  So for the last 3 years we have been in the opposite of an El Nino, a La Nina, part of the reason people think the West Coast has been in drought.

It has now shifted in the last months to an El Nino condition that warms the globe and is thought to contribute to this Spike we have seen. But there are other contributions as well.  One of the most surprising ones is that back in January of 2022 an enormous underwater volcano went off in Tonga and it put up a lot of water vapor into the upper atmosphere. It increased the upper atmosphere of water vapor by about 10 percent, and that’s a warming effect, and it may be that is contributing to why the spike is so high.

A longer view of SSTs

To enlarge, open image in new tab.

The graph above is noisy, but the density is needed to see the seasonal patterns in the oceanic fluctuations.  Previous posts focused on the rise and fall of the last El Nino starting in 2015.  This post adds a longer view, encompassing the significant 1998 El Nino and since.  The color schemes are retained for Global, Tropics, NH and SH anomalies.  Despite the longer time frame, I have kept the monthly data (rather than yearly averages) because of interesting shifts between January and July. 1995 is a reasonable (ENSO neutral) starting point prior to the first El Nino. 

The sharp Tropical rise peaking in 1998 is dominant in the record, starting Jan. ’97 to pull up SSTs uniformly before returning to the same level Jan. ’99. There were strong cool periods before and after the 1998 El Nino event. Then SSTs in all regions returned to the mean in 2001-2. 

SSTS fluctuate around the mean until 2007, when another, smaller ENSO event occurs. There is cooling 2007-8,  a lower peak warming in 2009-10, following by cooling in 2011-12.  Again SSTs are average 2013-14.

Now a different pattern appears.  The Tropics cooled sharply to Jan 11, then rise steadily for 4 years to Jan 15, at which point the most recent major El Nino takes off.  But this time in contrast to ’97-’99, the Northern Hemisphere produces peaks every summer pulling up the Global average.  In fact, these NH peaks appear every July starting in 2003, growing stronger to produce 3 massive highs in 2014, 15 and 16.  NH July 2017 was only slightly lower, and a fifth NH peak still lower in Sept. 2018.

The highest summer NH peaks came in 2019 and 2020, only this time the Tropics and SH were offsetting rather adding to the warming. (Note: these are high anomalies on top of the highest absolute temps in the NH.)  Since 2014 SH has played a moderating role, offsetting the NH warming pulses. After September 2020 temps dropped off down until February 2021.  In 2021-22 there were again summer NH spikes, but in 2022 moderated first by cooling Tropics and SH SSTs, then in October to January 2023 by deeper cooling in NH and Tropics.  

Now in 2023 the Tropics flipped from below to well above average, while NH has produced a summer peak extending into September higher than any previous year. In fact, October and now November are showing that this number is likely the crest, despite El Nino driving the Tropics anomaly close to 1998 and 2015 peaks.

What to make of all this? The patterns suggest that in addition to El Ninos in the Pacific driving the Tropic SSTs, something else is going on in the NH.  The obvious culprit is the North Atlantic, since I have seen this sort of pulsing before.  After reading some papers by David Dilley, I confirmed his observation of Atlantic pulses into the Arctic every 8 to 10 years.

Contemporary AMO Observations

Through January 2023 I depended on the Kaplan AMO Index (not smoothed, not detrended) for N. Atlantic observations. But it is no longer being updated, and NOAA says they don’t know its future.  So I find that ERSSTv5 AMO dataset has data through October.  It differs from Kaplan, which reported average absolute temps measured in N. Atlantic.  “ERSST5 AMO  follows Trenberth and Shea (2006) proposal to use the NA region EQ-60°N, 0°-80°W and subtract the global rise of SST 60°S-60°N to obtain a measure of the internal variability, arguing that the effect of external forcing on the North Atlantic should be similar to the effect on the other oceans.”  So the values represent sst anomaly differences between the N. Atlantic and the Global ocean.

The chart above confirms what Kaplan also showed.  As August is the hottest month for the N. Atlantic, its varibility, high and low, drives the annual results for this basin.  Note also the peaks in 2010, lows after 2014, and a rise in 2021. Now in 2023 the peak was holding at 1.4C before decling.  An annual chart below is informative:

Note the difference between blue/green years, beige/brown, and purple/red years.  2010, 2021, 2022 all peaked strongly in August or September.  1998 and 2007 were mildly warm.  2016 and 2018 were matching or cooler than the global average.  2023 started out slightly warm, then rose steadily to an  extraordinary peak in July.  August to October were only slightly lower, but by December cooled by ~0.4C. January 2024 is unchanged from the previous month.

The pattern suggests the ocean may be demonstrating a stairstep pattern like that we have also seen in HadCRUT4. 

The purple line is the average anomaly 1980-1996 inclusive, value 0.18.  The orange line the average 1980-202306, value 0.38, also for the period 1997-2012. The red line is 2013-202306, value 0.64. As noted above, these rising stages are driven by the combined warming in the Tropics and NH, including both Pacific and Atlantic basins.

Curiosity:  Solar Coincidence?

The news about our current solar cycle 25 is that the solar activity is hitting peak numbers now and higher  than expected 1-2 years in the future.  As livescience put it:  Solar maximum could hit us harder and sooner than we thought. How dangerous will the sun’s chaotic peak be?  Some charts from spaceweatherlive look familar to these sea surface temperature charts.

Summary

The oceans are driving the warming this century.  SSTs took a step up with the 1998 El Nino and have stayed there with help from the North Atlantic, and more recently the Pacific northern “Blob.”  The ocean surfaces are releasing a lot of energy, warming the air, but eventually will have a cooling effect.  The decline after 1937 was rapid by comparison, so one wonders: How long can the oceans keep this up? And is the sun adding forcing to this process?

Space weather impacts the ionosphere in this animation. Credits: NASA/GSFC/CIL/Krystofer Kim

Footnote: Why Rely on HadSST4

HadSST is distinguished from other SST products because HadCRU (Hadley Climatic Research Unit) does not engage in SST interpolation, i.e. infilling estimated anomalies into grid cells lacking sufficient sampling in a given month. From reading the documentation and from queries to Met Office, this is their procedure.

HadSST4 imports data from gridcells containing ocean, excluding land cells. From past records, they have calculated daily and monthly average readings for each grid cell for the period 1961 to 1990. Those temperatures form the baseline from which anomalies are calculated.

In a given month, each gridcell with sufficient sampling is averaged for the month and then the baseline value for that cell and that month is subtracted, resulting in the monthly anomaly for that cell. All cells with monthly anomalies are averaged to produce global, hemispheric and tropical anomalies for the month, based on the cells in those locations. For example, Tropics averages include ocean grid cells lying between latitudes 20N and 20S.

Gridcells lacking sufficient sampling that month are left out of the averaging, and the uncertainty from such missing data is estimated. IMO that is more reasonable than inventing data to infill. And it seems that the Global Drifter Array displayed in the top image is providing more uniform coverage of the oceans than in the past.

uss-pearl-harbor-deploys-global-drifter-buoys-in-pacific-ocean

USS Pearl Harbor deploys Global Drifter Buoys in Pacific Ocean


What Big Climate Wants to Censor

(Photo by Craig Barritt/Getty Images for Oceana)

Nick Pope writes at Daily Caller Foreign Billionaire-Backed Climate Org Pressuring Broadcasters To Censor Ads Critical Of Biden’s EV Mandate.  Excerpts in italics with my bolds and added images.

A green nonprofit that is indirectly funded by a foreign billionaire is pressuring broadcasters to drop advertisements that criticize the Biden administration’s massive electric vehicle (EV) agenda.

Climate Power wrote to numerous broadcasters this week demanding that they stop airing American Fuel and Petrochemicals Manufacturers (AFPM)-funded advertisements in swing state markets that rail against President Joe Biden’s plans to impose widespread EV adoption in the coming years. The charitable organization affiliated with Hansjorg Wyss, a Swiss health care mogul and billionaire philanthropist, donates millions of dollars to the Fund for a Better Future, which was the fiscal sponsor for Climate Power until 2023, a spokesperson for Climate Power previously told the Daily Caller News Foundation.

AFPM launched its seven-figure ad campaign designed to highlight and criticize the administration’s EV policies on Tuesday. The ads, which describe Biden’s policies as an EV mandate, are airing in Pennsylvania, Wisconsin, Michigan, Nevada, Arizona, Ohio, Montana and Washington, D.C.

Climate Power’s warning letter to local affiliates states that the broadcasters “must remove these ads from the air immediately” because “there is no pending federal ‘car ban,’ and to claim otherwise is patently false and intentionally misleading.” The letter suggests that AFPM’s ads could be in violation of Federal Communications Commission (FCC) rules, and instructs the broadcasters to contact Climate Power — an Internal Revenue Service-recognized 501(c)4 that is spending more than $80 million to tout Biden’s climate policies ahead of the 2024 presidential election — to confirm that the ads are no longer running on their stations.

What Big Climate Wants to Hide

A recent Wall Street Journal video says it out loud: EVs are not practical for most people.  The short video can be seen here.  A transcript is below for those who prefer to read.

Hertz announced last week that it is selling one third of its EV fleet, about 20.000 vehicles, and will replace them with gas powered cars, citing weaker demand for electrics and their higher operating and repair costs. The car rental giant had previously vowed to convert 25% of its fleet to electric by the end of 2024. In an interview in Davos this week, President Biden’s soon to be former climate envoy,

John Kerry, blamed recent setbacks in the industry on electric car critics,
accusing them of engaging in “high levels of disinformation.”

Kerry also told the panel at the World Economic Forum that the green energy transition will continue no matter who wins the 2024 presidential race. “You think those CEOs are gonna say, Oh My God, they just elected a new president. Let’s go back and build internal combustion engine cars. Not on your life. This economic revolution is underway and it’s much bigger than any politician, any one person.”

We’re back with Dan Henniger, Kim Strassel, and Wall Street Journal columnist, Allysia Finley. So Allysia, also this week Ford announced that it is cutting back on production of its Lightning 150 electric trucks. So this is a pretty broad cutback in production.

Well, the biggest reason is there’s flagging demand. So there were a lot of, “early adopters. It was people who lived in California and big cities who bought EVs. Especially Teslas which make up about 60% of sales. And so there was a big rush of automakers, and partly propelled by the government mandates, both California’s Air Resources Board and the Biden administration’s coming mandate, which ratchets up to two thirds of all sales to be EVs by 2032.

And so they all rushed in, they started mass producing EVs. And all of a sudden they’re realizing demand’s actually softening for the mainstream public because they’re actually not ready.

And suffering difficulties. And what we saw in Chicago with the lines of people and the cold weather.  It’s cold weather and EVs don’t really work in the north very well. It’s repair costs. So it’s not easy to go long distances. It’s charging station availability, and people want sometimes to go long distances. Are those the reasons consumers are resisting?

I mean the costs are still about $20,000 higher on average, and the have to factor repair costs, yes. But also insurance costs, which are about 20% higher. In part because they’re more expensive, but also because the replacement parts are more expensive. And so they’re just not really practical for most people. This isn’t to say that someday then they’ll be much more practical and popular.

Maybe, but it doesn’t make sense to be mandating and subsidizing them at this juncture. Dan, what do you make of John Kerry’s line that this reluctance is just all disinformation by critics?

When Kerry said that, I thought he might take a side trip from Davos, Switzerland, to Germany to see what’s happening with EVs there. In December EV sales in Germany dropped by 50%. The auto industry there is really on the brink of collapse because people are simply not buying electric vehicles. And as Allysia was just describing, it that happens here, and it could, people simply say, “I’m not gonna put up , Ford and GM are really gonna get strung out and hit hard by the refusal of people.

Allysia, the one thing Kerry has going for his prediction is EVs which are being mandated by the government is that the flow of money from the Inflation Reduction Act will be so great, how much money they’re throwing at charging stations and subsidies for consumers and subsidies for production. It’s astonishing, even subsidies for batteries. Will that ultimately push EVs over the top?

Well, that is the risk in my mind, that consumers at the moment don’t want them. But the plan on the left is always that you get something in motion, you make the industry change its standards and retool and regear itself toward this goal. You put money out there as incentive for them to keep doing it and for buyers to get them. And then you can’t reverse it.

And you hope that it trundles along of its own accord. Which is why there’s growing attention in Washington, especially among Republicans, that if they’re going to try to claw back money, it ought to be more out of this area. Because if they really do care about issues like consumer choice, giving people the ability to drive what they want to drive, you’ve got to remove this government distortion that is creating this supposed economic revolution.

It’s not an economic revolution, it’s a government imposed transition.

Allysia, you wrote an interesting column about how CEOs not too long ago were cheering on this and all thinking alike about the great EV future. One of those was the Hertz CEO, another one, the Ford CEO. Are they really having second thoughts?

Well, it’s funny now in recent months, they’ve all been coming out saying, “Oh well, we need to cut production”, and “This is just not sustainable.” Across the industry, they’re definitely having second thoughts, and some of their statements are more public than others. And they’re pleading to the administration. Again this is representative of the auto industry, not the individual automakers, but they’ve sent a letter saying, please, we cannot do this. These aggressive goals are not achievable and auto workers would lose their jobs.

Climatists Mistake Means for Ends

Roy Gilbert exposes the fundamental mistaken thinking regarded global warming/climate change.  His Spectator Australia article is Conceptual Error in Climate Change Analysis.  H/T John Ray  Excerpts in italics with my bolds and added images.

It is often said that the ‘science is in on climate change’. Is it? We should always adhere to the principle of the ‘working hypothesis’ and have an open mind on scientific questions no matter how well-recognised the researchers are. In the study of science, there is always the chance new information can come along to cause a rethink.

A common error in problem-solving and policy development is to confuse
a technical strategy for a desired client outcome.

Our Climate Change Minister could be accused of this. Reducing emissions is a ‘strategy’, not the fundamental desired client outcome. With the mission ‘to reduce carbon emissions’ by increasing renewable energy, the way to assess performance is to concentrate on measuring emission reduction, and then to follow this up with how quickly the renewables are built and their cost (wind farms, solar panels, transmission lines).

Instead of the current strategy-driven mission, a fundamental client outcome statement would be:To protect against, and where possible, prevent damage from extreme off-trend fluctuations in climate.’ How would you go about managing your program using this mission statement?

First, you gather accurate temperature, rainfall, and weather measurements. They are the valid and fundamental ‘outcome’ measures – not data on CO2 emissions. If there is an undeniable and dangerous increase in temperature and rainfall, more cyclones, and a clear and unabated rise in sea level, then the possible cause must be thoroughly identified. Depending on the answer, you would adopt appropriate mitigation strategies, or strategies that adapt to weather patterns and temperature levels.

Another principle of problem-solving is to map out the total picture and not be driven by ideology. The Climate Change Minister should consider possible causes other than human-induced emissions. It was announced in April 2023 that coronal cones 20 times larger than Earth have been discovered and may cause a massive outburst of energy from the sun. What could be the implications for our planet? Ask solar physicists.

Chief scientist in applied helio-physics at John Hopkins, Ian Cohen, has suggested that solar storms could take out satellites, cut power and shut down the internet. In 1972 a solar storm caused 4,000 magnetically sensitive mines in water off Vietnam to detonate. Earth is said to be entering a period of peak activity as part of an eleven-year cycle. It is suggested this potentially could be more violent than the solar cycles of the past three decades. Now that would be something for climate scientists to really worry about…

With respect to the world’s temperature, there are several sources that claim to present the precise figure. One says the 2023 average global temperature was 1.45c above the 1950-90 average. Another says since 1880, Earth’s temperature has increased by 0.08c. Another says during the last 50 years the increase is 0.13c. To the unscientific mind, these temperatures do not appear to be verging on catastrophic boiling us all to death.

As of 2024, data on natural changes in temperature, rainfall, and sea level
do not show any statistically significant difference to historical records.

There are respected scientists who question the current climate orthodoxy. Physicist Prof. William Happer of Princeton University and Prof. Richard Lindzen, Earth, Atmospheric and Planetary Sciences at MIT have argued science demonstrates there is no climate-related risk caused by fossil fuels and CO2, and that 600 million years of CO2 and temperature data contradicts the theory that high levels of CO2 will cause catastrophic global warming. They state reliable scientific theories come from validating theoretical predictions with observations, not consensus, peer review, government opinion, or manipulated data.

In July 2023, the International Monetary Fund cancelled a planned talk on climate change by 2022 Nobel physicist John Clauser when they learned he had stated publicly: ‘I can confidently say there is no real climate crisis, and that climate change does not cause extreme weather events. The IPCC is one of the worst sources of dangerous disinformation.’  Clauser pointed out that the US Environmental Protection Authority has charts that show a heatwave Index going back to 1895, showing heatwaves were more common before the 1960s and especially in the 1930s.

In addition to these physicists, there are eminent Australian geologists who challenge the CO2 cause theory. Emeritus Prof. Ian Pilmer of the University of Melbourne, and Prof. Michael Asten of Monash University, have argued that throughout the history of the planet, there have been long periods of major change in climate due to natural forces. This would indicate recent human-based emissions may not be the important factor that we have been led to believe.

With respect to measuring emissions (nitrous oxide and methane), there is an expectation that the Intergovernmental Panel on Climate Change would have collected accurate data. Then one reads an independent 2023 report of these greenhouse gas emissions from farm dams in Australia’s irrigation regions, that the measurements had been massively over-estimated by the IPCC by 4 to 5 per cent.

To add further confusion to the issue, a 2023 research paper submitted to the European Physical Journal Plus claimed climate science has become ‘highly politicised’. Italian scientists analysed long-term data on heat, droughts, floods, hurricanes, tornadoes, and ecosystem productivity, and found no clear trend of extreme events. The statements by these scientists would appear worthy of examination. Unfortunately, comments to the publisher by other climate scientists caused the withdrawal of the article.

If activists are correct, and if temperatures and rainfall start to show a significant increase without any influence from natural factors such as the sun or outer atmospheric disturbances, the second ‘outcome’ mission opens your mind to several strategies that could be compared against each other on cost and effectiveness – renewables, outer space satellites capturing solar energy and transmitting to Earth, small nuclear, carbon capture, examine possibility of amalgamating carbon and turning it into a useful product, lower emission coal-fired power stations, hydro, hydrogen fuel cells, a scientific search for a predator for carbon other than trees (or the planting of more trees), and so on.

A valid client ‘outcome’ statement encourages you not to jump to a conclusion
in the initial stages of critical thinking about the cause of any global warming.

If you make a mistake at that point, there are significant productivity implications. Governments could waste a significant amount of money (a catastrophic amount) on a less than optimum strategy. Rather than relying almost entirely on climate scientists who concentrate on carbon emissions, a politician with a mind focused on validity could bring together an inter-disciplinary team – climate scientists, nuclear physicists, solar physicists, atmospheric physicists, examine the moon’s behaviour, plant technologists, oceanographers, geologists, volcanologists, botanists, bushfire specialists and so on. Has any national government followed this approach? Has any Minister for Energy, in any country, expanded their vision beyond their own narrow ideology is a potential danger to their country…?

There are very obvious reasons why some politicians and many rich investors in renewable energy would oppose a serious questioning of the renewable strategy and switching to nuclear instead. If small nuclear was introduced – as is being done in many countries – it would make current renewable energy strategies redundant. That would mean all the billions of dollars spent on wind and solar would have been a waste of money. We wouldn’t need them. Admitting that would be far too embarrassing for any ideological politician and far too financially damaging to any rich wind farm investor obtaining government grants.

If the Sun is found to be the fundamental cause of the problem (variations in energy output, massive infrequent solar flares, and/or variations in distance between Earth and Sun), or if there is a slight tilting of the Earth on its axis, or the Moon changes position, or even disturbance further out in our solar system, you would evaluate adaptation strategies.

It seemed reasonable for some people to assume the vast flooding in 2022 could be attributed to human-induced climate change. There is however, a different possibility … nature. Environment analyst Graham Lloyd explained.

‘The meteorological processes at play are well understood. Three consecutive La Nina weather patterns have left the eastern seaboard soaked and prone to flooding. Triple La Ninas have happened four times in the Bureau of Meteorology’s 120-year record … The Southern Annular Mode is a climate driver that can influence rainfall and temperature. Although wet, the latest BoM figures show that 2022 was the ninth wettest year on record (not the wettest).’

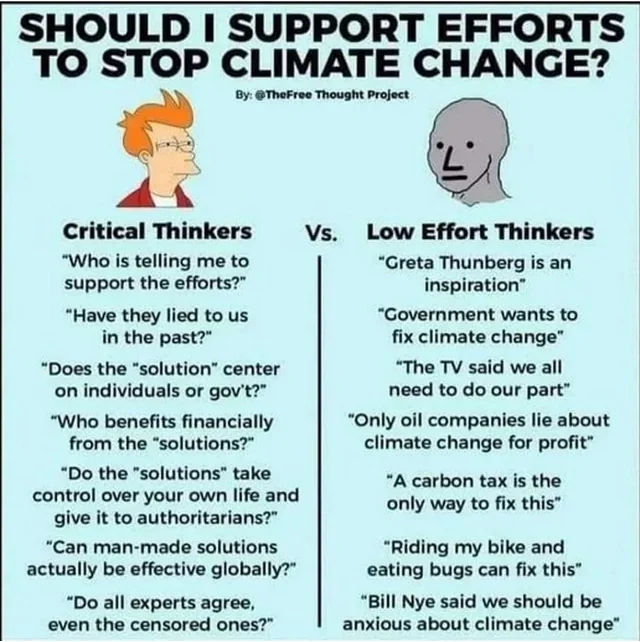
fWhen the above material, stressing the need to examine the total picture in any critical thinking, was shown to a high school Principal, to a high school science teacher and to an environmental engineer, they were all surprised and quite critical that one would want to show this to students. Annoyed actually. One was emphatic…

‘Why waste the students’ time having them look at irrelevant issues?
We KNOW what the problem is. It is CO2 emissions.
And we KNOW what the solution is. It is 100 per cent renewables.’

My answer to them was:

‘The difference between you and me, is that you want to tell the students WHAT to think. I want to teach them HOW to think. I want them to understand insightful thinking. Not to be indoctrinated’.  You can be the judge as to who is on the right track.

See Also

Answers Before Climate Action


Why Oranges Disprove Global Warming 2024

Paul Noel writes at Quora in response to a question: What are the best arguments of the movement “global warming deniers” to back their version of the story? Excerpts in italics with my bolds.

Well since this question has only been answered by those who want to say no such science exists It has to be answered.

Here is an absolute proof that there is no global warming going on. It absolutely has no denial possible.

In 1899 there was a large swath of the Southern USA that was used for Commercial Citrus Growing. Citrus Trees do not tolerate hard freezing. In fact they are tropical plants with only very slight ability to withstand freezing conditions. Their fruit is even more tender, and so a Commercial Producer cannot tolerate any significant extended freezing. In Florida for example the Citrus producers have methods to withstand FROST. These are pretty amazing. (See photo above)

They literally spray their trees with water so that as the water freezes it prevents the citrus from freezing as the sugar content keeps the freezing point slightly lower than water. This method only works against light freezes of short duration. It often results in having to sell the crop in a rush to juice operations at loss of value.

So Citrus Commercial Production is prevented in all but areas with 365 day growing seasons.

The large swath of growing included about 1/2 of eastern Texas essentially south of Tyler Texas. It included almost all of Louisiana south of Interstate 20. It included Most of Mississippi south of Jackson and across Alabama up to Evergreen. It then extended across Georgia essentially from Columbus to Augusta and then up South Carolina all the way to North Carolina and a coastal strip of North Carolina up to almost Virginia. It also included All of Florida.

Basically this map shows in Zone 8b and slightly into Zone 8a the region that used to raise citrus. Today none can be raised outside of Zone 9b or higher. Actually the only safe in zone 10.

Today due to severe cooling of the environment, it only includes 4 of the most southern counties along the Rio Grande Valley in Texas and the southern part of Florida. Over the past 120 years, this has almost deleted Citrus growing from much of the southern part of North America.

This is the remaining Florida range of Citrus.

There is no remaining commercial citrus in Louisiana, Mississippi, Alabama, Georgia, South Carolina or North Carolina.

Now if you were to pick any location that was better for determining the global temperature you could not do it. This is the focal point for all of the global heat circulation of the world’s oceans. The heat focuses on the Yucatan Channel, goes through into the Gulf of Mexico forms a loop, shearing off much rainfall and heat into the Southeastern USA and subsequently going out the Florida Strait as the Gulf Stream, the world’s largest and warmest ocean current.

As such the temperature and climate of the area is the best representation of the world climate condition.

This is the reason that of the wettest states in the USA 4 of the top 5 are in this area.

#5 Florida
#4 Alabama
#3 Mississippi
#2 Louisiana
(#1 is Hawaii)

Now that is fact. That is solid evidence. Silly claims and graphs cannot refute it.

Now some may point to an occasional remaining group of trees or such , but the fact is that commercial citrus is out of that region. The remnants are proof of exactly what I have said here.

Probability of a Hard Freeze under ENSO neutral conditions. Source: National Weather Service 

Source: National Weather Service, South Florida

See Also:  Oceans Make Climate: SST, SSS and Precipitation Linked

World of CO2 Infographics 2024 Update

Update February 13, 2024

Many of my posts include some high quality infographics produced by a colleague, Raymond Inauen.  This update is because due to other pressing time demands, Raymond has discontinued the website he set up to host the infographics. Below is an overview to the content, followed by links to the PDF files now hosted at this blog. The infographic PDFs can be downloaded at no charge with no restrictions on use. 

World of CO2 Infographics January 2023

This post is to announce that Raymond Inauen of RIC-Communications has a website up for the public to access a series of infographics regarding CO2 and climate science.  The Website content is:

The World of CO2

Readers will be aware of previous posts on the four themes to be discovered.  Raymond introduces this resource in this way:

WELCO₂ME

Would you like to learn more about CO₂ so you can have informed conversations about climate policy and future energy investments? Or would you rather pass judgment on CO₂ after learning about the basics? Then this is the website for you.

There are 29 infographic images that can be downloaded in four PDF files.  Thanks again, Raymond for your interest and efforts to make essential scientific information available to one and all. PDF links are in red.

The+World+of+CO2 CO2 charts

Example (#8 of 14)


The+World+of+Climate+Change Charts

Example (#5 of 6)

World+of+Ice+Ages Charts

Example (#1 of 2)


The+World+of+Energy Charts

Example (#7 of 7)


February Arctic Ice Jumps Over 15 Wadhams a Month Early

For ice extent in the Arctic, the bar is set at 15M km2. The highest daily average in the last 18 years occurs on day 61 at 15.08M before descending. Most years are able to clear 15M, but in recent previous years, 2017, 2018, 2019 and 2021 ice extents failed to clear the bar at 15M km2.  Now on February 11, 2024 (day 42) Arctic ice extent has already leaped over that bar 20 days early.

All years including averages are from MASIE, except for SII 2024.

The graph shows how rapidly the Arctic froze this year, reaching 14.4M km2 extent already on January 24.  Then the extent waffled around that level, until suddenly a Hockey Stick shape appeared when 600k km2 of ice was added in just the last four days. That is 400k km2 above average, and well above many other years, including 2006.  SII is also lagging at 400k km2 lower.

The table shows the distribution of ice compared to day 45 averages and other years on that day.

Region 2024042 Day 45 Ave. 2024-Ave. 2006045 2024-2006
 (0) Northern_Hemisphere 15040629 14687838 352791 14419407 621223
 (1) Beaufort_Sea 1070983 1070317 667 1069711 1273
 (2) Chukchi_Sea 966006 965761 245 966006 0
 (3) East_Siberian_Sea 1087137 1087131 6 1087103 35
 (4) Laptev_Sea 897845 897837 8 897773 71
 (5) Kara_Sea 934647 908486 26161 932726 1920
 (6) Barents_Sea 662793 582078 80715 530801 131992
 (7) Greenland_Sea 825638 622774 202864 579677 245961
 (8) Baffin_Bay_Gulf_of_St._Lawrence 1340370 1456370 -115999 1227497 112873
 (9) Canadian_Archipelago 854860 853383 1478 852715 2145
 (10) Hudson_Bay 1260903 1260579 325 1257433 3470
 (11) Central_Arctic 3233243 3208074 25168 3198987 34255
 (12) Bering_Sea 631508 700745 -69237 889518 -258010
 (13) Baltic_Sea 136308 90991 45317 79904 56404
 (14) Sea_of_Okhotsk 1101713 923694 178019 759197 342516

The Pacific basins show a moderate deficit in Bering Sea offset by a large 178k km2 surplus in Okhotsk.  Baffin Bay is down 120k km2, offset by Greenland Sea over 200k km2 and Barents up 81k km2.

These results fly in the face of those claiming for years that Arctic ice is in a “death spiral.”  More sober and clear-eyed observers have called out the alarmists for their exaggerations.  A recent example comes from Allan Alsup Jensen at Nordic Institute of Product Sustainability, Environmental Chemistry and Toxicology, Denmark.  His December 2023 paper is Time Trend of the Arctic Sea Ice Extent.  Excerpts in italics with my bolds and added images.

Since 2007 no significant decline has been observed

Abstract

The NSIDC website, IPCC’s reports and some scientific papers have announced that the Arctic Sea ice extent, when it is lowest in September month, in recent years has declined dramatically, and in few decades the sea ice is supposed to disappear completely in the summer. In that way new and shorter ships routes will open up north of the continents.

The facts are, that the Arctic Sea ice extent measured by satellites since 1978 expresses annual variations and it has declined considerably from 1997 to 2007. However, before that time period, from 1978 to 1996, the downward trend was minimal, and in the last 17 years from 2007 to 2023 the downward trend has also been about zero. Therefore, there is no indication that we should expect the Arctic Sea summer ice to disappear completely, as predicted, in one or two decades.

Regarding the extent of the summer (February) sea ice at the Antarctic, the downward trend during the years 1979-2021 was very small but in 2022 and 2023 a considerable decline was observed, and a decline was also clearly observed for the whole period of 2007- 2023. That was in contradiction to what happened in the Arctic. The pattern of the annual levels was not the same for the Arctic and Antarctic, indicating different drivers in the North and the South.

Figure 4: The minimum extent of the sea ice at Antarctic
in February month 1979-2023 (data
from NSIDC.org)

These data show that there is no apparent correlation between the variable extent of the Arctic and the Antarctic Sea ice and the gradually increasing CO2-concentrations in the atmosphere as proposed by NSIDC, IPCC and others, also for these areas of cold climate.

Postscript Feb. 14

Some seek to deny the current plateau in Arctic Sea Ice by saying that extent measure is only surface, while volume would be a truer metric.  That is true in theory, but in practice obtaining accurate and consistent data on sea ice thickness is a challenge yet to be reached.  As you can imagine, detecting a depth dimension from satellites is fraught with errors, especially with drift ice not land anchored, moving around, sometimes piling up from winds.  The scientific effort to measure volume has a short history and several uncertainties to ovecome before it can be trusted.

Unfortunately for those wanting an ice free Arctic (well, no more than 1 Wadham they say), the volume record so far shows the same plateau:

“Satellite derived sea ice thickness (CryoSat 2, AWI algorithm v2.6) shows an anomaly thickness pattern very similar to that from PIOMAS, but CS2 shows negative anomalies propagating north of the Canadian Archipelago into the central Arctic while PIOMAS has neutral conditions there. A positive thickness anomaly around Wrangle Island is spatially more extensive in CS2. January 2024 adds another month to the record of CS2 data which now spans 13 years. Neither CS2 nor PIOMAS show any discernible trend over that time period underlining the importance of internal variability at decadal timescales.”  Source: Polar Science Center


UAH January 2024: Ocean Warm, Land Cooling

The post below updates the UAH record of air temperatures over land and ocean. Each month and year exposes again the growing disconnect between the real world and the Zero Carbon zealots.  It is as though the anti-hydrocarbon band wagon hopes to drown out the data contradicting their justification for the Great Energy Transition.  Yes, there has been warming from an El Nino buildup coincidental with North Atlantic warming, but no basis to blame it on CO2.  

As an overview consider how recent rapid cooling  completely overcame the warming from the last 3 El Ninos (1998, 2010 and 2016).  The UAH record shows that the effects of the last one were gone as of April 2021, again in November 2021, and in February and June 2022  At year end 2022 and continuing into 2023 global temp anomaly matched or went lower than average since 1995, an ENSO neutral year. (UAH baseline is now 1991-2020). Now we have an usual El Nino warming spike of uncertain cause, but unrelated to steadily rising CO2.

For reference I added an overlay of CO2 annual concentrations as measured at Mauna Loa.  While temperatures fluctuated up and down ending flat, CO2 went up steadily by ~60 ppm, a 15% increase.

Furthermore, going back to previous warmings prior to the satellite record shows that the entire rise of 0.8C since 1947 is due to oceanic, not human activity.

gmt-warming-events

The animation is an update of a previous analysis from Dr. Murry Salby.  These graphs use Hadcrut4 and include the 2016 El Nino warming event.  The exhibit shows since 1947 GMT warmed by 0.8 C, from 13.9 to 14.7, as estimated by Hadcrut4.  This resulted from three natural warming events involving ocean cycles. The most recent rise 2013-16 lifted temperatures by 0.2C.  Previously the 1997-98 El Nino produced a plateau increase of 0.4C.  Before that, a rise from 1977-81 added 0.2C to start the warming since 1947.

Importantly, the theory of human-caused global warming asserts that increasing CO2 in the atmosphere changes the baseline and causes systemic warming in our climate.  On the contrary, all of the warming since 1947 was episodic, coming from three brief events associated with oceanic cycles. And now in 2023 we are seeing an amazing episode with a temperature spike driven by ocean air warming in all regions, with some cooling the last two months. 

Update August 3, 2021

Chris Schoeneveld has produced a similar graph to the animation above, with a temperature series combining HadCRUT4 and UAH6. H/T WUWT

image-8


mc_wh_gas_web20210423124932

See Also Worst Threat: Greenhouse Gas or Quiet Sun?

January 2024 El Nino Spikes Higher While Land Cools 

banner-blog

With apologies to Paul Revere, this post is on the lookout for cooler weather with an eye on both the Land and the Sea.  While you will hear a lot about 2020-21 temperatures matching 2016 as the highest ever, that spin ignores how fast the cooling set in.  The UAH data analyzed below shows that warming from the last El Nino had fully dissipated with chilly temperatures in all regions. After a warming blip in 2022, land and ocean temps dropped again with 2023 starting below the mean since 1995.  Spring and Summer 2023 saw a series of warmings, continuing into October, but with cooling since. 

UAH has updated their tlt (temperatures in lower troposphere) dataset for January 2024. Posts on their reading of ocean air temps this month preceded updated records from HadSST4.  I last posted on SSTs using HadSST4 Ocean Warming Spike Recedes December 2023.  This month also has a separate graph of land air temps because the comparisons and contrasts are interesting as we contemplate possible cooling in coming months and years.

Sometimes air temps over land diverge from ocean air changes.  November 2023 was notable for a dichotomy between Ocean and Land air temperatures in UAH dataset. Remarkably a new high for Ocean air temps appeared with warming in all regions, while Land air temps dropped with cooling in all regions.  As a result the Global Ocean and Land anomaly result remained little changed. Now again in January 2024, ocean temps went higher driven by El Nino and NH, while all land regions cooled except for Tropics.

Note:  UAH has shifted their baseline from 1981-2010 to 1991-2020 beginning with January 2021.  In the charts below, the trends and fluctuations remain the same but the anomaly values change with the baseline reference shift.

Presently sea surface temperatures (SST) are the best available indicator of heat content gained or lost from earth’s climate system.  Enthalpy is the thermodynamic term for total heat content in a system, and humidity differences in air parcels affect enthalpy.  Measuring water temperature directly avoids distorted impressions from air measurements.  In addition, ocean covers 71% of the planet surface and thus dominates surface temperature estimates.  Eventually we will likely have reliable means of recording water temperatures at depth.

Recently, Dr. Ole Humlum reported from his research that air temperatures lag 2-3 months behind changes in SST.  Thus cooling oceans portend cooling land air temperatures to follow.  He also observed that changes in CO2 atmospheric concentrations lag behind SST by 11-12 months.  This latter point is addressed in a previous post Who to Blame for Rising CO2?

After a change in priorities, updates are now exclusive to HadSST4.  For comparison we can also look at lower troposphere temperatures (TLT) from UAHv6 which are now posted for January.  The temperature record is derived from microwave sounding units (MSU) on board satellites like the one pictured above. Recently there was a change in UAH processing of satellite drift corrections, including dropping one platform which can no longer be corrected. The graphs below are taken from the revised and current dataset.

The UAH dataset includes temperature results for air above the oceans, and thus should be most comparable to the SSTs. There is the additional feature that ocean air temps avoid Urban Heat Islands (UHI).  The graph below shows monthly anomalies for ocean air temps since January 2015.

Note 2020 was warmed mainly by a spike in February in all regions, and secondarily by an October spike in NH alone. In 2021, SH and the Tropics both pulled the Global anomaly down to a new low in April. Then SH and Tropics upward spikes, along with NH warming brought Global temps to a peak in October.  That warmth was gone as November 2021 ocean temps plummeted everywhere. After an upward bump 01/2022 temps reversed and plunged downward in June.  After an upward spike in July, ocean air everywhere cooled in August and also in September.   

After sharp cooling everywhere in January 2023, all regions were into negative territory. Note the Tropics matched the lowest value, but since have spiked sharply upward +1.7C, with the largest increases in April to July, and continuing through adding to a new high January 2024. NH also spiked upward to a new high, while Global ocean rise was more modest due to slight SH cooling.  

Land Air Temperatures Tracking in Seesaw Pattern

We sometimes overlook that in climate temperature records, while the oceans are measured directly with SSTs, land temps are measured only indirectly.  The land temperature records at surface stations sample air temps at 2 meters above ground.  UAH gives tlt anomalies for air over land separately from ocean air temps.  The graph updated for December is below.

Here we have fresh evidence of the greater volatility of the Land temperatures, along with extraordinary departures by SH land.  Land temps are dominated by NH with a 2021 spike in January,  then dropping before rising in the summer to peak in October 2021. As with the ocean air temps, all that was erased in November with a sharp cooling everywhere.  After a summer 2022 NH spike, land temps dropped everywhere, and in January, further cooling in SH and Tropics offset by an uptick in NH. 

Remarkably, in 2023, SH land air anomaly shot up 2.1C, from  -0.6C in January to +1.5 in September, then dropped sharply, now down to 0.6 in January 2024.  NH land temps have also dropped 0.3C down to 1.0C, resulting in Global land temps cooling to 0.9C, matching the peak in Feb. 2016. Land in the Tropics was unchanged in January, down slightly from its October peak.

The Bigger Picture UAH Global Since 1980

The chart shows monthly Global anomalies starting 01/1980 to present.  The average monthly anomaly is -0.05, for this period of more than four decades.  The graph shows the 1998 El Nino after which the mean resumed, and again after the smaller 2010 event. The 2016 El Nino matched 1998 peak and in addition NH after effects lasted longer, followed by the NH warming 2019-20.   An upward bump in 2021 was reversed with temps having returned close to the mean as of 2/2022.  March and April brought warmer Global temps, later reversed

With the sharp drops in Nov., Dec. and January 2023 temps, there was no increase over 1980. Now in 2023 the buildup to the October/November peak exceeded the sharp April peak of the El Nino 1998 event. It also surpassed the February peak in 2016.  December and January are down slightly, but where it goes from here, up or down further, remains to be seen.

The graph reminds of another chart showing the abrupt ejection of humid air from Hunga Tonga eruption.

TLTs include mixing above the oceans and probably some influence from nearby more volatile land temps.  Clearly NH and Global land temps have been dropping in a seesaw pattern, nearly 1C lower than the 2016 peak.  Since the ocean has 1000 times the heat capacity as the atmosphere, that cooling is a significant driving force.  TLT measures started the recent cooling later than SSTs from HadSST3, but are now showing the same pattern. Despite the three El Ninos, their warming has not persisted prior to 2023, and without them it would probably have cooled since 1995.  Of course, the future has not yet been written.


Covid19 mRNA Vaccines Fiasco 2024 Update

A thorough examination of the trials and tribulations of the mRNA shots proclaimed and sometimes forced upon people comes from a dream team of experts in the field:   The authors of this research paper are highly qualified experts, including, according to Liberty Counsel, “biologist and nutritional epidemiologist M. Nathaniel Mead; research scientist Stephanie Seneff, Ph.D.; biostatistician and epidemiologist Russ Wolfinger, Ph.D.; immunologist and biochemist Dr. Jessica Rose; biostatistician and epidemiologist Kris Denhaerynck, Ph.D.; Vaccine Safety Research Foundation Executive Director Steve Kirsch; and cardiologist, internist, and epidemiologist Dr. Peter McCullough.”

The peer reviewed paper is at Cureus COVID-19 mRNA Vaccines: Lessons Learned from the Registrational Trials and Global Vaccination Campaign.  Excerpts in italics with my bolds and added images.

Abstract

Our understanding of COVID-19 vaccinations and their impact on health and mortality has evolved substantially since the first vaccine rollouts. Published reports from the original randomized phase 3 trials concluded that the COVID-19 mRNA vaccines could greatly reduce COVID-19 symptoms. In the interim, problems with the methods, execution, and reporting of these pivotal trials have emerged. Re-analysis of the Pfizer trial data identified statistically significant increases in serious adverse events (SAEs) in the vaccine group. Numerous SAEs were identified following the Emergency Use Authorization (EUA), including death, cancer, cardiac events, and various autoimmune, hematological, reproductive, and neurological disorders.

Furthermore, these products never underwent adequate safety and toxicological testing in accordance with previously established scientific standards. Among the other major topics addressed in this narrative review are:

♦   the published analyses of serious harms to humans;
♦   quality control issues and process-related impurities;
♦   mechanisms underlying adverse events (AEs):
♦   the immunologic basis for vaccine inefficacy; and
♦   concerning mortality trends based on the registrational trial data.

The risk-benefit imbalance substantiated by the evidence to date contraindicates further booster injections and suggests that, at a minimum, the mRNA injections should be removed from the childhood immunization program until proper safety and toxicological studies are conducted. Federal agency approval of the COVID-19 mRNA vaccines on a blanket-coverage population-wide basis had no support from an honest assessment of all relevant registrational data and commensurate consideration of risks versus benefits.

Given the extensive, well-documented SAEs and unacceptably high harm-to-reward ratio, we urge governments to endorse a global moratorium on the modified mRNA products until all relevant questions pertaining to causality, residual DNA, and aberrant protein production are answered.

Background

Political and financial incentives may have played a key role in undermining the scientific evaluation process leading up to the EUA. Lalani and colleagues documented the major investments made by the US government well before authorization [18]. Even prior to the pandemic, the US National Institutes of Health invested $116 million (35%) in mRNA vaccine technology, the Biomedical Advanced Research and Development Authority (BARDA) had invested $148 million (44%), while the Department of Defense (DOD) contributed $72 million (21%) to mRNA vaccine development. BARDA and the DOD also collaborated closely in the co-development of Moderna’s mRNA vaccine, dedicating over $18 billion, which included guaranteed vaccine purchases [18]. This entailed pre-purchasing hundreds of millions of mRNA vaccine doses, alongside direct financial support for the clinical trials and the expansion of Moderna’s manufacturing capabilities. The public funding provided for developing these products through Operation Warp Speed surpassed investments in any prior public initiative [19]. Once the pandemic began, $29.2 billion (92% of which came from US public funds) was dedicated to the purchase of COVID-19 mRNA products; another $2.2 billion (7%) was channelled into supporting clinical trials, and $108 million (less than 1%) was allocated for manufacturing and basic research [18]. This profuse spending of taxpayer dollars continued throughout the pandemic: BARDA spent another $40 billion in 2021 alone [20].

Using US taxpayer money to purchase so many doses in advance would suggest that, prior to the EUA process, US federal agencies were strongly biased toward successful outcomes for the registrational trials. Moreover, it is reasonable to surmise that such extensive vested interests could have influenced the decision to prematurely halt the registrational trials. Unblinding essentially nullified the “placebo-controlled” element of the trials, eliminating the control group and thus undermining the ability to objectively assess the mRNA vaccines’ safety profile and potential serious AEs (SAEs). Thus, while the accelerated authorization showcased the government’s dedication to provide these novel products, it also raised concerns among many experts regarding risk-benefit issues and effectively eliminated the opportunity to learn about the potential long-range harms of the mRNA inoculations. The political pressures to rapidly deliver a solution may have compromised the thoroughness and integrity of the scientific evaluation process while downplaying and obfuscating scientific concerns about the potential risks associated with mRNA technology.

Concerns about inadequate safety testing extend beyond the usual regulatory approval standards and practices. Although we employ the terms “vaccine” and “vaccination” throughout this paper, the COVID-19 mRNA products are also accurately termed gene therapy products (GTPs) because, in essence, this was a case of GTP technology being applied to vaccination [21]. European regulations mandate the inclusion of an antigen in vaccines, but these immunogenic proteins are not intrinsic to the mRNA vaccines [22]. The GTP vaccine platform has been studied for over 30 years as an experimental cancer treatment, with the terms gene therapy and mRNA vaccination often used interchangeably [23]. This is due to the mRNA products’ specific mode of action: synthetic mRNA strands, encapsulated within a protective lipid nanoparticle (LNP) vehicle, are translated within the cells into a specific protein that subsequently stimulates the immune system against a specific disease. Another accurate label would be prodrugs because these products stimulate the recipient’s body to manufacture the target protein [24]. As there were no specific regulations at the time of the rapid approval process, regulatory agencies quickly “adapted” the products, generalized the definition of “vaccine” to accommodate them, and then authorized them for EUA for the first time ever against a viral disease. However, the rationale for regulating these products as vaccines and excluding them from regulatory oversight as GTPs lacks both scientific and ethical justification [21]. (Note: Throughout this review, the terms vaccines and vaccinations will be used interchangeably with injections, inoculations, biologicals, or simply, products.)

Due to the GTPs’ reclassification as vaccines, none of their components have been thoroughly evaluated for safety. The main concern, in a nutshell, is that the COVID-19 mRNA products may transform body cells into viral protein factories that have no off-switch (i.e., no built-in mechanism to stop or regulate such proliferation), with the spike protein (S-protein) being generated for prolonged periods, causing chronic, systemic inflammation and immune dysfunction [25,26]. This S-protein is the common denominator between the coronavirus and the vaccine, which helps to explain the frequent overlap in AEs generated by both the infection and the inoculation [25]. The vaccine-induced S-protein is more immunogenic than its viral counterpart; and yet, the increased antibody production is also associated with more severe immunopathology and other adverse effects [27]. The Pfizer and Moderna mRNA products contain mRNA with two modified codons that result in a version of the S-protein that is stabilized in its prefusion state [28]. This nucleoside-modified messenger RNA technology is intended to extend the synthetic mRNA’s persistence in the body. When the S-protein enters the bloodstream and disseminates systemically, it may become a contributing factor to diverse AEs in susceptible individuals [25].

Revisiting the registrational trials

Although randomized controlled trials (RCTs) are viewed as the gold standard for testing the safety and efficacy of medical products (due to minimizing bias), trials of limited scope can readily obscure the true safety and efficacy issues with respect to different segments of the population. In this case, the trials excluded key sub-groups, notably children, pregnant women, frail elderly persons, and immuno-compromised individuals, as well as those with cancer, autoimmune disease, and other chronic inflammatory conditions [45]. Whereas the founding trials did not recruit individuals with comorbidities, vaccine recipients in the rollouts showed the actual presence of these underlying conditions. Rather than assess these well-known safety and comorbid risk concerns, the focus was narrowly placed on the potential for inflammatory lung injury as had been seen in COVID-19 patients and, many years earlier, in immunized animal models infected with SARS-CoV [46]. We are now beginning to recognize the folly of this narrow safety focus, as millions of severe and life-threatening events associated with the COVID-19 vaccines continue to be documented in the medical literature [47-51].

What did the pivotal trials reveal about overall (all-cause) mortality? After carefully analyzing the ACM for the Pfizer and Moderna trials, Benn and colleagues found 61 deaths total (31 in vaccine, 30 in placebo) and a mortality RR of 1.03 (0.63-1.71), comparing the vaccinated to placebo [52]. These findings can be interpreted as “no significant difference” or no gold-standard evidence showing these mRNA vaccines reduce mortality. The lack of significant differences in deaths between the study arms is noteworthy. The true mortality impact remains unknown in this context, and this fact alone is relevant, as it would be preferable to take a vaccine with good trial evidence of reduced mortality than to take a vaccine where trial evidence does not show convincing evidence of improved survival [53]. Similarly, a subsequent analysis of the Pfizer trial data concluded that mortality rates were comparable between vaccinated and placebo groups during the initial 20-week period of the randomized trial [54]. The fact that the mRNA vaccinations did not lead to a reduction in overall mortality implies that, if the injections were indeed averting deaths specifically attributable to COVID-19, any such reduction might be offset by an increase in mortality stemming from other causes, such as SAEs.

For the Pfizer and Moderna registrational trials, Benn et al. also reported a non-significant 45% increase in cardiovascular deaths (RR=1.45; 95%CI 0.67-3.13) in the vaccine arms of the trials [52]. This outcome was consistent with numerous reports of COVID-19 vaccine-related cardiovascular pathology among both young and old segments of the population [57-63]. None of the mortality estimates from the trials are statistically significant. Nevertheless, the upward trends for both ACM and cardiovascular deaths are concerning. If the Pfizer trial had not been prematurely discontinued, and assuming death rates remain the same in both arms as observed in the first six months, the ACM difference would reach the standard threshold for statistical significance (p < 0.05) at approximately 2.8 years (34 months). The p-value is 0.065 at 2.5 years and 0.053 at 2.75 years (see Appendix 1). These calculations were independently confirmed by Masterjohn [64].

Absolute risk and the “number needed to vaccinate (NNV)”

It is imperative to carefully weigh all potential risks associated with the COVID-19 mRNA products. Should substantial harms be linked to their use, the perceived “reward” conveyed by the NNV would necessitate a re-appraisal. For example, assuming an NNV of 119 and an IFR of 0.23% (both conservative estimates), approximately 52,000 vaccinations would be needed to prevent one COVID-19-related death. Thus, for the BNT162b2 injection, a generous estimate would be two lives saved from COVID-19 for every 100,000 courses of the biological. Given the evidence of trial misconduct and data integrity problems (see next section), we conjecture that this estimate is an “upper bound”, and therefore the true benefit is likely to be much lower. Regarding potential harms, assuming 30% false-positive reports and a moderate under-reporting factor of 21, we calculate a risk of 27 deaths per 100,000 doses of BNT162b2. Thus, applying these reasonable, conservative assumptions, the estimated harms of the COVID-19 mRNA vaccines greatly outweigh the rewards: for every life saved, there were nearly 14 times more deaths caused by the modified mRNA injections (for details, see Appendix 2).

Underreporting of harms and data integrity issues

When Pfizer’s Six-Month Interim Report of Adverse Events (C4591001) revealed a total death count of 38 [35], the number seemed unexpectedly low for a clinical trial involving 44,060 participants amidst a pandemic. To investigate, Michels and colleagues estimated the anticipated deaths based on US mortality rates in 2020, presuming comparability across participating countries [54]. With 132 trial sites in the US and 80% of subjects, they estimated that 222 deaths should have occurred between July 27, 2020, and March 13, 2021, making the observed 38 deaths only 17% of the projected number. Most of the trial sites had fewer deaths than anticipated, possibly attributed to a considerable percentage of “Lost to Follow-up” subjects (4.2% of randomized subjects), including 395 unique subjects within the study period. While some sites recorded negligible losses, others exhibited substantial figures, up to 5% of the site’s subjects [54]. These numbers likely contributed to the seemingly low overall death count and should have prompted increased efforts to locate these individuals. Losing track of nearly 400 study participants in the follow-up observation period could have substantially compromised the validity and generalizability of the results. The missing data can produce biased estimates, leading to invalid conclusions. This could result in a distortion of vaccine efficacy and underestimation of SAEs (including deaths), thus misrepresenting the safety profile of the mRNA products. In short, Pfizer’s failure to minimize participant attrition seriously undermined the accuracy and reliability of the six-month study’s conclusions.

These concerns are further compounded by revelations concerning substandard research practices and inadequate data management in the pivotal trials. A whistleblower report by a former employee of the contract research organization responsible for enrolling patients in Pfizer’s pivotal trial raises significant questions regarding data integrity and the safety of trial participants [85]. Among the trial conduct issues documented were failure to report protocol deviations, improper storage of vaccines, mislabeling of laboratory specimens, and lack of timely follow-up for patients experiencing AEs, possibly leading to underreporting. In terms of regulatory oversight, the FDA inspected only nine out of the 153 study sites involved in the Pfizer trial [86].

Finally, an unblinding of participants occurred early in the trial, potentially on a wide scale across different study sites. Participants were not presented with clear information regarding potential AEs in both trial protocols and consent forms [87]. Some parts of the consent form were misleading and merely intended to elicit participation that might not otherwise have occurred if the volunteers had been made aware that what was promised in theory or “on paper” was unlikely to happen in reality [87]. As a result, participants were not being granted truly informed consent; the potential injuries and AEs most likely to be caused by the vaccinations were never openly stated.

This lack of informed consent carried over into the real-world setting following the EUA. For example, not publicly disclosing the Pfizer trial’s exclusion of pregnant women is arguably among the CDC’s most egregious oversights when asserting the safety of COVID-19 vaccine administration during pregnancy [1]. The Nuremberg Code established patients’ rights to voluntary informed consent in the aftermath of World War II [88]. US courts consistently support informed consent as a fundamental right for patients’ autonomy [89]. Informed consent procedures must provide clear distinctions between risks that are frequently observed, risks that occur rarely, and the more obvious risk of lack of effectiveness or waning immunity, which is separate from the risk of SAEs. Whether in a clinical trial or free-living real-world setting, informed consent is essential to providing a clear understanding of the potential risks associated with receiving a genetic vaccine. Throughout the pandemic, healthcare workers were duty-bound to provide clear risk-benefit information to patients. In practice, however, informed consent was non-existent, as information sheets were blank [90], and vaccinees were never informed of potential risks beforehand.

Shifting narratives, illusions of protection

The best evidence for the failure of the COVID-19 mRNA vaccine’s ability to confer protection against COVID-19 comes from two large cohort studies of employees within the Cleveland Clinic Health System (CCHS) after the bivalent mRNA boosters became available [99,100]. In the first study (n=51,017), COVID-19 occurred in 4,424 (8.7%) during the 26-week observation period [99]. In terms of preventing infections by the three prevailing Omicron subvariants, the vaccine effectiveness was 29%, 20%, and a non-significant 4%, respectively [99]. No protection was provided when the XBB lineages were dominant. Notably, the risk of “breakthrough” infection was significantly higher among those who received the earlier vaccine, and a higher frequency of vaccinations resulted in a greater risk of COVID-19 [100]. In a second CCHS cohort study (n= 48,344), adults who were “not up-to-date” by the CDC definition had a 23% lower incidence of COVID-19 than those “up-to-date” with their vaccinations [100]. These findings are further reinforced by multiple real-world studies showing rapidly waning protection against Omicron infection after the boosters [101]. The vaccine effectiveness against laboratory-confirmed Omicron infection and symptomatic disease rapidly wanes within three months of the primary vaccination cycle and booster dose [97].

In a recent study of nearly five million adults, those who had a SARS-CoV-2 infection within 21 days post injection showed an eight-fold increased risk of ischemic stroke (OR=8.00, 95%CI 4.18-15.31) and a five-fold increased risk of hemorrhagic stroke when compared to vaccinees without concurrent infection (OR=5.23, 95%CI 1.11-24.64) [121]. The risk was highest for those receiving the mRNA-1273 injections. Thus, SARS-CoV-2 infection close to the time of vaccination produced a strong association with early incidence of ischemic and hemorrhagic strokes [121]. Again, with a hybrid immunity approach, the potential harms may greatly outweigh the rewards.

Natural immunity carries none of these risks and is more than sufficient against the mild virulence of Omicron subvariants. Much evidence now indicates that natural immunity confers robust, durable, and high-level protection against COVID-19 severe illness [122-126]. A large United Kingdom (UK) study of over 30,000 healthcare workers, having a prior history of SARS-CoV-2 infection, showed an 84% reduced risk of reinfection, with a median protective period of seven months [125]. In a large observational study in Israel, previously infected individuals who remained unvaccinated were 6-13 times less likely to contract the virus compared to those who were vaccinated [122]. Among 32,000 individuals within the same healthcare system, vaccinated individuals had a 27-time higher risk of developing symptomatic COVID-19 and an eight-time higher risk of hospitalization compared to their unvaccinated counterparts [122].

After recovering from COVID-19, the body harbors long-lived memory immune cells, indicating an enduring capacity to respond to new infections, potentially lasting many years [127]. Mounting evidence suggests that the training of antibodies and induction of T-cell memory resulting from repeated natural infection with Omicron can augment the mitigation of future infections [128,129]. In a recent cohort study, children who had experienced prior infection showed long-lasting protection against reinfection with SARS-CoV-2 for a minimum of 18 months [130]. Such children between the ages of five and 11 years demonstrated no decline in protection during the entire study, while those aged 12-18 experienced a mild yet measurable decline in protection over time [130]. For these younger generations in particular, natural immunity is more than sufficient and of course vastly safer than the mRNA inoculations.

Analyses of serious harms to humans

For both the Pfizer and Moderna trials combined, there were about 125 SAEs per 100,000 vaccine recipients, which translates into one SAE for every 800 vaccinees [50]. Because the trials avoided the most frail as participants, one would expect to see even higher proportions of SAEs in the population-wide rollouts. Remarkably, the Pfizer trial exhibited a 36% higher risk of SAEs in the vaccine group compared to the placebo, with a risk difference of 18.0 (95%CI 1.2-34.9) per 10,000 vaccinated; risk ratio 1.36 (95%CI 1.02-1.83). These findings stand in sharp contrast with the FDA’s initial claim that SAEs reported by the two pivotal trials were “balanced between treatment groups” [15,50]. The discrepancy may be partly explained by the fact that the FDA was focusing only on individual participant data, and yet many of those individuals were experiencing multiple SAEs. Instead of analyzing individuals, Fraiman et al. focused on total SAEs to take into account the multiple, concurrent events [50]. When the SAEs were viewed collectively, the risks in the vaccine group were substantially elevated beyond those previously determined by the FDA.

Analyses of two large drug safety reporting systems in the US and Europe revealed over 7.8 million AEs reported by approximately 1.6 million individuals following COVID-19 vaccination [47]. When compared to individuals aged 18-64 years, the older age groups exhibited a higher frequency of death, hospitalizations, and life-threatening reactions, with RR estimates ranging from 1.49 (99%CI 1.44-1.55) to 8.61 (99%CI 8.02-9.23). Signals were identified for myocardial infarction, pulmonary embolism, cardio-respiratory arrest, cerebral infarction, and cerebral hemorrhage associated with both mRNA vaccines. These signals, along with ischemic strokes, were confirmed by a large disproportionality analysis [48]. In an independent risk-benefit analysis, BNT162b2 produced 25 times more SAEs than the number of severe COVID-19 cases prevented [51].

Finally, autopsy studies have provided additional evidence of serious harms. In a comprehensive systematic review with full independent adjudication, 74% of autopsy findings (240 out of 325 cases), were judged to have been caused by the COVID-19 mRNA products [139]. The mean time from injection to death was 14.3 days, and the vast majority of deaths had the cardiovascular system as the single fatal organ system injury to the body.

These findings help explain the wide range of well-documented COVID-19 vaccine-induced toxicities that impact the nervous, gastrointestinal, hepatic, renal, hematological, immune, and reproductive systems [25,144,145]. Post-mortem examinations are critical for identifying potential SAEs of the mRNA inoculations. However, as clinics and hospital administrations have a large vested interest in the COVID-19 vaccines’ distribution, the common administrative practice of discouraging autopsies and postponing autopsy reports only serves to undermine comprehensive risk assessment, perpetuate public misconceptions regarding safety, and weaken public health policymaking [145].

Conclusions

Based on the research presented in this narrative review, the global COVID-19 vaccination campaign should be regarded as a grave medical error. Medical errors represent a substantial threat to personal and public safety and have long constituted a leading cause of death [288-290]. Misguided political and regulatory decisions were made at the highest levels and may have been heavily influenced by financial incentives. Government agencies should have considered all reasonable treatment alternatives and deflected away pressures from the medical-pharmaceutical industry rather than allowing population-wide distribution of experimental genetic vaccines.

Had the FDA recognized the nearly four-fold increase in cardiac SAEs (including deaths) subsequently identified in the Pfizer trial’s vaccine group [54], it is doubtful that the EUA would have transpired in December 2020. An in-depth investigation of the COVID-19 vaccine’s long-term safety profile is now urgently needed. Despite the many striking revelations discussed in this review, most developed countries continue to advocate the ongoing adoption of COVID-19 mRNA boosters for the entire eligible population. US federal agencies still emphasize the safety of the vaccines in reducing severe illness and deaths caused by the coronavirus, despite the absence of any randomized, double-blind, placebo-controlled trials to support such claims. This reflects a bewildering disconnect between evidence-based scientific thinking and public health policy.

Careful, objective evaluation of COVID-19 mRNA product safety is crucial for upholding ethical standards and evidence-informed decision-making. Our narrative review concerning the registrational trials and the EUA’s aftermath offers evidence-informed insights into how these genetic vaccines were able to enter the market. In the context of the two pivotal trials, safety was never assessed in a manner commensurate with previously established scientific standards either for vaccines or for GTPs, the more accurate classification of these products. Many key trial findings were either misreported or omitted entirely from published reports. The usual safety testing protocols and toxicology requirements were bypassed by the FDA and vaccine manufacturers, and the premature termination of both trials obviated any unbiased assessment of potential SAEs due to an insufficient timeframe for proper trial evaluation.

It was only after the EUA that the serious biological consequences of rushing the trials became evident, with numerous cardiovascular, neurological, reproductive, hematological, malignant, and autoimmune SAEs identified and published in the peer-reviewed medical literature. Moreover, the COVID-19 mRNA vaccines produced via Process 1 and evaluated in the trials were not the same products eventually distributed worldwide; all of the COVID-19 mRNA products released to the public were produced via Process 2 and have been shown to have varying degrees of DNA contamination. The failure of regulatory authorities to heretofore disclose process-related impurities (e.g., SV40) has further increased concerns regarding safety and quality control oversight of mRNA vaccine manufacturing processes.

Since early 2021, excess deaths, cardiac events, strokes, and other SAEs have often been wrongly ascribed to COVID-19 rather than to the COVID-19 mRNA vaccinations. Misattribution of SAEs to COVID-19 often may be due to the amplification of adverse effects when mRNA injections are followed by SARS-CoV-2 subvariant infection. Injuries from the mRNA products overlap with both PACS and severe acute COVID-19 illness, often obscuring the vaccines’ etiologic contributions. Multiple booster injections appear to cause immune dysfunction, thereby paradoxically contributing to heightened susceptibility to COVID-19 infections with successive doses. For the vast majority of adults under the age of 50, the perceived benefits of the mRNA boosters are profoundly outweighed by their potential disabling and life-threatening harms. Potential harms to older adults appear to be excessive as well.

Given the well-documented SAEs and unacceptable harm-to-reward ratio, we urge governments to endorse and enforce a global moratorium on these modified mRNA products until all relevant questions pertaining to causality, residual DNA, and aberrant protein production are answered.


Net Zero Not Only Inhuman, It’s Also Ecocidal

Roger Palmer speaks quietly, but with the force of knowledge and logic on the subject of global warming/climate change.  Two expressions of his perspective are presented here: firstly a brief video and transcript, and secondly excerpts from his 2024 paper. Transcript in italics with my bolds and added images.  H/T Raymond Inauen

1. Trust Climate History, Not Hysteria

I’m Roger Palmer, a retired engineer living in Victoria, British Columbia. Today I want to talk about climate change hysteria. The popular press is overflowing with sensational but scary headlines: the hottest day on record, sea levels are rising, climate catastrophe. It’s never been like this before, climate change is an existential threat, we are declaring a climate emergency, it’s man’s fault.

These hysterical messages are reinforced at disruptions organized by career demonstrators and professional protesters. Politicians are falling over themselves to agree with these claims and position themselves as the only viable saviors of mankind who are able to stop the climate from changing. You can’t get elected if you are perceived as being soft on climate change.

The authors of all this spurious noise unfortunately do not have a good understanding of science or the historical paleoclimatic record. These people are so arrogant and self-centered that they believe that man can control the solar system and somehow cancel the naturally occurring climate cycles, so that the earth’s climate stays just the way they want it.

Let’s start the discussion by outlining a difference between weather and climate. When a person speaks about weather they are referring to how the atmosphere is behaving over the short term hours or days and usually over a small area. The term climate refers to the statistics of weather over a defined large region over a long period of time, decades or more. the atmospheric characteristics being described include temperature, winds, moisture, clouds and precipitation.

But it is the temperature that most people seem to focus on. In the 1970s the concern was about global cooling, but it has now shifted to global warming. An example of a weather statement is: “It will be cooler and windy in downtown Ottawa tomorrow.” An example of a climate statement is: “North America will be warmer over the next two decades.”

Reliable equipment for measuring temperature has been available since the early 1800s, but unfortunately the number and placement of temperature recording stations has changed considerably over time. So it is often difficult to get a complete and consistent record for a specific area temperature history. The period preceding the 19th century must be inferred by analyzing ice cores, tree growth rings, sediments and corals. Ice cores typically from Greenland, Antarctica or the Arctic are the most commonly used proxies. And it is possible to infer temperatures from thousands or millions of years ago. It is also possible to use ice cores to estimate the historical composition of the atmosphere.

Although surface temperature is what humans actually feel on a day-to-day basis, that data can be contaminated by urban heat islands. So it is sometimes more meaningful to talk about the temperature of the troposphere, which is the lowest layer of the earth’s atmosphere about 20 kilometers thick and is where all the weather takes place; the clouds, precipitation, storms, winds etc.  Temperatures in the troposphere can be directly measured by balloon-borne radiosondes or inferred from satellite radiometry.

Geological records show that the earth’s average temperature has varied cyclically for many millions of years. Sometimes it has been much hotter than today and sometimes much cooler. This graph estimates variations in temperature during the last 500 million years. The earth is approximately four and a half billion years old; predecessors of man have been on earth for about two and a half million years; and modern homo sapiens have been around for about two hundred thousand years.

Here is what the earth’s temperature has been doing over the past five hundred thousand years and here is the temperature record for more recent times; the last 11, 000 years otherwise known as the Holocene era.

The earth would be a much cooler place if it did not have an atmosphere. The atmosphere contains a number of gases that warm the earth by what is called the greenhouse effect. Which is when solar radiation from the sun can easily pass through the gases to the earth, but outgoing infrared radiation from the earth’s surface is partially blocked from radiating off into space by these same gases. Further details of this mechanism are given in the references.

There are several different greenhouse gases but everyone seems to focus on just one of them: carbon dioxide known as CO2. The concentration of carbon dioxide in the atmosphere is sometimes thought to be the driver of the earth’s temperature, but the geological record shows that there has been no correlation.

The absolutely dominant greenhouse gas is water vapor. The earth’s glaciers and ice caps have grown and shrunk cyclically over time. The earth recently exited the Little Ice Age and is currently warming just as in previous cycles. There is definitely a new ice age coming, but none of us will live to experience it. We are currently in an interglacial, which is a period between ice ages.

As shown by the earlier graphs the earth’s climate is not being driven by changes in the co2 level. Indeed changes in the atmospheric CO2 concentration are probably a result of changes in the earth’s temperature as oceans and land masses release stored CO2 resulting from long-term temperature changes. As the glaciers and ice caps cyclically build and recede, there are corresponding changes in the sea level. The sea level has cyclically varied from today’s levels by as much as plus or minus 200 meters. And these fluctuations are expected to continue for thousands of years to come.

So what is causing these long-term cyclical changes in the earth’s average temperature? A recently posted youtube series entitled Paleoclimatology parts one through three gives an in-depth analysis of the factors at work. Here is a summary of just some of the main factors:

♦  Continental drifts as result of plate tectonics has caused very long-term climate changes as the ocean’s heat carrying currents have been forced to take different paths;

♦  Milankovitch cycles due to changes in the earth’s tilt, precession and orbital eccentricity and cyclical changes in the solar system’s orbital alignments have demonstrably produced corresponding changes in the earth’s climate over both the long term and the short term;

♦  Cyclical changes in the sun’s total output radiated power. cyclical changes in the sun’s output spectral distribution especially the ultraviolet component

♦  Variations in the earth’s magnetic field resulting in changes in the magnitude and position of the earth’s magnetosphere which shields us from incoming cosmic particles and the solar wind

♦  Variations in upper level bacteria which serve as nucleation sites for clouds and precipitation

♦  Changes in the earth’s average cloud cover as a result of changes in many of the factors just mentioned

♦  Changes in the earth’s upper atmospheric wind currents that are used to distribute heat energy throughout the pallet of the planet

Note that carbon dioxide concentration is not a significant cause of these natural cyclical changes. CO2 has some effect on long-term climate changes but it is not the dominant determinant of global temperature. Then why are the agitators and politicians so obsessed with this and why are they arbitrarily blaming man-made CO2 emissions from the combustion of fossil fuels as threatening disruptions to their climate nirvana?

Perhaps there’s a hidden agenda. Current proposals to decarbonize the earth by eliminating fossil fuels will have a minor effect on climate, but will cause extraordinary economic harm. Maybe the true goal of the protesters is to destroy capitalism in the western world.

CO2 is a clear odorless gas. Atmospheric CO2 levels have been much higher in the past and were sometimes much lower. CO2 is not a pollutant–it is essential to life. If the atmospheric CO2 concentration were to drop below 150 parts per million, the earth’s vegetation would not be able to survive and the earth would become a barren wasteland.  There have been proposals to use large-scale geoengineering to alter the earth’s climate, such as by surrounding the earth with orbiting reflective particles or mirrors. But such schemes are fraught with political as well as technical dangers.

The Intergovernmental Panel on Climate Change known as the IPCC is often identified as the final authority when it comes to questions about the earth’s climate.  However the IPCC does not conduct research; it merely reviews papers in the field. And the IPCC should not be considered as unbiased. Because when they were created by the United Nations they were specifically charged to investigate how mankind is causing the earth’s climate to change.

In other words the conclusion had already been reached that man was to blame before any investigations were performed. The IPCC is a political animal; nothing is published before it has been approved by the representatives of all the participating countries to make sure that it aligns with their governments’ objectives and policies. IPCC has published numerous forecasts of ever increasing global temperatures being driven by rising atmospheric CO2 concentrations. But these are based on incomplete and inaccurate computer models and they have all drastically overestimated the forthcoming temperature rise.

These computer models ignore or inadequately account for many factors, including clouds and solar variations. It is claimed that 97 % of scientists agree that man-made emissions of CO2 are having significant negative effects on the earth’s climate. However consensus is not a valid way to conduct scientific research. Group think is a major problem in this field. Remember Galileo was able to prove that the earth orbited the sun rather than the other way around. But public opinion and the church forced him to recant his findings. Consensus overruled scientific evidence just like it appears to be doing today.

The earth is getting warmer and it will continue to do so until the temperature trend reverses sometime in the future and we head into the next ice age. Mankind needs to recognize that we are an observer of naturally occurring climate cycles. There is very little that we can do to stop, change or influence these cycles. The best thing that man can do is learn to adapt to these natural cycles. Stop wasting our money and damaging our economy on futile and inefficient schemes to reduce man’s CO2 emissions, appearing to be trying to thwart what are perfectly natural cyclical changes of the earth’s climate.

Learn to live with these changes. Mankind has to adapt. Have a nice day and enjoy the warmth while we have it. Here are links to references providing more details on many of these points

2. Net Zero is Both Suicidal and Ecocidal

Source: Roger Palmer publication  Understanding Climate Change.  Excerpts in italics with my bolds and added images.

Net Zero

As mentioned above, many governments have decided to pursue the goal of becoming “Net Zero” by 2050 (or possibly later). This means that they want all CO2 emitted by man’s activities either to be eliminated or somehow compensated for by 2050 in the belief that this will slow the current rise in global temperatures, and limit the rise to 1.5°C above pre-industrial levels.

As discussed in previous sections, CO2 concentration is not the primary driver of global temperature, and indeed, rising CO2 levels might actually be a result of warming due to entirely natural factors. Despite the dubious scientific justification, politicians and special-interest groups have embraced the “Net Zero” battle cry, and are falling over themselves with announcements, proclamations, and protests as they attempt to destroy the world’s economy.

The concept of Net Zero is that any continuing emissions of CO2 need to be “offset” by actions to remove the same amount of CO2 from the atmosphere. These “offsets” could be the planting of trees that absorb CO2, or they could involve operating actual equipment that removes CO2 from the atmosphere, and then sequesters it in a safe storage facility (this is called CCS, which stands for Carbon Capture and Sequestration). A marketplace has now developed whereby “carbon credits” are bought and sold, and some rather flimsy schemes have been created.

As an example of how ludicrous this churning process is, consider the example of the DRAX power plant that is located in the U.K. This power plant was built in 1974, and burned coal to generate electricity (in a conventional steam turbine system). Starting in 2013, this power plant was converted to burn compressed wood pellets. The pellets are manufactured in Canada, and shipped to the UK from the port of Prince Rupert, BC. The pellets were originally supposed to use scrap wood left over from existing logging operations, but demand eventually required that trees be specifically grown to feed the process. It was claimed that the entire process (growing trees, converting the wood to pellets, transporting them between continents, and then burning them in a thermal power plant) was “sustainable”, because new trees were planted to replace those that were cut down!

Direct Carbon Capture(DCC)

There are several companies developing technology and equipment for actually extracting (“capturing”) CO2 from the air. The CO2 is then stored (“sequestered”) either as a gas, or converted to some other form. The justification for doing this is that governments and agencies mistakenly believe that CO2 emissions from human activities is causing the world to warm, and that not only must these emissions stop, but some of the CO2 must be removed in order to lower the concentration in the atmosphere, thereby supposedly preventing future temperature rises.

The processes used for DCC are complex, and require large amounts of energy to operate. It is claimed that the energy will come from “sustainable” sources (hydro, solar, wind, nuclear), so the whole process will help a country reach the goal of “net zero”. Funding for these projects effectively comes from selling “carbon credits”, because governments have inadvisably placed a dollar value on CO2.  If these proposed projects go ahead, the scale and costs involved will be enormous. And remember, lowering the CO2 concentration in the atmosphere by 1 ppm will only potentially reduce the temperature by between 9 and 15 thousandths of a degree C!

Energy and Transortation

As part of the charge toward the Holy Grail of “Net Zero”, the entire transportation infrastructure is being forced to dispense with the burning of fossil fuels. Governments apply so-called “Carbon Taxes” on the sale of hydrocarbon fuels, and the tax rates are methodically being increased as time goes by, in an effort to get users to switch to another type of energy.

Oil has been a major energy source for over two centuries. It has a high energy density (ie: a small and light weight amount of the substance has the potential to create a large amount of energy). A few decades ago, there was worldwide concern that we were running out of these fuels and only had a limited supply, but new exploration/extraction techniques, combined with more efficient energy use have allayed those concerns.

Fossil fuels are converted to energy by the process of combustion. Almost 40% of the material’s potential energy is extracted in modern gasoline or diesel engines, and almost 55% in modern combined-cycle gas-fired power plants. The remaining energy is turned into waste heat. In building heating applications, the fossil fuel is burned to directly create heat: this process can have efficiencies of over 95%. All of these combustion processes generate CO2, and this is the main focus of politicians, scientists, and environmentalists, despite evidence (as outlined earlier) that climate change is not being primarily driven by increases in CO2 concentration.

Wind turbines and solar cells have received most of the publicity in recent years as large arrays of these devices have been installed around the world. The biggest problem is the intermittent nature of their output. To compensate for this, excess generating capacity has to be installed, and very large energy storage devices (batteries, pumped water, etc) have to be included to ensure a reliable source of supply. If electricity is produced by techniques (such as hydro, solar, wind, or nuclear) that do not emit any greenhouse gases, there is strong political motivation to convert existing consumers of fossil fuels to use electricity as their energy source. Transportation has been a major user of fossil fuels, and the sector is highly visible to the public, so there is considerable pressure to electrify it.

Fossil fuels are an ideal way to power mobile devices (especially road vehicles, aircraft, and ships): the energy density (KW-h per Kg) is very high, and it is easy to quickly refuel as required. There has been much development in electrical technology for road vehicles, but the major problem has been the availability of electrical energy storage devices (primarily batteries) that are small and light enough to fit into the vehicle, and that have sufficient capacity to provide decent range between charges. The energy density (KW-h per Kg) of modern Li-ion batteries is about 2% that of gasoline or diesel fuel. Some electric cars have met with market success, but battery technology needs to develop a major increase in battery energy density before they are considered viable for mainstream applications, and then the problem will be one of installing enough charging infrastructure to allow for unimpeded travel without the drivers suffering from “range anxiety”.

Ships, highway trucks and airliners pose their own problems, and are unlikely to be weaned off of fossil  fuels for some time to come. These applications need energy storage devices that have much higher density (both by volume and by weight) than batteries – the use of hydrogen (produced by electrolysis of water) and fuel cells is being vigorously pursued. Hydrogen can also be burned directly in modified jet engines or even reciprocating engines, but hydrogen has storage issues that need to be addressed.

Hydrogen’s energy density (KW-h per Kg) is quite high, but it occupies a large volume, so must be stored at very high pressures if storage tanks are to be kept to a reasonable size. Hydrogen can also be stored in a liquid form, but the extremely low cryogenic temperatures required (-253°C) present significant
challenges.

If it were possible to convert all power generation, heating, and transportation applications to non fossil fuel technology, it would be possible to reduce the total amount of man-made CO2 emissions by over 50%, but this would have a negligible effect on global temperature. It would of course still be required to extract oil and natural gas from the ground for the manufacture of synthetic materials, plastics, asphalt, lubricants, and pharmaceuticals.

Summary and Conclusions

The material reviewed so far in this paper confirms that there are a large number of factors that affect the earth’s climate. Many of these are poorly understood by man, and there are some factors that probably haven’t even been discovered yet. A number of conclusions can be taken away from the information presented so far in this document:

a) Climate change is a naturally-occurring, cyclic phenomena, and it has been going on for millions of years.
b) Climate change is primarily driven by changes in the energy of the sun that impinges on the earth. The dominant factors driving this are variations in the sun (total output power, spectral distribution, sunspot cycles) Milankovitch Cycles, variations in ocean currents (ENSO, PDO, and AMO). Other factors include the effect of varying cosmic particle influx and high altitude bacteria, causing changes in cloud cover.
c) The primary greenhouse gas is water vapour. The effect of atmospheric CO2 on global temperature change is much less. Because of the non-linear effect of CO2 concentration, increases beyond the current level will have a decreasing effect on the earth’s climate.
d) Man-made CO2 does have a minor effect on global temperature changes, but it is not the dominant factor. A reduction of man-made CO2 emissions would have a negligible effect on global temperature.
e) Man’s understanding of the various climate-influencing factors is very limited.
f) Climate models are not effective at forecasting future long-term global temperatures.
g) There is very little that mankind can do to affect global temperature change. It does not make sense to introduce regulations that will have a negative impact on Western economies in a pointless attempt to change the natural rate of global climate change.
h) Mankind will have to learn to adapt to future climate changes. If mankind is still around in a few thousand years, they will then have to adapt to global cooling and glaciations!

Any legislative efforts to limit man-made carbon dioxide emissions at the local, regional, provincial, or federal levels may be well-intended, but are ultimately futile, and potentially dangerous. These efforts will harm the economy, waste resources, and not significantly affect the naturally-occurring cyclic climatic changes.